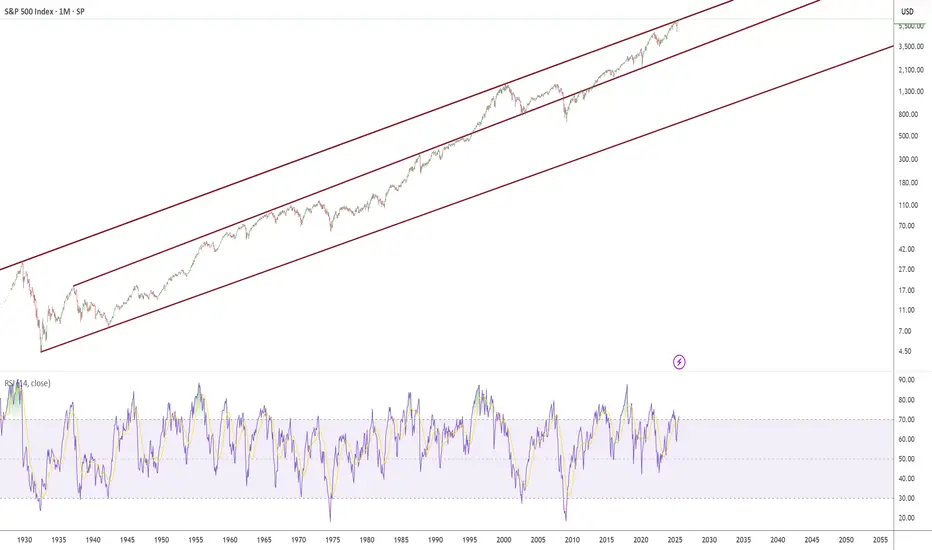
1929 to Present day Trendline Channels The chart represents some very meaningful and powerful trendlines.
I have magnetised these trend lines to be exactly on the peak of September 1929 and exactly on the peak March 2000.
I drew these lines to the high of day on the given peak days in Sep 1929 and March 2000, combined with a line extension.
(Meaning its not a manual placement this is the exact trendline channel)
Trendline validation (how many times have we tagged it per month - it has also been tagged many more days):
August 1929
September 1929
March 2000
November 2024
December 2024
January 2025
February 2025
When you zoom in to our present year/months/weeks/days, you can see we tagged the trendline November 2024 to February 2025.
We have now broken above the trendline for July and August 2025.
You will also notice a middle trendline this support formed on the 1st of March 1937 and acted as resistance until it broke through on the 1st of May 1995 about the time when everyone had a home computer and windows 95.
This middle support held strong during the 2000-2003 dotcom crash
The middle support broke during the 2008 financial crisis.
However it regained its support in 2013 and then tagging it in the 2020 covid crash.
Over nearly 100 years these channels have remained strong, it is honestly crazy to think we have now broken a 96 year old trendline in 2025.
The question is does this trendline become support or resistance?
Dotcomcrash
SPX at Great Depression and Dot-Com Crash LevelsCurrent deviation from long term mathematical model at the top of trend only reached twice in the last 100 years; once during the Great Depression and once during the top of the Dot-Com bubble.
Mathematical model = Ratio of Close to smoothed 300 Week SMA (SMA 10 of SMA 10 of SMA 70 Week Close)
