US30 I Potential upside from support 48,340 - 48,828Welcome back! Let me know your thoughts in the comments!
** US30 Analysis - Listen to video!
We recommend that you keep this on your watch list and enter when the entry criteria of your strategy is met.
Please support this idea with a LIKE and COMMENT if you find it useful and Click "Follow" on our profile if you'd like these trade ideas delivered straight to your email in the future.
Thanks for your continued support!
Dow30

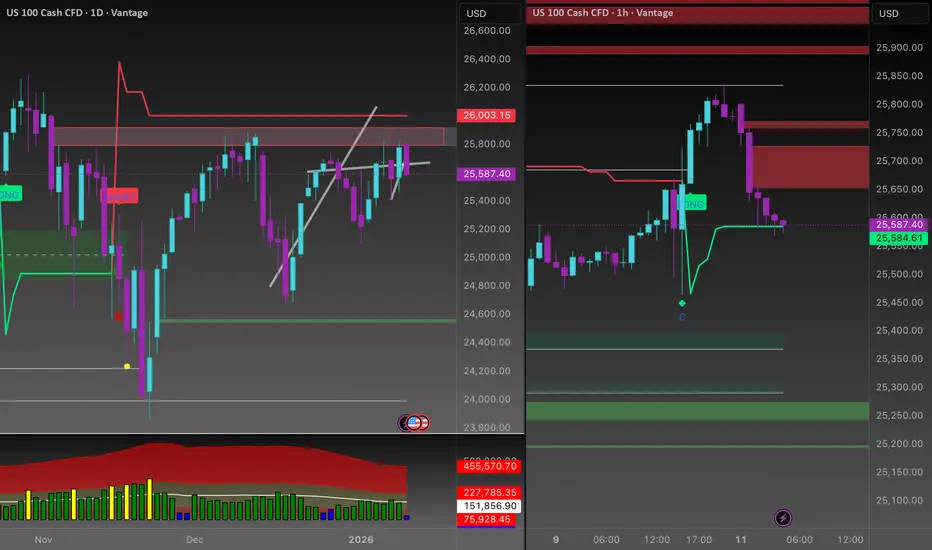
Strength is getting SOLD!CAPITALCOM:US100 Price is trading directly into a daily OG supply zone at 25,950 – 26,050, coming from a corrective push, not impulsive strength.
Higher timeframe structure remains distributional, with price sitting in premium territory.
• Daily OG supply active at 25,950 – 26,050
• No daily acceptance above 26,050
• Upside lacks displacement and follow-through
• HTF context favors sell-side positioning
Above here is not trend continuation, it’s liquidity hunting.
VANTAGE:NAS100 On the 1H, price delivered a clean expansion into OG supply, immediately followed by a sharp bearish response.
• 1H OG supply: 25,720 – 25,820
• Strong rejection and structure breakdown below 25,720
• Bullish move shows exhaustion, not accumulation
• Sell-side liquidity stacked below 25,500
This is how smart money sells into strength.
Primary Bias: Bearish below 25,720
Expectation:
• Pullbacks into 25,650 – 25,750 are sell opportunities
• Target: liquidity sweep toward 25,400 – 25,300
• Extended downside opens 25,150 if momentum accelerates
Invalidation / Cancellation:
• Clean 1H close and acceptance above 25,820
• Daily close above 26,050 cancels the sell idea completely
Until that happens, rallies are for selling, not chasing.
GET READY FOR DOW30 HIGH PROBABILITY BUY SETUP SOON!!!🚨US30 HIGH PROBABILITY BUY SETUP 🚨
* Here We Can See Clearly The Next Potential Moves For DJ30 Coming Hours/Days.
* Keep Your Eyes Close On Your Trading Positions.
* Happy PIP Hunting Traders.
FXKILLA.

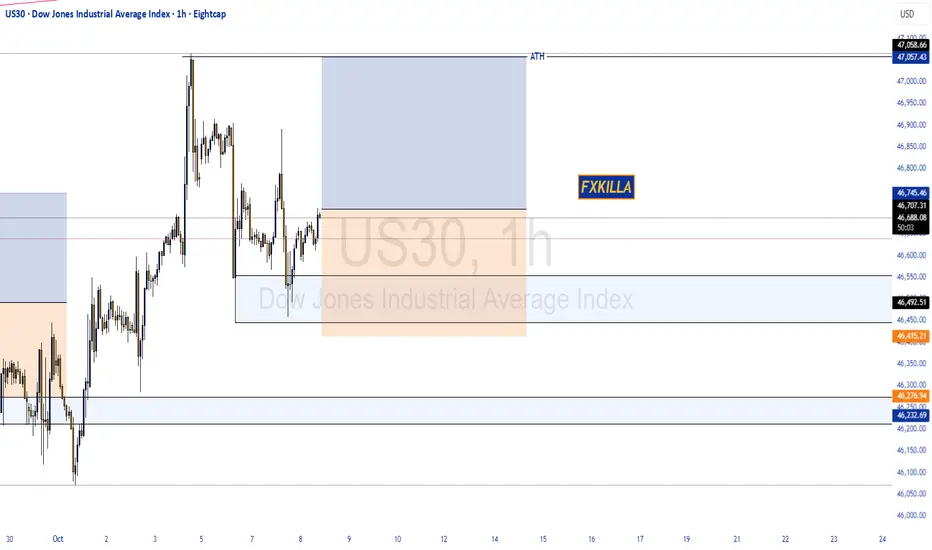
US30 DOW JONES at Resistance: Here's My Trade PlanI'm keeping a close eye on US30 right now. The market has pushed into a clean bullish breakout, printing higher highs and higher lows across both the H4 and H1 timeframes. 🚀
At the moment, price is overextended and tapping into a significant resistance zone, suggesting that a retracement is likely. Some aggressive traders may look for a counter-trend short, but that comes with elevated risk. ⚠️
Personally, I’m waiting for a healthy pullback, followed by a bullish break of structure to confirm a trend continuation setup. That’s where the higher-probability opportunity may unfold. ✔️
Not financial advice — for educational purposes only.

DOW JONES HIGH PROBABILITY SETUPS SOON!!!🚨 DOW30 HIGH PROBABILITY SELL/BUY SETUP 🚨
* Here We Can See Clearly The Next Potential Moves For US30 Coming Hours/Days.
* Keep Your Eyes Close On Your Trading Positions.
* Happy PIP Hunting Traders.
FXKILLA.

DOW JONES 30 HIGH PROBABILITY SETUP SOON!!!🚨 DJ30 HIGH PROBABILITY SELL SETUP 🚨
* Here We Can See Clearly The Next Potential Moves For US30 Coming Hours/Days.
* Keep Your Eyes Close On Your Trading Positions.
* Happy PIP Hunting Traders.
FXKILLA.

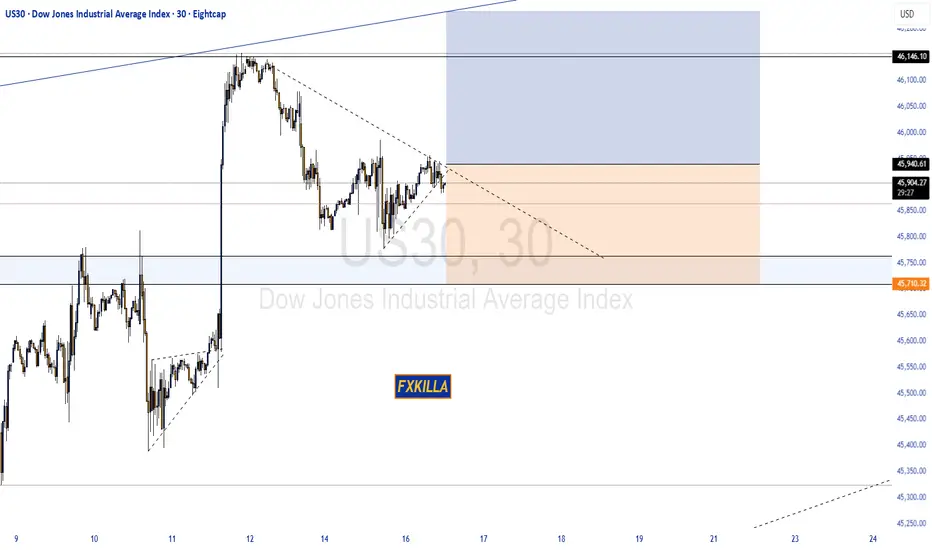
US30 Trade Plan – Range Breakout + Smart Money ManipulationI’m currently watching the US30 (Dow Jones Index) 🏦. On the 4-hour timeframe, we can see a strong uptrend forming — higher highs and higher lows 📈. Whether this trend continues remains to be seen, but having a solid trading plan is key ✅.
Here’s mine: On the 30-minute timeframe, price is currently moving within a defined range. If we see a break above the range, followed by a retracement and failed retest of the range high, I’ll be looking for a long opportunity 🚀.
If price instead breaks below the range, there could also be a short opportunity, though my preference is to stay long given the higher-timeframe bullish structure ⚙️.
⚠️ Keep an eye out for market manipulation — smart money algorithms often trigger fake breakouts to draw in buyers before sweeping liquidity and continuing the move. Stay alert and manage risk carefully.
📉 Disclaimer: This content is for educational purposes only and not financial advice.

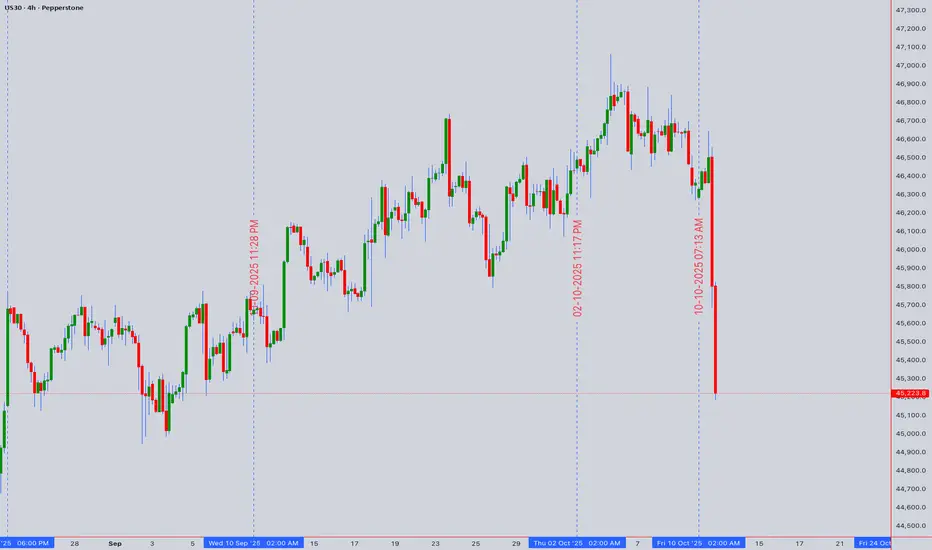
US30 (DOW30) At a Critical Juncture Amid Distribution Signs
The US30 consolidates near its all-time high of 45,223.8, showing early signs of exhaustion. Our multi-faceted analysis suggests a pivotal moment is at hand, with a bearish bias for the short term. The key level to watch is the recent high at 45,250, which is acting as a formidable resistance.
Intraday Trading Strategy (5M - 4H Charts)
Bearish Scenario: A rejection from the 45,150 - 45,250 resistance zone, confirmed by a bearish candlestick pattern (like a bearish engulfing) on the 1H chart, signals a short opportunity. Initial target is the 44,900 support (recent swing low), followed by 44,750. Use a tight stop above 45,300. The 1H RSI showing divergence and price action below the VWAP support this move.
Bullish Scenario: A decisive 4H close above 45,250 invalidates the immediate bearish outlook and could trigger a momentum buy. The target would then be an uncharted rally towards 45,500. However, low volume on any breakout would signal a potential bull trap.
Swing Trading Outlook (4H - Daily Charts)
The larger picture reveals a market potentially in a Wyckoff distribution phase. The failure to sustain new highs, coupled with rising volume on downswings, points to smart money distributing shares. An Elliott Wave count suggests we may be in a final Wave 5 extension or have completed it, priming for a larger corrective (ABC) pullback.
Swing Sell: A daily close below the key support at 44,500 would confirm a shift in medium-term momentum, opening targets down to 43,800 (50-day EMA and a significant psychological level).
Swing Buy: A sustained hold above 45,250, supported by strong volume and a bullish RSI crossover on the daily chart, would delay the bearish count and target new highs.
Key Technical Rationale:
RSI Divergence: The daily RSI is forming a bearish divergence against the higher price highs, indicating weakening momentum.
VWAP & Volume: Anchored VWAP from the last significant low shows price is extended. Recent up-moves appear on weaker volume, characteristic of a weak bullish trend.
Gann & Ichimoku: Price is trading at the upper range of a Gann square, suggesting a potential reversal zone. The Ichimoku Cloud on the 4H is thin, offering little dynamic support below 44,800.
Market Context: Geopolitical tensions and political uncertainty are injectting volatility, making risk assets like the DJI susceptible to sharp pullbacks. Traders should remain agile.
Disclaimer: This is technical analysis, not financial advice. Always use stop-losses and manage your risk accordingly.
DOW JONES HIGH PROBABILITY SETUP SOON!!!🚨 DOW30 HIGH PROBABILITY BUY SETUP 🚨
* Here We Can See Clearly The Next Potential Move For US30 Coming Hours/Days.
* Keep Your Eyes Close On Your Trading Positions.
* Happy PIP Hunting Traders.
FXKILLA.
DOW JONES HIGH PROBABILITY SETUP SOON!!!🚨 US30 HIGH PROBABILITY BUY SETUP 🚨
* Here We Can See Clearly The Next Potential Move For DOW30 Coming Hours.
* Keep Your Eyes Close On Your Trading Positions.
* Happy PIP Hunting Traders.
FXKILLA.
Dow Jones Overextended: Watching for an Institutional Unwind 📊 Dow Jones (US30) remains bullish 🟢, but in my view, it’s looking overextended 📈. Price has traded into a key level 🎯 where we could see a potential pullback, especially as we approach the end of the week 📅, when institutions and big money 💼 may begin unwinding positions.
👀 The play here is to watch for the high of the week/day ⏫ and look for a counter-trend reversal 🔄 that could drive price lower into the weekly close 📉.
⚠️ Keep in mind: Monday’s opening often creates a stop run 🛑 possibly offering a deeper pullback, giving us a double dose of liquidity grabs 💧. This sets the stage for a fairly deep retracement, which could present an opportunity to counter trend short if conditions align 🧩.
📌 My focus is on a break below the current range 🔓 as a trigger for potential entry.
⚠️ This is for educational purposes only and not financial advice 📚

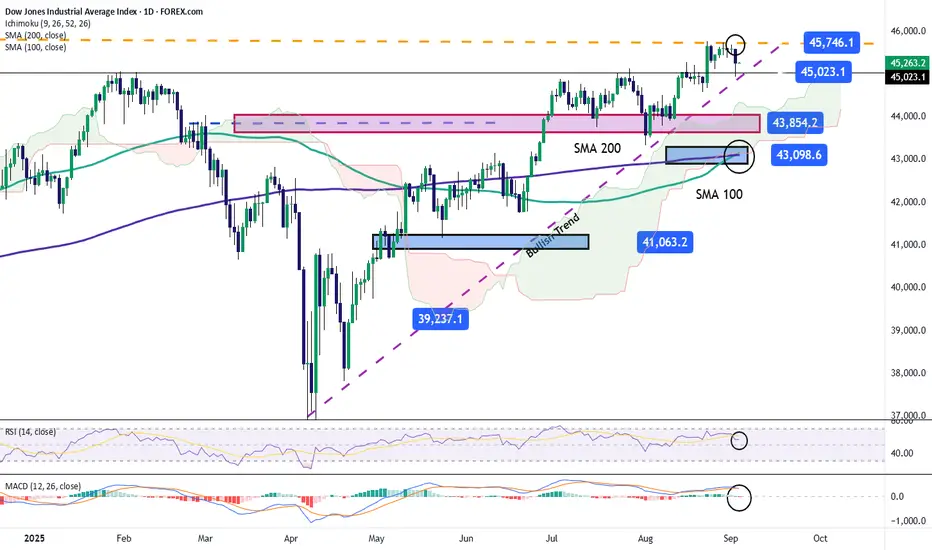
Dow Jones Falls from Record HighsOver the past two trading sessions, the Dow Jones index has declined by just over 0.7%, with selling pressure remaining constant. This move has been tied to the rebound in U.S. 10-year Treasury yields, which climbed to 4.27%, reducing the short-term appeal of equities. In addition, investors are awaiting the release of U.S. employment data at the end of the week, as the results could influence the Federal Reserve’s upcoming policy decisions.
Uptrend Remains Intact
Despite the recent pullback, the short-term declines have not been strong enough to break the uptrend that has remained in place for the past several months. This technical structure continues to be the most relevant in the short term. Unless selling pressure consolidates over more sessions, the upward trend is likely to remain dominant in the coming days.
Technical Indicators
RSI: although the RSI remains above the 50 level, it has begun to show a downward slope in the short term, which could indicate a shift in market momentum. If the line continues to decline, selling pressure could become more relevant in the sessions ahead.
MACD: the MACD histogram continues to hover around the 0 line, indicating that the average strength of the moving averages remains in neutral territory. This highlights the lack of clear direction in the short term.
Key Levels to Watch:
45,746 points – Relevant Resistance: corresponds to the Dow Jones record highs. A sustained breakout above this level could pave the way for a continuation of the uptrend.
45,023 points – Near-Term Support: coincides with recent lows and may act as a barrier for potential short-term pullbacks.
43,098 points – Critical Support: aligns with the 100- and 200-period simple moving averages. A move down to this zone could confirm a break in the uptrend and give way to a dominant bearish bias.
Written by Julian Pineda, CFA – Market Analyst
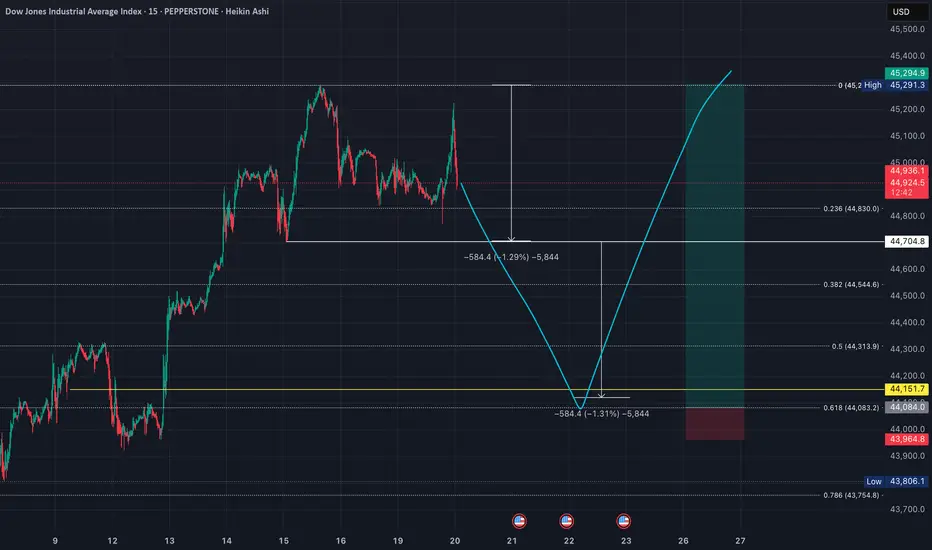
US30 (DOW): Equal Leg Projection Meets Fibonacci - Long SetupSharing my outlook on the Dow, which aligns with my NASDAQ analysis but with a specific mathematical approach. 📊
**🎯 The Setup:**
I'm targeting a long position based on an equal leg projection. Taking the range from the recent low to the all-time high, I expect a decline equal to that same distance. This projection perfectly coincides with the 0.618 Fibonacci level - a powerful confluence. 🎯
**📍 Entry Strategy:**
The beauty of this setup is the mathematical precision: the equal leg down from the high lands exactly at the 0.618 Fib level. This confluence gives me high confidence in this support zone for a potential long entry. ✅
**⚠️ Risk Management:**
Stop loss would be placed below the projected low, targeting new all-time highs. Clean entry, clear invalidation level. 🛑
**🧠 Why This Works:**
Equal leg projections are powerful tools in market analysis. When combined with key Fibonacci levels, they create high-probability reversal zones. The market often respects these mathematical relationships. 📐
**🔄 Bigger Picture Alignment:**
This setup aligns with my broader market view - expecting one final push higher before any significant correction. The Dow's equal leg projection gives us a precise entry point for this bullish thesis. 📈
**💡 Key Insight:**
When geometric projections align with Fibonacci levels, it creates what I call "mathematical harmony" in the markets. These setups often provide the best risk-adjusted opportunities. 🎵
📈 **This trade setup offers a risk-to-reward ratio of 10:1.** Without including fees, the breakeven win rate for this trade would be approximately 9.09%. Knowing these figures in advance helps me avoid emotional trading. 🧠
💡 **Pro Tip**: If you often find yourself trading based on emotions, I recommend doing this type of pre-planning and quantifying your setups before execution — it can be a simple yet highly effective improvement. ✅
---
**Trading is simple.** You don't need multiple indicators or dozens of lines on your chart. A clean and simple chart often works best — it keeps your decisions consistent and reduces uncertainty. Sure, it might not look flashy, and my analysis may seem a bit "plain" compared to others… but that's how I like it. If you find this analysis useful, feel free to follow me for more updates.
---
*Disclaimer: This post is for general informational and educational purposes only. It does not constitute financial advice, investment recommendation, or a service targeting specific investors, and should not be considered illegal or restricted information in any jurisdiction.*
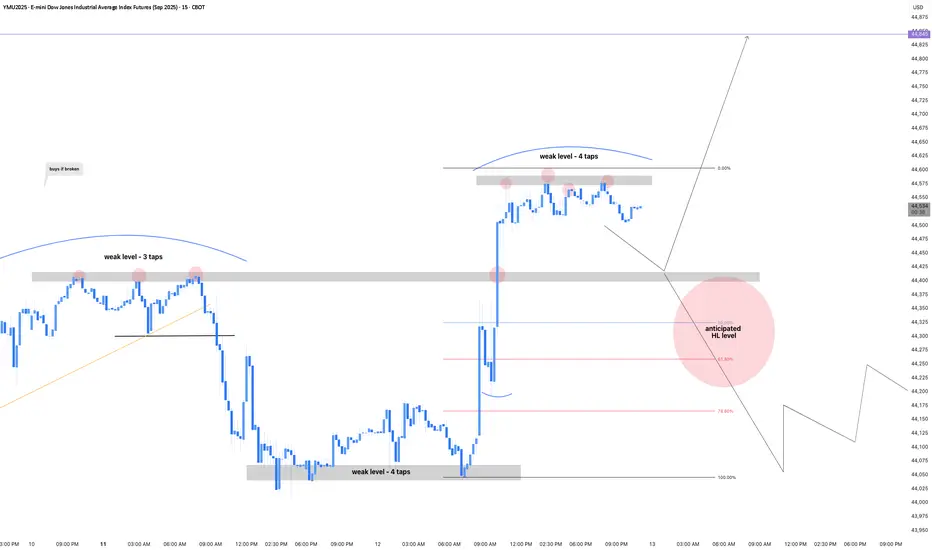
YMUjust a play idea that could happen.
remember, the market will do what it wants.
i trade price action; utilizing pivots and sessions indicators
my charts are alot less messy when im trading
overall, i see bullish for YMU but anticipating a possibly deep pullback.
thoughts on this idea?
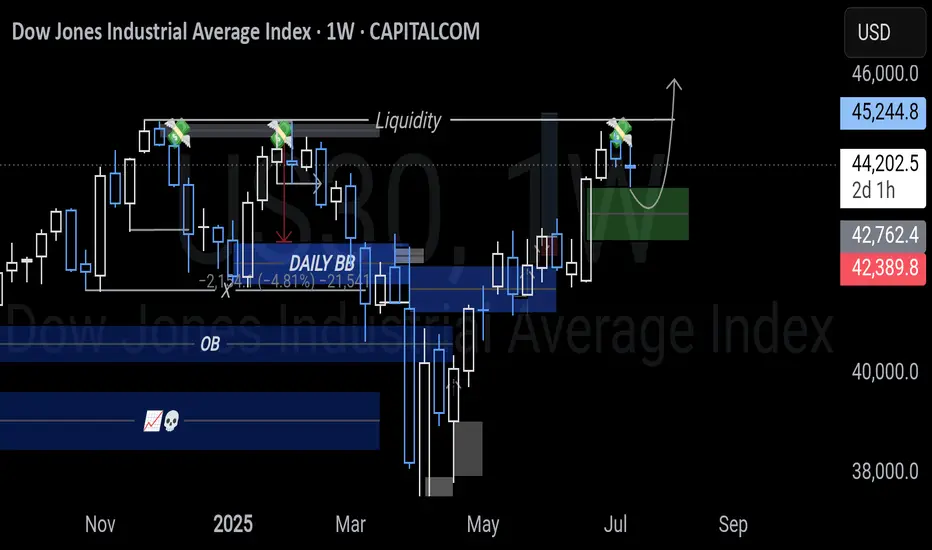
"We are going higher than 45,135.78The Dow Jones has the potential to start an upward move from the 44,811.77 and 44,732 levels, aiming for 45,135.78." CMCMARKETS:US30

US30 DOW BULLISH ANALYSIS Triple tops are the next liquidity targets from a fvg support as shown. the tops are week as we have seen NASDAQ and S&P500 hav3 liquidated their highs its. Lear US30 is following the same path.
DOW Jones go upCMCMARKETS:US30
Reaching the price level of 45,082.74 is inevitable. From the current closing price, there is a high probability of continuation toward the ATH.
However, the price levels 44,440 and 44,344.95 are also acceptable zones from which the move toward 45,082.74 may begin.
At the start of the upcoming week, as soon as the market opens, we are likely to move toward the ATH from one of these three levels.

US30 Under Pressure: Possible Short Setup Brewing on the 4HI'm currently eyeing the US30 (Dow Jones Index) for a potential short opportunity based on multi-timeframe structure 📊.
🔍 Weekly Overview:
The weekly chart continues to show sustained pressure, with this week and last week both closing bearish. The sellers are clearly in control at the macro level. 🔻
📆 Daily & 4H Structure:
Drilling down to the daily and 4-hour charts, we can clearly see a break of structure (BOS). The 4H specifically is showing textbook signs of a bearish trend with lower highs and lower lows forming consecutively 🪜🔽.
🎯 Trade Plan:
I'm watching for a pullback into equilibrium, ideally near the 50% level of the recent Fibonacci range. If price revisits that zone, I’ll be looking for short confirmations to ride the momentum back toward the previous lows, as marked on the chart. 🧠💸.

Bearish Forecast for the Dow Jones Starting May 15, 2025Bearish Forecast for the Dow Jones Starting May 15, 2025
The Dow Jones Industrial Average is poised to begin a significant decline, potentially as early as today, May 15, 2025, targeting a retest of the price low from April 7, 2025 (~36,611.78), and possibly lower. This movement is driven by renewed trade tensions, disappointing economic data, and bearish market sentiment.
1. Fundamental Factors Driving Potential Decline
Fundamental factors provide the macroeconomic and policy-driven rationale for the anticipated downturn in the Dow Jones.
1.1. Renewed Uncertainty in Trade Policy
The Dow’s rally on May 12–13, 2025, was fueled by optimism over a temporary U.S.-China tariff reduction agreement (90-day truce) announced after talks in Switzerland on May 11, 2025. However, as of May 15, 2025, investor confidence is faltering due to a lack of progress in ongoing U.S.-China trade negotiations.
Trigger for May 15: A Reuters report from May 14, 2025, notes that U.S. Trade Representative Jamieson Greer and Treasury Secretary Scott Bessent are meeting with Chinese officials, but no new agreements have been confirmed. If today’s talks fail to deliver positive outcomes or if President Trump escalates tariff rhetoric, the Dow could plummet, as seen in early April when tariffs triggered a 5.5% single-day drop. The Dow, with its heavy weighting of multinational corporations, is particularly vulnerable to trade war fears, which could drive it toward the April 7 low as investors price in higher costs and slower global growth.
1.2. Disappointments in Economic Data
CPI Reaction: The April 2025 Consumer Price Index (CPI), released on May 14, 2025, showed inflation at 2.3% annually, below the expected 2.4%. However, the Dow’s decline (-0.6%) on May 14 suggests investors expected a lower figure to support Federal Reserve rate cuts, reflecting skepticism about inflation cooling further.
Producer Price Index (PPI) Release on May 15: The PPI for April 2025, due at 8:30 AM ET (2:30 PM CEST) on May 15, 2025, is critical. A higher-than-expected PPI, potentially driven by tariff-related cost pressures, could signal rising consumer prices, reducing hopes for Fed easing and triggering a sell-off. Consensus expects a 0.2% monthly increase; a reading above 0.3% could echo the April market reaction when GDP contraction fears pushed the Dow to 36,611.78.
Consumer Sentiment: The University of Michigan Consumer Sentiment Index for May 2025, released on May 14, likely showed continued weakness (April: 52.2, a multi-year low). A further decline could heighten concerns about reduced consumer spending, impacting Dow components like Walmart and Home Depot.
1.3. Concerns Over Federal Reserve Policy
On May 7, 2025, Fed Chair Jerome Powell cited “elevated uncertainty” due to trade policies, with markets expecting 75 basis points of rate cuts in 2025, starting in July. If today’s PPI or Initial Jobless Claims (8:30 AM ET) indicate persistent inflation or economic weakness, rate cut expectations could fade, increasing borrowing costs and pressuring Dow valuations, mirroring the April 7 recession fears.
2. Technical Analysis
The Dow’s initial decline in April was approximately -19.00%, with a second impulse of similar magnitude. Technical indicators suggest a bearish setup for May 15, 2025:
Current Level: The Dow closed at 42,051.06 on May 14, 2025, down 0.6%, testing support at 42,000.
Bearish Signals: A 12-hour timeframe analysis indicates alignment for a decline, with potential bearish candlestick patterns (e.g., bearish engulfing) and overbought RSI (70). A break below 42,000 could target the 200-day moving average (40,500) and the April 7 low of 36,611.78.
Price Targets:
Retest of April 7, 2025, low: ~36,611.78
Secondary target: ~35,970.70 (based on Fibonacci extensions and prior support zones).
3. Market Sentiment and Behavioral Factors
Fragile Optimism: The Dow’s 15% recovery from April lows was driven by trade truce hopes and select stock strength. Bloomberg’s May 14, 2025, report notes Wall Street’s rebound is “showing signs of exhaustion” due to trade risks. The Dow’s May 14 weakness, led by an 18% UnitedHealth drop, could spread if negative news emerges today.
Global Correlation: Mixed Asian market performance on May 14 (e.g., Nikkei up 1.43%, India’s Nifty 50 down 1.27%) suggests vulnerability. A lower Asian open on May 15, driven by U.S. declines or trade news, could amplify selling pressure on the Dow.
4. Evidence-Based Framework for the Forecast
4.1. Catalysts for Today’s Decline (May 15, 2025)
PPI Data (8:30 AM ET): A PPI reading above 0.3% could signal sticky inflation, reducing Fed rate cut odds and sparking a sell-off.
Trade Talk Updates: Negative U.S.-China trade comments (e.g., no Geneva deal) could reignite fears, mirroring April 7.
Initial Jobless Claims (8:30 AM ET): Claims above 220,000 (vs. prior 211,000) could signal labor market weakness, fueling recession concerns.
4.2. Dow Scenario
Expect a wave-like decline with corrections. The Dow could fall below 36,611.78, potentially reaching ~35,970.70 if trade and economic pressures intensify. Extreme caution is advised in 2025.
4.3. Global Scenario for S&P 500
I anticipate a wave-like decline with intermittent corrections. I wouldn’t be surprised if the S&P 500 falls below 4,700, potentially reaching 4,200. Extreme caution is warranted this year. There’s even a theory that, starting in 2025, the U.S. dollar could lose 50% of its purchasing power.
Idea:
New Screenshot:
4.4. Oil and Geopolitical Outlook
I expect oil (Brent) to decline to the $50+/- range, from which an upward trend may begin, potentially tied to future military conflicts:
· Europe vs. Russia
· India vs. Pakistan
· Iran vs. Israel
Brent (UKOIL):
Natural Gas:

Dow Jones Correction in May 2025: Key DriversDow Jones Correction in May 2025: Key Drivers
Summary: The Dow Jones Industrial Average (DIA) is under pressure and likely headed for a correction due to the Federal Reserve’s tight monetary policy, trade uncertainty from Trump’s tariffs, and weak economic data.
Key Drivers:
➖ Federal Reserve Policy: At the May 6–7 meeting, the Fed is expected to maintain the 4.25–4.5% interest rate due to persistent inflation (2.7% forecast for 2025) and a robust labor market (+177K jobs in April). This dampens hopes for rate cuts, pressuring stocks.
➖ Trump’s Tariffs: New tariffs raise inflation risks and recession fears, reducing the appeal of Dow Jones constituents like Caterpillar and Walmart.
➖ Weak GDP and Global Volatility: A 0.3% GDP contraction in Q1 2025 and declines in Asian markets (1.6–1.8%) signal global instability.
➖ Technical Indicators: DIA trades below its 200-day moving average (~420 USD), with fewer stocks above this level (down from 76% to 55% since January), indicating market weakness.
➖ Outlook: Analysts (Long Forecast) predict volatility, with a potential drop to 38,958 in May, despite an average forecast of 43,370 by month-end. Historically, corrections occur every 1.88 years, and current conditions (tariffs, inflation, GDP) heighten the likelihood of a 10–15% decline.
Target: My downside target for the Dow Jones is 38,555.00.
Current factors and historical trends strongly suggest a near-term correction.
Idea for S&P 500:

Dow Jones US30: Spotting a Potential Pullback Opportunity!📉 The Dow Jones US 30 is currently in a dominant bearish trend on the higher timeframes, but 📈 the 1-hour chart reveals a shift in structure with bullish momentum emerging. This could signal a potential short-term retracement back into the previous range, aligning with the 50% Fibonacci retracement zone. 🔄 There’s also a bearish imbalance overhead that may attract price action for rebalancing. While this setup offers a possible buying opportunity, ⚠️ it carries significant risk given the prevailing bearish sentiment. Stay sharp and manage your risk! 🛡️
Disclaimer
⚠️ This is not financial advice. Trading involves substantial risk, and you should only trade with capital you can afford to lose. Always conduct your own analysis or consult a professional before making decisions. 💡

DOW New LowAs per my view DOW is going down side in near future , this is totaly based on price action and Astro based .

Dow Jones Testing Key Support – Bounce or Crash Ahead?The Dow Jones Industrial Average (DJIA) is currently testing a key rising trendline support, which has been a strong foundation for its uptrend since 2023. Holding this level could signal a continuation of the bullish momentum, while a breakdown may lead to a deeper correction. If the price fails to hold above this trendline, the next significant support lies around 41,000-40,000, a zone that previously acted as resistance and is now a psychological support level. In case of further weakness, the long-term trendline support around 38,000-39,000 could come into play, aligning with the Ichimoku cloud support.
For the bullish scenario to remain valid, DJIA needs to sustain above the rising trendline and reclaim recent highs. However, if sellers gain control and push prices lower, a broader pullback could unfold. Overall, the market remains in an uptrend as long as key support levels hold, but price action in the coming weeks will determine whether the index continues upward or undergoes a deeper correction.
Do like, comment and follow
