US30 | Liquidity, Structure & MA Confluence Support Bulls🚨 US30 (Dow Jones Industrial Average) CFD | Bullish Breakout Setup 📈
📊 MARKET OVERVIEW
Asset: US30 Index CFD (Dow Jones Industrial Average)
Trade Type: Day/Swing Trade Opportunity
Bias: 🟢 BULLISH - Confirmed by Moving Average Pullback & Price Action
Timeframe: H4/Daily Chart Analysis
🎯 TRADE PLAN BREAKDOWN
📍 ENTRY ZONE
Flexible Entry: ANY current price level accepted ✅
Strategy: Moving Average pullback confirmation with momentum continuation
Ideal Entry: Wait for minor retracement to key support levels for better R:R ratio
🛑 STOP LOSS (SL)
Suggested SL: @ 42,800 🔒
⚠️ DISCLAIMER: This is MY personal risk management level. NOT a recommendation! Adjust SL based on YOUR risk tolerance, account size, and trading plan. Trade at your own risk!
💰 TAKE PROFIT (TP) TARGET
Primary Target: @ 50,000 🎯
Resistance Factors:
🔴 Strong psychological resistance zone
📈 Overbought RSI conditions expected
⚡ Potential bull trap area - watch for reversal signals
🔗 Correlation with related markets may trigger profit-taking
⚠️ DISCLAIMER: This is MY target based on technical analysis. Scale out profits at YOUR discretion! Consider partial profit-taking at key levels (48,500 / 49,000 / 49,500). Protect your capital first!
🔗 CORRELATED ASSETS TO WATCH
📌 Direct Correlations:
SPX500 (S&P 500) - Major US equity index correlation ✅
NAS100 (Nasdaq 100) - Tech-heavy index showing similar momentum
US500 CFD - Broad market sentiment indicator
💵 USD-Related Pairs:
DXY (US Dollar Index) - Inverse correlation; watch for USD weakness = US30 strength 📉💹
EUR/USD - Risk-on sentiment boosts equities when EUR/USD rises
USD/JPY - Yen weakness typically supports US equity rallies
GBP/USD - Cable strength indicates risk appetite
🏆 Key Market Drivers:
VIX (Volatility Index) - Low VIX = bullish for US30 🟢
Gold (XAU/USD) - Inverse safe-haven correlation
10Y US Treasury Yields - Rising yields may pressure equities; monitor closely ⚠️
📰 FUNDAMENTAL & ECONOMIC FACTORS
🔥 Recent Economic Data (Impact on US30):
Federal Reserve Policy 🏦
Current stance: Monitor FOMC statements for rate cut signals
Lower rates = bullish for equities ✅
Any hawkish surprise = bearish risk ⚠️
US Jobs Data (NFP/Unemployment) 📊
Strong labor market = corporate earnings support = US30 bullish
Weak data = recession fears = potential reversal
Inflation Reports (CPI/PPI) 💹
Cooling inflation supports Fed rate cuts = equity rally continuation
Hot inflation = Fed stays tight = headwinds for US30
Corporate Earnings Season 🏢
Watch major Dow components: Apple, Microsoft, Boeing, Goldman Sachs
Strong earnings = momentum fuel 🚀
📅 UPCOMING NEWS EVENTS TO WATCH:
⏰ FOMC Minutes Release - Fed policy direction
⏰ US Retail Sales - Consumer spending strength
⏰ GDP Growth Data - Economic health indicator
⏰ Geopolitical Risks - Trade policies, global tensions affect sentiment
🌍 Global Market Sentiment:
Risk-On Environment: Positive for US30 📈
Safe-Haven Flows: Watch Gold/JPY for early warning signs 🚨
China Economic Data: Impacts global growth outlook
⚡ KEY TECHNICAL POINTS
✅ Bullish Signals:
Price above major moving averages (50/200 EMA)
Higher highs & higher lows structure intact
Volume confirmation on breakout candles
RSI showing bullish momentum (not yet overbought)
⚠️ Risk Factors:
Approaching major psychological resistance @ 50,000
Potential exhaustion at extended levels
Correlation breakdown if USD strengthens aggressively
Geopolitical shocks or unexpected Fed hawkishness
💡 TRADING WISDOM
🎓 Risk Management is KING:
Never risk more than 1-2% of your account per trade
Position size according to YOUR stop loss distance
Markets reward patience and discipline 🧠
🔄 Profit Protection:
Move SL to breakeven once +100 pips in profit
Scale out 50% at intermediate resistance levels
Let runners ride with trailing stops
🚀 FINAL THOUGHTS
This US30 setup combines technical confluence + fundamental tailwinds for a high-probability bullish scenario. However, markets are NEVER guaranteed! 🎲
👉 YOUR MONEY = YOUR RULES
👉 MY ANALYSIS = EDUCATIONAL PERSPECTIVE
👉 TRADE RESPONSIBLY = PROTECT YOUR CAPITAL
📣 ENGAGEMENT REMINDER:
💬 Drop a comment with YOUR analysis!
👍 Smash that LIKE button if this helps!
🔔 FOLLOW for daily market breakdowns!
📊 Share your trades - let's grow together! 🤝
🔥 Good luck, traders! May the pips be with you! 🔥
#US30 #DowJones #TradingView #DayTrading #SwingTrading #ForexTrading #IndexTrading #TechnicalAnalysis #BullishSetup #TradingIdeas #MarketAnalysis #CFDTrading #PriceAction #RiskManagement 📊💹🚀
Dowjonesanalysis

US30 Will Keep Growing!
HI,Traders !
#US30 is trading in an
Uptrend and broke
The key horizontal level
Of 48784.9 and the breakout
Is confirmed so after a potential
Retest of the support cluster
Of the rising and horizontal
Support lines below we will
Be expecting a bullish continuation !
Comment and subscribe to help us grow !

Dow Jones Short Term Sell Trading Opportunity SpottedM15 - Strong bearish pressure.
Currently it looks like a pullback is happening.
Expecting the price to drop further from the marked resistance zones.
👉 If you enjoy this analysis, please Like, Follow, and Support the profile! Your engagement motivates us to share more quality setups.

Dow Jones - Looking To Sell Pullbacks In The Short TermM15 - Strong bearish move.
No opposite signs.
Currently it looks like a pullback is happening.
Expecting bearish continuation until the two strong resistance zones hold.
If you enjoy this idea, don’t forget to LIKE 👍, FOLLOW ✅, SHARE 🙌, and COMMENT ✍! Drop your thoughts and charts below to keep the discussion going. Your support helps keep this content free and reach more people! 🚀
--------------------------------------------------------------------------------------------------------

US30 Will Grow!
HI,Traders !
#US30 is trading in an
Uptrend and the pair is
Going down to retest
The horizontal support
Around 48784.9 so after
The retest we will be
Expecting a further
Bullish move up !
Comment and subscribe to help us grow !

US30 Is Overbought!
HI,Traders !
#US30 is trading in a
Strong uptrend and the pair
Will soon hit a horizontal
Resistance of 48690.4
So after the retest a
Local bearish pullback
Is to be expected !
Comment and subscribe to help us grow !

Stocks Fall Pre-Bell as Traders Await Fed Meeting MinutesUS stock futures were mostly steady overnight Monday as Wall Street looked to regroup after a tech-led slide to begin the final stretch of 2025.
Futures tied to the Dow Jones Industrial Average futures (YM=F), the S&P 500 (ES=F), and the tech-heavy Nasdaq (NQ=F) all hovered around the flatline.
The major Wall Street indexes fell modestly Monday, as Nvidia (NVDA) and Tesla (TSLA) led megacaps lower amid a small rotation out of tech stocks. Traders are reassessing — and perhaps taking profits before the end of the year.
Tuesday brings the release of the minutes from the Federal Reserve's December meeting, at which it cut interest rates for a third straight time but signaled it may pause those cuts in the months ahead. The minutes will serve as one of the final potential market-moving catalysts of 2025, with only a reading on weekly initial jobless claims — on Wednesday morning — remaining on the calendar before the new year.
The central bank's meeting readout could add fresh insight for investors looking for clues on the Fed's next move in January, with the divisions that have gripped the central bank in 2025 likely to continue into the new year. Around 84% of bets are on the Fed standing pat at current interest rate levels next month, though traders about equally split on what the committee will do in March.
The Dow Jones (DJI) is down 0.51% moving in a bearish symmetrical triangle pattern. If the stocks keep tanking the DJI index will be approaching the $40k zone. With the RSI at 58, there are high chances that DJ:DJI might consolidate and go dipper to the $40k zone.

YM at All-Time Highs: Key Levels for Continuation or RotationUnderstanding YM and the Current Market Environment
The Dow Jones Industrial Average futures contract, commonly referred to as YM, represents a price weighted index composed of 30 large, established U.S. companies across industrials, financials, healthcare, and consumer sectors. Unlike the S&P 500, which is market capitalization weighted and broader in scope, the Dow tends to reflect performance in more mature, cyclical, and value oriented companies. Because of this composition, YM often behaves differently from the S&P 500 during periods of rotation between growth and value or when interest rate and macro expectations shift.
Over the past month, YM has generally tracked the bullish tone seen in the broader equity indices, though with its own internal rhythm. While the S&P 500 has continued to be driven by mega cap technology and growth names, YM strength has largely come from financials, industrials, and defensive value stocks. Recent price action suggests a market that remains constructive but increasingly selective, with participants sensitive to valuation, positioning, and year end flows. Overall sentiment remains cautiously bullish, though signs of short term exhaustion have appeared near the highs
What the Market has done
• Since the start of December, buyers have consistently stepped up bids, establishing higher value and maintaining control of the broader auction.
• During the second week of December, buyers defended the 1 December weekly High Value Node, which provided a clear structural base. This defense allowed prices to rotate higher and ultimately make new all time highs.
• In the third week of December, profit taking emerged from buyers near the highs. The market was unable to accept at all time highs and began auctioning lower.
• Price rotated back down toward the 1 December weekly High Value Node, where buyers once again responded and bid price higher, pushing the market back toward all time highs into last week.
• This behavior reflects a market that remains supported structurally but is increasingly two sided near extremes.
What to expect in the coming week
The key level to monitor is the 48650 area, which aligns with the previous week’s VPOC and the 15 December weekly Value Area High
Bullish scenario
• Buyers could initiate from the previous week’s close at 48998 and attempt to push price higher toward new all time highs.
• Alternatively, price may retrace back toward the 48650 area, where buyers are expected to respond and defend the level.
• A successful defense at 48650 could lead to a rotation back up toward 49294, the current all time high.
• Continued buying pressure could extend the move toward 49430, the weekly 0.5 standard deviation high.
• Profit taking may emerge near 49430, potentially causing the market to rotate lower in the short term.
• If buyers are able to maintain acceptance above this area, continuation toward 49838, the weekly 1 standard deviation high, becomes possible.
Neutral scenario
• If the market makes new all time highs but fails to accept above the 48998 previous close, sellers may respond.
• Seller response is likely near the 49420 area, which aligns with the weekly 0.5 standard deviation high.
• A failure to accept higher prices could result in a rotation back down toward the 48650 area.
• Buyers are expected to respond again near 48650, supporting price and slowing downside momentum.
• A two way auction may develop as the market works to establish higher value.
Bearish scenario
• If buyers fail to defend the 48650 level, this would indicate a breakdown in short term market structure.
• A failure at this level would likely lead the price to move lower through the 15 December weekly value area.
• The market could then auction down toward the 48170 area, which aligns with the 15 December weekly Value Area Low and the weekly 1 standard deviation low.
Conclusion
YM remains in a structurally bullish environment, but recent price action suggests a market transitioning from directional strength to balance near the highs. How price behaves around 48650 will likely determine whether buyers can continue pressing higher or whether the market needs additional time to rotate and build value. As always, context, acceptance, and response at key levels will be critical.
If you found this analysis useful, feel free to like, comment, or share your own view on YM below. Please give this a boost so that more traders in the community can participate. Thank you.
Disclaimer: This is not financial advice. Analysis is for educational purposes only; trade your own plan and manage risk.

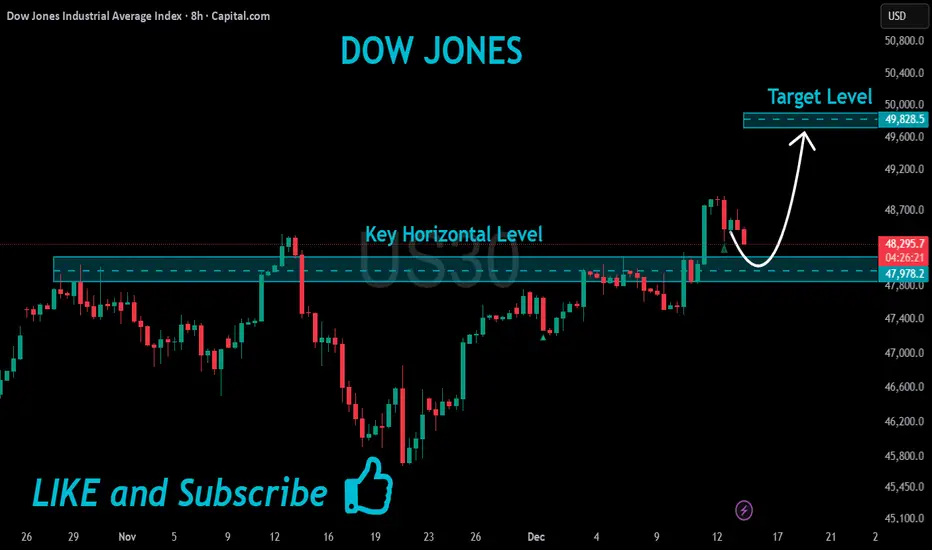
US30 Will Keep Growing!
HI,Traders !
#US30 made a bullish
Breakout of the key
Horizontal level of 47978.2
And the breakout is confirmed
So we are bullish biased
And we will be expecting
A further bullish move up !
Comment and subscribe to help us grow !
Dow Jones Shows Neutrality After Reaching New HighsDespite the bullish movement the index experienced following the Federal Reserve’s decision in the United States, the beginning of this week has shown a renewed bearish move, with the last two sessions accumulating a decline of nearly 1%. This indicates that a new selling bias has started to emerge within the broader long-term uptrend. For now, the optimism driven by expectations of lower interest rates appears to be fading, and as we enter a period with fewer relevant economic data releases, the index may begin to show a phase of steady indecision as the market prepares for the end of the year. This environment could bring a period of neutrality in the Dow Jones price action over the coming trading sessions.
Long-Term Uptrend Holds
For several months, a broad upward trend has been sustained in the Dow Jones, progressively pushing the index toward the psychological zone of 50,000 points. So far, no significant bearish corrections have emerged that could threaten this structure, making it the most important technical element to monitor in the coming weeks.
However, in the short term, as the price has reached new highs, a constant zone of indecision has begun to appear, which may lead to short-term bearish corrections if buying pressure fails to remain strong.
RSI
Currently, the RSI remains consistently above the neutral 50 level, indicating that buying momentum continues to dominate the index’s short-term movements. However, it is important to note the emergence of lower highs in the RSI, while the Dow Jones price itself continues to register higher highs. This behavior suggests the formation of a bearish divergence, signaling a possible imbalance in momentum that could lead to minor bearish corrections in the next sessions.
MACD
The MACD histogram is gradually moving back toward the zero line, which suggests a scenario of balanced momentum in short-term moving averages. If this behavior continues, the Dow Jones price may enter a more prolonged phase of indecision, with less directional movement.
Key Levels to Watch
48,850 points – Main resistance:
The newest high, now acting as the most important resistance. Price movements that consistently break above this level would strengthen the bullish bias and could extend the current long-term uptrend.
48,051 points – Nearby barrier:
A short-term neutrality zone that may serve as support against potential bearish corrections.
47,156 points – Important support:
This level aligns with the 50-period simple moving average and represents the key support for bearish movements. If the price retraces back to this area, the dominant uptrend may begin to lose strength, potentially activating a period of neutrality and leading to a short-term sideways range.
Written by Julian Pineda, CFA, CMT – Market Analyst

The Road to DOW 100KWhy the Fourth Turning Won’t Resolve Until Super Cycle Wave III Peaks and Wave IV Finds Bottom:
As we close out 2025 with the Dow Jones Industrial Average within reach of the psychological 50,000 level and despite all the well-deserved doom and gloom, the question on every die-hard bullish investor’s mind is not if the index will reach 100,000, but when — and what price will be paid along the way.
Some analysts interpret the structure as Grand Super Cycle Wave III (or V), depending on where they anchor the pre-industrial baseline. This distinction does not alter the implications: under both counts, the current advance is still part of an extended third wave, and third waves are not where secular crises resolve. They are where excess accumulates.
The rarely seen proprietary chart above from 1693, which splices British Stock prices and the Clement Burgess Index to the Dow, presents a radical yet rigorous Elliott Wave-based perspective:
Before unpacking the connections, a brief orientation is helpful. Elliott Wave degree structures range from small, short-term patterns up to century-scale formations known as Cycle, Super Cycle, and Grand Super Cycle. These higher-order waves capture long economic booms, demographic arcs, technological eras, and broad civilizational moods. When an impulse of this magnitude is still unfolding, the society riding atop it rarely enters true crisis resolution until the wave completes.
The entire advance of the Dow from the 1896 low is part of one single Super Cycle III wave. It is currently in the late stages of a smaller and ongoing 16-year Cycle Wave V within a larger GRAND SUPER CYCLE Wave III (or V, depending on the higher-degree interpretation). The implications are profound.
NOTE: It took 66 years (1900-1966) for the Dow to advance 10x from 100 to 1000, then only 33 years (1966-1999) for another 10x move from 1000 to 10,000. If Elliott’s rule of alternation applies, it might be 66 years from 1999, or 2065, before the Dow advances another 10x from 10,000 to the 100,000 level. Should a Venezuela-like inflation occur in the coming years, it is conceivable that the Dow reaches its 10x 100K milestone 33 years from 1999, or by 2032.
The generational crisis known as the Fourth Turning — the societal upheaval Strauss and Howe originally predicted would end by 2026 — will not find resolution until Super Cycle Wave III tops and its corresponding Wave IV bottoms, likely sometime between 2030 and 2036.
BULLISH NOTE: As captioned beneath the chart above, it is plausible that strong inflationary winds can extend the current 16-year Cycle Wave V to 2030-2032, inverting our suspicion for a severe decline into this period. If this occurs, Super Cycle III will have thrown over the upper trend channel and be marked accordingly.
Because Super Cycle III has not yet peaked, the conditions required for a true Fourth Turning catharsis have not yet formed. Instead of concluding, the crisis continues to compound—geopolitical fractures, monetary instability, demographic strain—held in suspension by a still-advancing secular market wave. The tension builds, but the break has not arrived.
Until Super Cycle III peaks, perhaps in 2026, when it surpasses the 5X threshold of 50K after passing its last major 10X milestone at 10K in 1999, the path remains upward with violent trepidation.
The Grand Channel: A 330-Year Perspective
When British stock data from 1693 is spliced with the Dow Jones Industrial Average beginning in 1896, a remarkable parallel channel emerges:
The lower trendline connects the Clement Burgess 1857 low, the 1896 low, and the 1932 low.
The upper trendline is a parallel copy drawn from the 1720 South Sea Bubble peak, which aligns rather nicely with the current print highs in the Dow for 2025-2026. A throw-over above the upper trend channel is always possible.
This channel has contained the entire modern equity advance for over three centuries. The current price action is pressing hard against the upper boundary — a classic termination signal in Elliott Wave analysis.
The Grand Super Cycle uptrend channel from 1693 to the present.
Super Cycle Degree: One Unfolding Impulse
The entire move from 1896 is labeled as a single Super Cycle advance:
Super Cycle I — 1857 low to 1881 high
Super Cycle II — 1929 crested with an expanded Cycle degree B wave peak high leading to the 1932 low (a sharp, primary five-wave down Cycle degree C-Wave correction terminating Super Cycle II).
Super Cycle III — 1932 low to present (extended, currently completing an extended Cycle V)
The post-1932 advance is not five complete Super Cycle waves. It is an extended third at Super Cycle degree still in progress, with the current rally from the 2009 low representing Cycle V within that larger III wave.
This labeling reconciles and defines the extraordinary duration and amplitude of the bull market without violating Elliott’s rules of proportionality and alternation.
Primary and Cycle Degree: The Final Leg
Within the ongoing Super Cycle III, the advance since 1932 subdivides into five clear Cycle waves with an additional subdivision at the primary degree between 1942 and 1999.:
Cycle I — 1932–1937
Cycle II — 1937–1942
Subdivided Primary Degree (within Cycle III):
Primary 1 — 1942-1946
Primary 2 — 1946-1949
Primary 3 — 1949-1965
Primary 4 — 1965-1982
Primary 5 — 1982-1999
Cycle III — 1942–1999
Cycle IV — 1999–2009
Cycle V — 2009-present (extended, currently in its terminal phase 2025-2032)
The post-2009 Cycle degree rally is the last of Cycle V (terminal to Super Cycle III from the 1932 low) — the structure that produced the extraordinary gains of the past sixteen years.
FOUR DEGREES of TREND: Grand Super Cycle Waves are the largest Roman Numerals noted in red, Super Cycle labels are in black, Cycle degree in blue, and the smallest Primary waves are illustrated with standard red numerals and letters.
The Fourth Turning Resolution
The Strauss-Howe updated Fourth Turning framework predicts a period of intense societal crisis peaking in the late 2020s to early 2030s.
In Elliott Wave terms, this crisis corresponds to Super Cycle Wave IV — the deep, multi-year correction that must follow the completion of Super Cycle III.
This correction will likely take the form of a sharp zig-zag, or complex combination, lasting 3–8 years and retracing at least 38% of the entire advance from 1857. Such a decline would drive the Dow down toward the COVID lows of 2020, near the 18,000 level.
The resolution of this Fourth Turning — the rebirth phase — will not begin until Super Cycle Wave IV finds its bottom, projected to occur within the 2030–2036 timeframe.
Only then will Super Cycle Wave V begin — the final advance that carries the Dow to its next 10x target of 100,000.
Conclusion
The market is not yet in the final stages of a multi-century bull market ending in a grand cycle collapse, but rather approaching a Super Cycle Wave IV bear market event , which could still strip the Dow by 60-65% before the Super Cycle V wave bull resumes. The Dow is in the late stages of a multi-century third wave that still has one more explosive leg ahead to tag the Grand Super Cycle terminal.
The Fourth Turning crisis will be severe, but it will be a corrective event within a larger bullish structure — not the end of the Grand Super Cycle advance.
Although investors may wish to sidestep the pending decline, those who mistake Super Cycle Wave IV for the end of the bull market will miss the greatest opportunity of the coming generation.
The channel is speaking.
The waves are clear.
And after some much-needed, long overdue, and well-deserved pain, 100,000 on the Dow remains not just possible — but inevitable. Let’s hope so, anyway.

US30: Late-Cycle Pop or Pullback Setup?The 𝐃𝐨𝐰 is pressing fresh highs into a historically soft seasonal window with stretched momentum and limited follow-through. I’m initiating/adding to a daily timeframe short aiming for a retrace back into prior breakout territory. My baseline path is a drift lower toward 44,500–44,000 (T1) and then the broader demand band near 43,000–42,2500 (T2), where I’ll reassess.
This isn’t a “crash” call—just a tactical mean-reversion as macro tailwinds fade, breadth narrows and the first Fed cut shifts the narrative from “rates down” to “why they’re down.”
Technicals:
• Stretched swing: Price has stair-stepped higher with shallow pullbacks; we’re now extended above the 50/100-DMA stack with waning impulse on push days (smaller real bodies, upper wicks).
• Local resistance: Repeated stalls into the same supply shelf. I’m leaning into the most recent failed extension and fading the box.
Structure map:
• Entry: around/into the failed-break zone 46.4k area.
• Invalidation: daily close > recent spike highs around 47.7k-48.0k.
• Targets: T1 45,000–44,500 (prior ATH retest / micro-POC region); T2 44,000–43,000.
• Risk: 0.5–1.0R per add; scale in only on rejection prints or lower-highs.
Fundamentals:
1) The first Fed cut is not automatically bullish.
The Fed delivered a 25 bps cut in September and signaled more easing, which historically can coincide with late-cycle growth scares and choppier equity returns rather than a straight-line melt-up. The cut was framed around cooling activity and inflation progress. 
2) Growth data is mixed—manufacturing still weak.
The ISM Manufacturing PMI remained in contraction in August (48.7)—below the 50 expansion line—signaling ongoing softness in goods demand. That is typically a headwind for the Dow’s cyclical mix. 
3) ES500 (S&P 500) breadth is narrow; concentration risk elevated.
Mega-caps continue to dominate performance and index leadership, while equal-weight underperforms and concentration risk stays high—conditions that historically increase pullback vulnerability. 
4) Valuations are rich versus history.
FactSet’s mid-summer forward 12-month P/E for the S&P 500 hovered well above 5- and 10-year averages (>22x vs. ~19x/17x), leaving less cushion if growth wobbles or margins compress. 
5) Sentiment & seasonality aren’t tailwinds.
September/early Q4 are seasonally tricky—historically the weakest stretch for US equities—just as the market tries to price the path of cuts vs. growth. 
6) Policy & trade headline risk.
Tariff timelines and “reciprocal” duties remain in play (with officials signaling Aug-1 implementation and additional measures possible), a rolling overhang for global cyclicals and exporters tied into the Dow complex. 
Note: Please remember to adjust this trade idea according to your individual trading conditions, including position size, broker-specific price variations, and any relevant external factors. Every trader’s situation is unique, so it’s crucial to tailor your approach to your own risk tolerance and market environment.

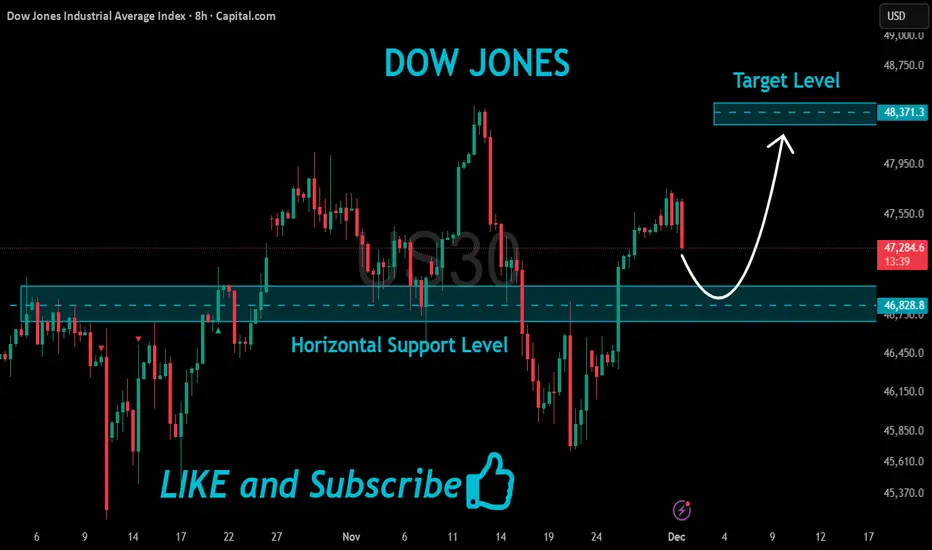
US30 Risky Long!
HI,Traders !
#US30 is about to retest
A horizontal support level
Of 46828.8 while trading
In a local uptrend so
We will be expecting a
Local bullish rebound
And a further move up !
Comment and subscribe to help us grow !
US30 Dow Jones Weekly Open Retest Strategy’m watching US30 (Dow Jones) closely right now, and it’s been in a strong bullish trend over the last two weeks. 📈🔥 We’ve seen two powerful drives to the upside, and there’s a good chance we could get that classic third drive completing a three-drive pattern before the week ends.
As price pushed higher, it’s already dipped back down into sell-side liquidity, clearing out those resting lows. That kind of move often sets the stage for another leg higher, so it’s definitely possible we see US30 continue north from the current levels. ⬆️💰
At the same time, it wouldn’t surprise me to see price pull back a bit more, possibly dipping below the weekly open to rebalance before making its next move.
Either way, my focus is on the weekly open. I want to see price break through it, come back, retest it, and show me that the level is now acting as support. That retest is the zone where I’d be interested in looking for long opportunities. 🟩📊
Stay patient and wait for clean structure.
Not financial advice.

Dow Jones Attempts to Reach New HighsThe index has managed to maintain a gain of more than 2% over the past six trading sessions, attempting once again to approach its historical highs as the market holds a consistent short-term bullish bias. For now, buying pressure has remained supported by a temporary rebound in market confidence, driven by expectations of lower interest rates from the Federal Reserve next week. If this improvement in confidence continues, current buying pressure could remain dominant in the sessions ahead.
Uptrend Line Remains Relevant
The long-term upward trendline visible in the Dow Jones has continued to hold despite recent fluctuations, and so far, no meaningful bearish correction has emerged to threaten its structure in the short term. As a result, it remains the most important technical factor to watch, especially if price manages to reach the previous high zone again, which would confirm a dominant bullish bias heading into year-end.
RSI
The RSI continues to fluctuate slightly above the neutral 50 level, suggesting that average buying momentum over the last 14 sessions remains dominant. If the RSI line continues to show steady growth, buying pressure could strengthen further.
MACD
The MACD remains very close to the neutral zero line, reflecting a sense of neutrality in the strength of short-term moving averages. Although there is buying pressure in the Dow Jones, the lack of a clear recovery in the histogram may lead to a period of consistent indecision, producing narrow-range candles and signaling a possible pause in the bullish momentum.
Key Levels to Watch:
48,248 points – Major resistance
This level corresponds to the historical highs and remains the most important bullish barrier. Buying movements approaching this zone could reactivate a strong bullish bias and extend the current upward trendline.
46,821 points – Nearby barrier
A level aligned with the 50-period simple moving average. It may serve as a key area to monitor in case of potential short-term bearish corrections.
45,677 points – Primary support
This level corresponds to the recent lows. If price approaches this zone again through bearish movements, it could signal the end of the current uptrend and open the door to a more meaningful bearish bias in the short term.
Written by Julian Pineda, CFA, CMT – Market Analyst


US30 DOW JONES at Resistance: Here's My Trade PlanI'm keeping a close eye on US30 right now. The market has pushed into a clean bullish breakout, printing higher highs and higher lows across both the H4 and H1 timeframes. 🚀
At the moment, price is overextended and tapping into a significant resistance zone, suggesting that a retracement is likely. Some aggressive traders may look for a counter-trend short, but that comes with elevated risk. ⚠️
Personally, I’m waiting for a healthy pullback, followed by a bullish break of structure to confirm a trend continuation setup. That’s where the higher-probability opportunity may unfold. ✔️
Not financial advice — for educational purposes only.

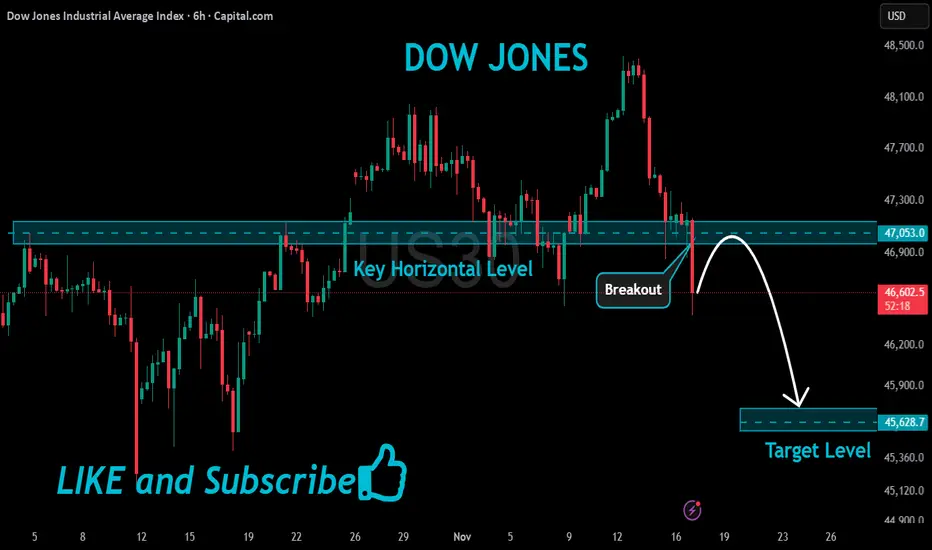
US30 Bearish Breakout!
HI,Traders !
#US30 made a bearish
Breakout of the key horizontal
Level of 47053.0 and the
Breakout is confirmed
So we are bearish biased
And we will be expecting
A further bearish move down !
Comment and subscribe to help us grow !
Dow Jones - Looking To Sell Pullbacks In The Short TermH1 - Strong bearish move.
No opposite signs.
Expecting bearish continuation until the two Fibonacci resistance zones hold.
If you enjoy this idea, don’t forget to LIKE 👍, FOLLOW ✅, SHARE 🙌, and COMMENT ✍! Drop your thoughts and charts below to keep the discussion going. Your support helps keep this content free and reach more people! 🚀
-------------------------------------------------------------------------------------------------------------------

Trading US30 DOW JONES: Bullish Momentum Here's My Trade PlanYesterday in my video 🎥, I mentioned that if US30 broke out to the upside, I'd look to enter long. That’s exactly what happened—big breakout! 🌟 Now, I’m waiting for a pullback 🕰️ to my optimal entry zone and a confirmed market structure shift for another buy opportunity 💵. (Not financial advice) 📝

US30 Strategy: Waiting for Confirmation Amid Conflicting Trends🔥📉 Currently checking out the US30 (Dow Jones)! On the ⏰ 4-hour chart, the vibe is definitely bearish, but when you zoom out to the 📅 daily chart, things look much more bullish 🚀. For me, this index is at a real crossroads! 👉
🔎 On the 30-minute chart, I’m watching closely for a bullish breakout above the recent high and a key break of structure 🟢📈 — that would spark a potential buy opportunity!
💼 If instead, price slips below the current high and we see a bearish shift in structure 🚩📉, I’m eyeing a possible sell setup!
❗️Of course, this is just my view, not financial advice! 🚫💸

US30 Risky Short!
HI,Traders !
#US30 is growing now
But a horizontal resistance
Level of 47513.8 from where
We will be expecting a local
Pullback and a local move down !
Comment and subscribe to help us grow !

US30 Trade Plan – Range Breakout + Smart Money ManipulationI’m currently watching the US30 (Dow Jones Index) 🏦. On the 4-hour timeframe, we can see a strong uptrend forming — higher highs and higher lows 📈. Whether this trend continues remains to be seen, but having a solid trading plan is key ✅.
Here’s mine: On the 30-minute timeframe, price is currently moving within a defined range. If we see a break above the range, followed by a retracement and failed retest of the range high, I’ll be looking for a long opportunity 🚀.
If price instead breaks below the range, there could also be a short opportunity, though my preference is to stay long given the higher-timeframe bullish structure ⚙️.
⚠️ Keep an eye out for market manipulation — smart money algorithms often trigger fake breakouts to draw in buyers before sweeping liquidity and continuing the move. Stay alert and manage risk carefully.
📉 Disclaimer: This content is for educational purposes only and not financial advice.
