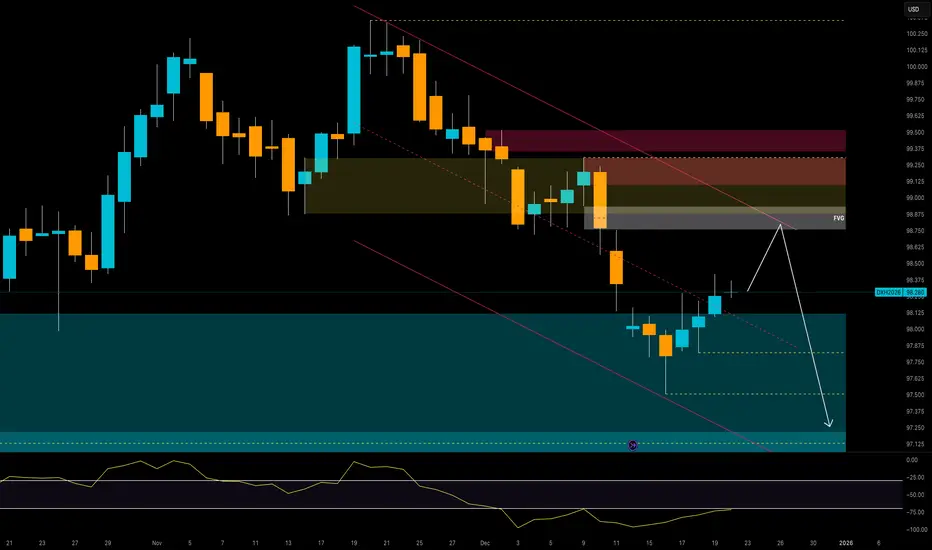
US Dollar Index – Temporary Relief Before Further Downside?The US Dollar Index continues to trade under structural pressure on the daily chart, following the strong downside impulse that broke November’s value area and pushed price into a key weekly demand zone around 97.90–97.30. After a clear momentum swing lower, the index is now showing early signs of corrective strength, but the broader context continues to favor weakness into year-end.
On the technical side, price has reacted from support and is attempting a corrective retracement toward the 98.75–99.00 supply zone. This zone aligns with:
– Daily bearish trendline resistance
– A fresh Fair Value Gap (FVG)
– Previous structure imbalance
If price completes this pullback, the zone provides a high-probability region for bearish continuation targeting new lows into 97.50–97.20. The RSI remains below the midline, indicating momentum has not fully shifted to the upside and that current strength is corrective, not impulsive.
Seasonality reinforces this bearish narrative. December historically records negative averages in the Dollar Index across virtually every timeframe. The 20-year average in particular shows strong downward pressure late in the month, with typical weakness accelerating into year-end. Current price action is consistent with this seasonal pattern.
From a positioning standpoint, the latest COT report shows Non-Commercial traders significantly net short, with shorts sitting at 28,652 vs. longs at 14,778. This imbalance continues to reflect confidence in downside continuation. At the same time, the Commercial category reduced long exposure and increased shorts, adding further weight to bearish bias. The aggregate positioning structure is clearly aligned with the existing downtrend.
Overall, the Dollar Index remains structurally bearish. A final upside correction into the 98.75–99.00 supply zone could precede the next leg lower. Only a clean break and close above 99.20 would weaken the bear case and signal a potential shift in directional bias. Until then, rallies remain sell-side opportunities.
DXI
Analysis of the Dollar Index (DXY)Overview: On Tuesday, the Dollar Index (DXY) showed weak performance, failing to consolidate the partial recovery seen on Monday after last week's sharp decline. Although the dollar posted gains against major Asian currencies, such as the Japanese Yen (JPY) and the Korean Won (KRW), these gains were quickly erased during the US trading session. The return of a "risk-on" sentiment in the markets, with stock indices rising in Asia, Europe, and US futures, has led investors to move away from safe-haven assets, further weighing on the dollar.
Fundamental Factors:
Market Sentiment: The return of the "risk-on" sentiment has favored riskier assets at the expense of the US dollar. The easing of tensions in the Middle East has helped reduce flows into safe-haven assets, exerting bearish pressure on the DXY.
Economic Data: On Tuesday, attention will be focused on the weekly mortgage applications data published by the MBA and the EIA's report on US crude oil inventories. Additionally, the speech by Federal Reserve's Waller could provide further insight into the direction of US monetary policy.
Currency Performance: The EUR/USD has resumed its bullish trend, partially erasing the weakness seen at the start of the week. The British pound (GBP/USD) reached over two-year highs, supported by expectations that the Bank of England (BoE) will not cut rates as much as the markets anticipated.
Commodities and Precious Metals: WTI saw a sharp decline, breaking a three-day winning streak due to renewed demand concerns and some profit-taking. Gold prices alternated between gains and losses above the $2,500 per ounce mark, while silver prices remained near the $30.00 per ounce level.

no freaking wayWe are in a bulll run! no way za dollar will manage to break resistance :D whoz with me?

DJI LONG FROM SUPPORT
Hello, Friends!
A recent breakout signals
That the bulls are still strong
And I am growing in confidence
That a bullish surge is coming!
BUY!
✅LIKE AND COMMENT MY IDEAS✅

DXY - THE BIGGER THEY ARE...DXY has been moving without any real pullback which is dangerous. This is to do with the FED HIKE RATE, we can almost guarantee a 50 points bias which is why price is surging but what happens when the data is released? we have already had the move and DXY falls off.
104.150-300 is the next major resistance area for DXY and it will have to crash somewhere has we are wiping out yearly highs. The crash is looming, you've been warned.
---------------------------------------------------------------------------------
Pip count this week 💰🏆
WTI SHORT / 74 pips ✅
GBPUSD LONG / -26 pips ❌
WTI SHORT / 185 pips ✅
WTI SHORT / -10 pips ❌
GOLD BUY / 70 pips ✅
GOLD SELL / 170 pips ✅
WTI SHORT / 200 pips ✅
GOLD SELL / -30 pips ❌
GBPUSD SELL / 67 pips ✅
GOLD SELL / 30 pips ✅
WTI SHORT / 60 pips ✅
WTI SHORT / 130 pips ✅
GBPUSD SELL / -30 pips ❌
GBPUSD SELL / -15 pips ❌
WTI SELL / -70 pips ❌
15 trades taken
9 wins ✅
6 losses ❌
60% win rate
Combined in the communities this is 805 pips which is an outrageous way to close out the month!🤯

DXI with divergences and losing momentumDXI with divergences and losing momentum.
Be careful, patient and discipline.
This post does not provide financial advice. It is for educational purposes only! You can use the information from the post to make your own trading plan for the market.
But you must do your own research and use it as the priority. Trading is risky, and it is not suitable for everyone. Only you can be responsible for your trading.
Good trades to All.

DOLLAR INDEX CHART UPDATE.....SELL
Dollar index chart break out support zone 92.500 level and retest that zone.
so, now its possible to reach 92.000 ,91.680 .up to 91.450 level.
dear Traders, here is the full analysis for this pair,
let me know in the comment section below if you have any questions,
I suggest you keep this pair on your watch list and see if
the rules of your strategy are satisfied.

Get out of the Dollar!!!The US dollar has formed a bearish signal with a massive 5 year head and shoulders pattern. Looking like it will crash in to 2021 after a possible a short rally. Hard assets is where to be. Not financial advice. Trade at own risk.
*Money Print only goes so far. Short term satisfaction is long term pain*


USD possible pull-back pointIt seems we were in a big correction structure (shown with dashed lines) and from here we can expect at least a pull back to 38.2% of recent up move or even deeper, it depends to the shape of pull back. (check the 4h chart too for finding possible entry point)
