Bullish momentum set to continue?The US Dollar Index (DXY) is falling towards the pivot, which is a pullback suport and could bounce to the 1st resistance.
Pivot: 99.53
1st Support: 98.55
1st Resistance: 101.46
Disclaimer:
The above opinions given constitute general market commentary, and do not constitute the opinion or advice of IC Markets or any form of personal or investment advice.
Any opinions, news, research, analyses, prices, other information, or links to third-party sites contained on this website are provided on an "as-is" basis, are intended only to be informative, is not an advice nor a recommendation, nor research, or a record of our trading prices, or an offer of, or solicitation for a transaction in any financial instrument and thus should not be treated as such. The information provided does not involve any specific investment objectives, financial situation and needs of any specific person who may receive it. Please be aware, that past performance is not a reliable indicator of future performance and/or results. Past Performance or Forward-looking scenarios based upon the reasonable beliefs of the third-party provider are not a guarantee of future performance. Actual results may differ materially from those anticipated in forward-looking or past performance statements. IC Markets makes no representation or warranty and assumes no liability as to the accuracy or completeness of the information provided, nor any loss arising from any investment based on a recommendation, forecast or any information supplied by any third-party.
Dxyanalysis

DXYU.S Dollar Index
- Completed " 12345 " Impulsive Waves
- Break of Structure
- Bullish Channel as an corrective pattern in Long Time Frame
- Order Block
- RSI - Divergence

DXY FRGNT Daily Forecast -Q4 | W45 | D3| Y25 |📅 Q4 | W45 | D3| Y25 |
📊 DXY FRGNT Daily Forecast
🔍 Analysis Approach:
I’m applying Smart Money Concepts, focusing on:
Identifying Points of Interest on the Higher Time Frames (HTFs) 🕰️
Using those POIs to define a clear trading range 📐
Refining those zones on Lower Time Frames (LTFs) 🔎
Waiting for a Break of Structure (BoS) for confirmation ✅
This method allows me to stay precise, disciplined, and aligned with the market narrative, rather than chasing price.
💡 My Motto:
"Capital management, discipline, and consistency in your trading edge."
A positive risk-to-reward ratio, paired with a high win rate, is the backbone of any solid trading plan 📈🔐
⚠️ Losses?
They’re part of the mathematical game of trading 🎲
They don’t define you — they’re necessary, they happen, and we move forward 📊➡️
🙏 I appreciate you taking the time to review my Daily Forecast.
Stay sharp, stay consistent, and protect your capital
— FRNGT 🚀
TVC:DXY

DXY Daily Map for 3 to 7 November 2025What this is
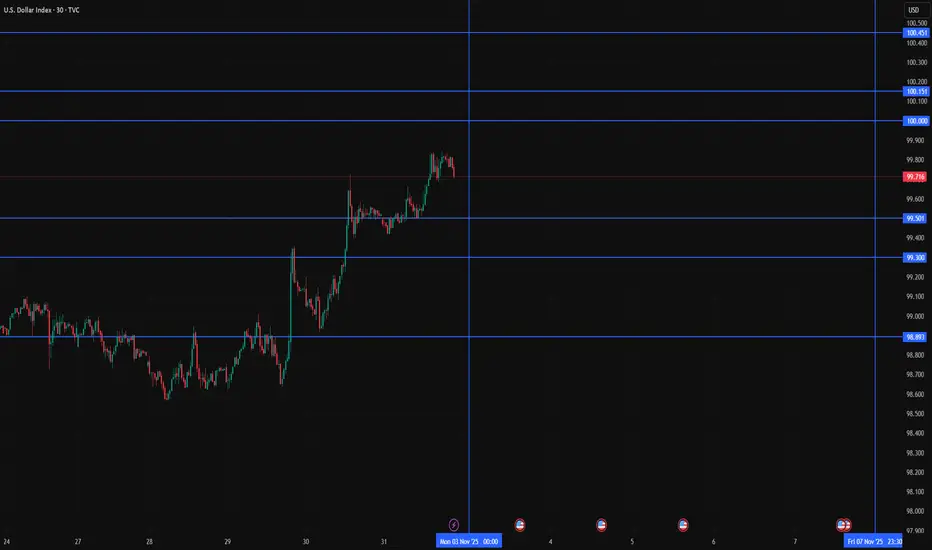
A clean, event aware plan for the Dollar Index for the week ahead. We start the week with DXY holding the ninety nine handle and sitting just below the round one hundred line. The location is the story. Round numbers compress behavior. If you pre mark the right shelves and then trade the reaction to data and auction tone, you can avoid most of the week’s traps while still catching the meaningful moves.
Chart setup
Use TVC:DXY on the daily and one hour. Keep the chart clean. Draw only the bands you will act on.
• 100.00 round number
• 100.15 to 100.45 first resistance band
• 100.50 to 101.00 second resistance band
• 99.50 to 99.30 first support shelf
• 98.90 to 98.60 second support shelf
• 98.20 daily defense line
Add a fifteen minute ATR for sizing. No other overlays. You do not need them.
Why this week matters
The heaviest flow sits midweek when private labor gauges, services surveys, and refunding headlines can all hit inside a tight window. On Thursday the Bank of England adds a cross current through GBP and EUR which together carry real weight inside DXY. You do not have to predict any of these. You only need to decide what you will do if price reaches your bands with momentum or with rejection.
How to read the round number
One hundred is not a signal. It is a liquidity pocket. The first touch after a period below tends to be noisy because participants with different time frames meet there. The more disciplined path is to let the first touch play out, then trade the second decision. If a fifteen minute close accepts above 100.20 and pullbacks hold, you have confirmation to work the first band. If the first test spikes and fails, the wick itself gives you a clear invalidation for a fade back toward 99.50.
Scenarios to plan for
Acceptance above the first band
Price pushes through 100.15 and holds above 100.20 on a fifteen minute close after firm services or a solid tone in rates. The plan is to buy the first clean retest of 100.20 with a stop a few ticks below the retest low. First target 100.45. Second target 100.80 to 101.00 if the tape stays orderly. Trail only after the first target prints.
Rejection at the first band
A sharp wick into 100.15 to 100.45 that fails within the first five to ten minutes after headlines is often the highest quality fade of the week. Short into the rejection with a stop above 100.55. Take partials into 99.80 and again into 99.50. If 99.50 loses on a fifteen minute close, hold a runner for 99.30.
Breakdown through support
If 99.50 to 99.30 gives way without a clear catalyst, do not chase the first break. Wait for a back test that fails. Then target 98.90 to 98.60 with small size. This environment rewards patience because air pockets near round numbers can retrace quickly.
Cross current from the Bank of England
If the press conference lifts GBP and EUR, DXY can slide even if U.S. data is mixed. In that case the plan is simple. Respect your support shelves. Do not fight a broad based dollar selloff at support unless the curve turns back in your favor.
Execution checklist
• Price touches a band on a headline.
• Wait five full minutes.
• Decide between confirmation or rejection.
• If confirmation, demand a fifteen minute close through the band and a clean retest.
• If rejection, let the wick print and use the wick high or low as your invalidation.
• Take partials one band at a time rather than the exact level.
• If you are still in a trade into the U.S. close on Friday, flatten first and protect your weekend.
Risk and position sizing
Keep risk small until the midweek cluster passes. Use a volatility stop based on the current fifteen minute ATR. Tie your size to that stop so that one loss equals a fixed fraction of account risk. Set a max loss for the day and for the week. If either is hit you are done. That is a rule, not a suggestion.
What can go wrong
• A surprise release at an unexpected time can push the index through a band before you have a signal. If you missed it, you missed it. Do nothing.
• A sloppy Treasury headline can move rates while equities rally. That mixture can confuse the dollar for an hour. Size down and let the tape choose a side.
• The Bank of England tone can reverse a move you liked. During the press conference keep positions smaller and stops wider or stand aside.
Three simple rules for the week
• Trade reaction, never the headline itself.
• Confirm with a fifteen minute close before betting on a break.
• Take partials into the next band every single time.
Disclaimer
Education and analytics only. This is not investment advice.
DXY Breakout Map — Is the Dollar Index Ready for a Power Move?🎯 DXY BULLISH BREAKOUT: The "Limit Order Layup" Strategy 🚀
Hey Thief OGs! 👋 The King Dollar 👑 is getting ready for a potential rally, and we've got the map 🗺️ to navigate it. This is a swing/day trade plan focusing on a classic technical setup with a tactical entry twist.
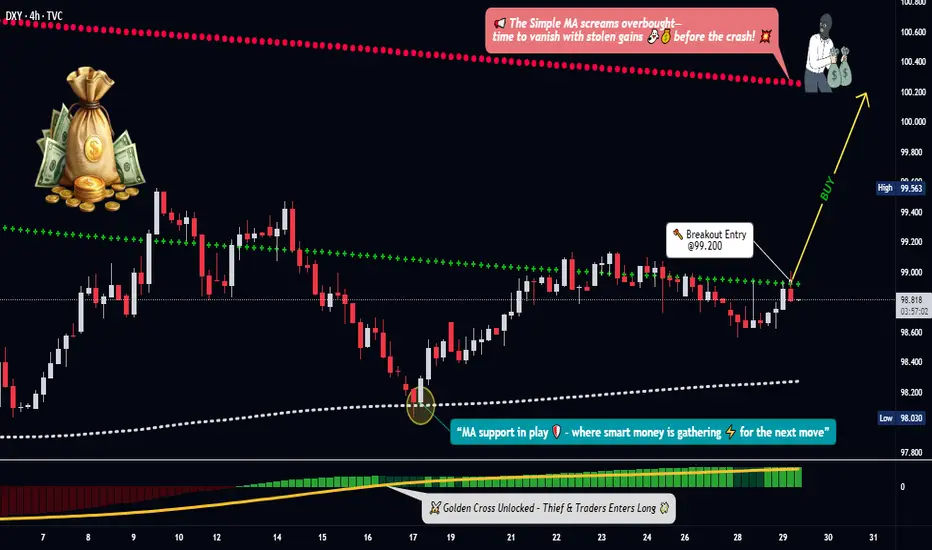
📈 The Overall Plan (Bias): BULLISH 🐂
The strategy waits for a bullish confirmation using a Simple Moving Average (SMA) pullback 🔙 followed by a MACD golden cross ✨. We're buying the dip, expecting a continuation upward 📊.
⚡ The Thief's Entry Tactic (The "Layering Method") 🎁
The key is patience and precision. We don't chase the price.
✅ Wait for the Trigger: Confirm a daily close ABOVE 99.200.
🎯 Deploy Limit Orders: After the breakout, set multiple buy limit orders at key support levels to get a good average entry price.
Suggested Layers: 🟢 98.400, 🟢 98.600, 🟢 98.800, 🟢 99.000
💡 Pro Tip: You can adjust the number of layers and levels based on your own risk appetite!
🛡️ Risk Management (The Escape Plan) 🚨
Stop Loss (SL): A hard stop is placed at 98.200. This level is the line in the sand – if price breaks below here, our thesis is likely invalid ❌.
⚠️ Note: Dear Ladies & Gentleman (Thief OGs), I do not recommend you set only my SL. It is your own choice. You can make money, then take money at your own risk.
🎯 Profit Targets (The Getaway) 💰
Take Profit (TP): We are targeting 100.200. This zone aligns with where the Moving Average may act as strong resistance, and the market could become overbought. When the trap is set, we escape with profits! 🏃♂️💨
⚠️ Note: Dear Ladies & Gentleman (Thief OGs), I am not recommending you set only my TP. It is your own choice. You can make money, then take money at your own risk.
🔍 Related Pairs to Watch & Key Correlations 🌐
The DXY doesn't move in a vacuum. Keep an eye on these:
EUR/USD ( FX:EURUSD ): 👑 The inverse king. A rising DXY typically means a falling EUR/USD 📉.
GBP/USD ( FX:GBPUSD ): Similar to the Euro, a strong dollar often pressures Cable downward 📉.
Gold ( OANDA:XAUUSD ): 🪙 Gold is priced in USD. A stronger dollar can make gold more expensive for other currencies, often putting downward pressure on it 📉.
USD/JPY ( FX:USDJPY ): A strong dollar trend usually powers USD/JPY higher 📈.
Key Point: If our DXY bullish idea is correct, you should generally see EUR/USD and GBP/USD weakening 📉, and USD/JPY strengthening 📈.
✨ “If you find value in my analysis, a 👍 and 🚀 boost is much appreciated — it helps me share more setups with the community!”
#DXY #TradingSetup #SwingTrading #Forex #DollarIndex #TradingStrategy #MACD #TechnicalAnalysis #LimitOrder
DXY Breakout Confirmed — How Far Can Bulls Run?💰 Thief’s Heist: DXY Bull Raid in Progress ⚡ Layered Entry Strategy!
📈 Setup Summary
Asset: DXY Dollar Index (Cash)
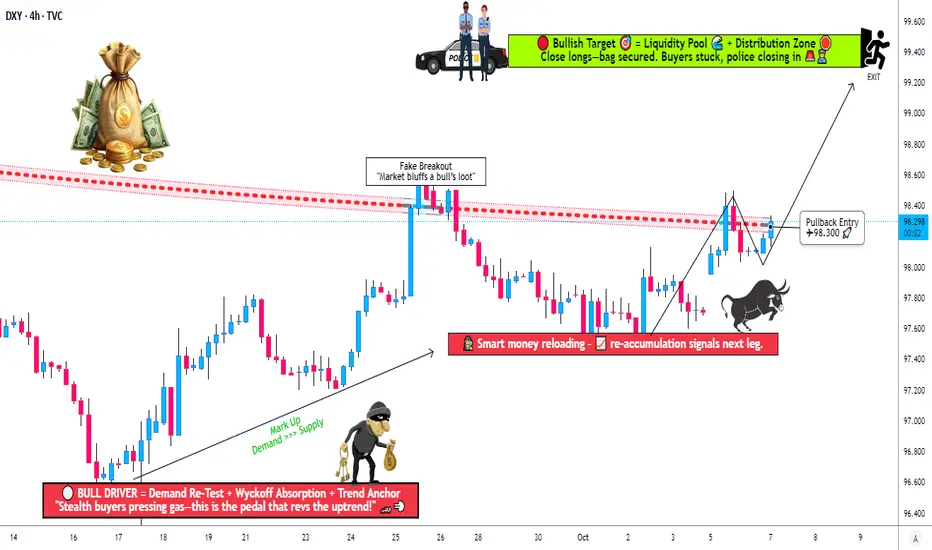
📊 Bias / Plan: BULLISH — 0.786 Triangular Moving Average was breached by buyers → trend confirmation in progress 🚀
🎯 Thief’s Game Plan (Swing / Day Trade)
🕵️ Entry Plan — “Layered Thief Style”:
💎 Any price level entry is valid — flexibility is the Thief’s advantage!
🔹 Sample Limit Layers:
• 97.800
• 98.000
• 98.200
(💡 You can increase or reduce layers based on your own style — stack smartly!)
🧨 Stop Loss (Thief SL):
⚠️ 97.400 → This is the “Thief SL Zone”
👉 But you’re the mastermind — set your own SL if you prefer!
💰 Target Zone (TP):
🚧 Police Barricade at ~99.400 — strong resistance area + oversold trap likely
💨 Thieves escape with bags before the trap closes!
⚙️ Take profit partially or fully at your own comfort — be swift, be smart 🦅
🧩 Market Insight & Technical Reasoning
✅ 786 Triangular MA breach confirms bullish structure
✅ DXY strength often follows Treasury Yield push 📈
✅ Strong USD = Weak Gold & EUR/USD usually
✅ Oversold readings hint buyers ready to counter attack
🔗 Correlation Watchlist (Related Pairs)
Keep an eye on these for confirmation 🔍
💶 FX:EURUSD → usually inverse to DXY
💷 FX:GBPUSD → tracks EUR/USD correlation
💴 FX:USDJPY → directly correlates with DXY
🥇 Gold ( OANDA:XAUUSD ) → moves opposite to DXY
💵 TVC:US10Y Yields → rising yields = bullish DXY
💡 Key Tip:
When EUR/USD & GBP/USD drop sharply + yields rise → DXY often continues its rally 🧭
⚠️ Notes & Thief Disclaimers
👑 Dear Ladies & Gentlemen (Thief OGs):
I’m not recommending my SL or TP — make your own risk rules 💼
You can make money, take money, or just watch the play unfold 🎭
This is a “Thief Style” strategy, shared for fun & educational inspiration only 🧠
Always manage risk & protect capital first — thieves survive by escaping, not over-staying 💨
✨ “If you find value in my analysis, a 👍 and 🚀 boost is much appreciated — it helps me share more setups with the community!”
Disclaimer: this is thief style trading strategy just for fun
#DXY #USDIndex #Dollar #Forex #LayeredEntry #SwingTrade #DayTrade #ThiefStrategy #TrendBreak #SmartMoney #TechnicalAnalysis #USD #TradingView #FXStrategy
DXYDXY is ready for correction or impulse down this week even if it wants to break 100 it will give us correction down first.
Disclosure: We are part of Trade Nation's Influencer program and receive a monthly fee for using their TradingView charts in our analysis.

DXY FRGNT Weekly Forecast -Q4 | W45 | Y25 |📅 Q4 | W45 | Y25 |
📊 DXY FRGNT Weekly Forecast
🔍 Analysis Approach:
I’m applying Smart Money Concepts, focusing on:
Identifying Points of Interest on the Higher Time Frames (HTFs) 🕰️
Using those POIs to define a clear trading range 📐
Refining those zones on Lower Time Frames (LTFs) 🔎
Waiting for a Break of Structure (BoS) for confirmation ✅
This method allows me to stay precise, disciplined, and aligned with the market narrative, rather than chasing price.
💡 My Motto:
"Capital management, discipline, and consistency in your trading edge."
A positive risk-to-reward ratio, paired with a high win rate, is the backbone of any solid trading plan 📈🔐
⚠️ Losses?
They’re part of the mathematical game of trading 🎲
They don’t define you — they’re necessary, they happen, and we move forward 📊➡️
🙏 I appreciate you taking the time to review my Daily Forecast.
Stay sharp, stay consistent, and protect your capital
— FRNGT 🚀
TVC:DXY

DXY Continuing the bullish trend?DXY Weekly Outlook
The dollar has been bullish over the past few weeks, continuing to break structure to the upside. I expect this momentum to carry on a bit further, but as price approaches a strong supply zone, we could see some short-term downside.
This potential pullback would likely cause a temporary push-up for EU and GU before the dollar resumes its bullish move overall.
I don’t trade the dollar directly, but I use it as confluence for my main pairs — and right now, it aligns perfectly with my EU and GU outlooks.
Key Levels:
Possible bullish reaction around 99.600
Potential bearish reaction around 100.000 (psychological level)

DXY FRGNT Daily Forecast -Q4 | W44 | D31| Y25 |📅 Q4 | W44 | D31| Y25 |
📊 DXY FRGNT Daily Forecast
🔍 Analysis Approach:
I’m applying Smart Money Concepts, focusing on:
Identifying Points of Interest on the Higher Time Frames (HTFs) 🕰️
Using those POIs to define a clear trading range 📐
Refining those zones on Lower Time Frames (LTFs) 🔎
Waiting for a Break of Structure (BoS) for confirmation ✅
This method allows me to stay precise, disciplined, and aligned with the market narrative, rather than chasing price.
💡 My Motto:
"Capital management, discipline, and consistency in your trading edge."
A positive risk-to-reward ratio, paired with a high win rate, is the backbone of any solid trading plan 📈🔐
⚠️ Losses?
They’re part of the mathematical game of trading 🎲
They don’t define you — they’re necessary, they happen, and we move forward 📊➡️
🙏 I appreciate you taking the time to review my Daily Forecast.
Stay sharp, stay consistent, and protect your capital
— FRNGT 🚀
TVC:DXY

DXY FRGNT Daily Forecast - Q4 | W44 | D30| Y25 |📅 Q4 | W44 | D30| Y25 |
📊 DXY FRGNT Daily Forecast
🔍 Analysis Approach:
I’m applying Smart Money Concepts, focusing on:
Identifying Points of Interest on the Higher Time Frames (HTFs) 🕰️
Using those POIs to define a clear trading range 📐
Refining those zones on Lower Time Frames (LTFs) 🔎
Waiting for a Break of Structure (BoS) for confirmation ✅
This method allows me to stay precise, disciplined, and aligned with the market narrative, rather than chasing price.
💡 My Motto:
"Capital management, discipline, and consistency in your trading edge."
A positive risk-to-reward ratio, paired with a high win rate, is the backbone of any solid trading plan 📈🔐
⚠️ Losses?
They’re part of the mathematical game of trading 🎲
They don’t define you — they’re necessary, they happen, and we move forward 📊➡️
🙏 I appreciate you taking the time to review my Daily Forecast.
Stay sharp, stay consistent, and protect your capital
— FRNGT 🚀
TVC:DXY

DXY FRGNT Daily Forecast -Q4 | W44 | D29| Y25 |📅 Q4 | W44 | D29| Y25 |
📊 DXY FRGNT Daily Forecast
🔍 Analysis Approach:
I’m applying Smart Money Concepts, focusing on:
Identifying Points of Interest on the Higher Time Frames (HTFs) 🕰️
Using those POIs to define a clear trading range 📐
Refining those zones on Lower Time Frames (LTFs) 🔎
Waiting for a Break of Structure (BoS) for confirmation ✅
This method allows me to stay precise, disciplined, and aligned with the market narrative, rather than chasing price.
💡 My Motto:
"Capital management, discipline, and consistency in your trading edge."
A positive risk-to-reward ratio, paired with a high win rate, is the backbone of any solid trading plan 📈🔐
⚠️ Losses?
They’re part of the mathematical game of trading 🎲
They don’t define you — they’re necessary, they happen, and we move forward 📊➡️
🙏 I appreciate you taking the time to review my Daily Forecast.
Stay sharp, stay consistent, and protect your capital
— FRNGT 🚀
TVC:DXY

DXY FRGNT Daily Forecast -Q4 | W44 | D28| Y25 |📅 Q4 | W44 | D28| Y25 |
📊 DXY FRGNT Daily Forecast
🔍 Analysis Approach:
I’m applying Smart Money Concepts, focusing on:
Identifying Points of Interest on the Higher Time Frames (HTFs) 🕰️
Using those POIs to define a clear trading range 📐
Refining those zones on Lower Time Frames (LTFs) 🔎
Waiting for a Break of Structure (BoS) for confirmation ✅
This method allows me to stay precise, disciplined, and aligned with the market narrative, rather than chasing price.
💡 My Motto:
"Capital management, discipline, and consistency in your trading edge."
A positive risk-to-reward ratio, paired with a high win rate, is the backbone of any solid trading plan 📈🔐
⚠️ Losses?
They’re part of the mathematical game of trading 🎲
They don’t define you — they’re necessary, they happen, and we move forward 📊➡️
🙏 I appreciate you taking the time to review my Daily Forecast.
Stay sharp, stay consistent, and protect your capital
— FRNGT 🚀
TVC:DXY

DXY FRGNT Daily Forecast -Q4 | W44 | D27| Y25 |📅 Q4 | W44 | D27| Y25 |
📊 DXY FRGNT Daily Forecast
🔍 Analysis Approach:
I’m applying Smart Money Concepts, focusing on:
Identifying Points of Interest on the Higher Time Frames (HTFs) 🕰️
Using those POIs to define a clear trading range 📐
Refining those zones on Lower Time Frames (LTFs) 🔎
Waiting for a Break of Structure (BoS) for confirmation ✅
This method allows me to stay precise, disciplined, and aligned with the market narrative, rather than chasing price.
💡 My Motto:
"Capital management, discipline, and consistency in your trading edge."
A positive risk-to-reward ratio, paired with a high win rate, is the backbone of any solid trading plan 📈🔐
⚠️ Losses?
They’re part of the mathematical game of trading 🎲
They don’t define you — they’re necessary, they happen, and we move forward 📊➡️
🙏 I appreciate you taking the time to review my Daily Forecast.
Stay sharp, stay consistent, and protect your capital
— FRNGT 🚀
TVC:DXY

DXY WEEKLY FRGNT FORECAST - Q4 | W44 Y25 |📅 Q4 | W44 Y25 |
📊 DXY WEEKLY FRGNT FORECAST
🔍 Analysis Approach:
I’m applying Smart Money Concepts, focusing on:
Identifying Points of Interest on the Higher Time Frames (HTFs) 🕰️
Using those POIs to define a clear trading range 📐
Refining those zones on Lower Time Frames (LTFs) 🔎
Waiting for a Break of Structure (BoS) for confirmation ✅
This method allows me to stay precise, disciplined, and aligned with the market narrative, rather than chasing price.
💡 My Motto:
"Capital management, discipline, and consistency in your trading edge."
A positive risk-to-reward ratio, paired with a high win rate, is the backbone of any solid trading plan 📈🔐
⚠️ Losses?
They’re part of the mathematical game of trading 🎲
They don’t define you — they’re necessary, they happen, and we move forward 📊➡️
🙏 I appreciate you taking the time to review my Daily Forecast.
Stay sharp, stay consistent, and protect your capital
— FRNGT 🚀
TVC:DXY

DXYDXY can have one more up and without breaking the top it can breakdown one more time.
Disclosure: We are part of Trade Nation's Influencer program and receive a monthly fee for using their TradingView charts in our analysis.

DXY FRGNT Daily Forecast -Q4 | W43 | D2| Y25 |
📅 Q4 | W43 | D2| Y25 |
📊 DXY FRGNT Daily Forecast
🔍 Analysis Approach:
I’m applying Smart Money Concepts, focusing on:
Identifying Points of Interest on the Higher Time Frames (HTFs) 🕰️
Using those POIs to define a clear trading range 📐
Refining those zones on Lower Time Frames (LTFs) 🔎
Waiting for a Break of Structure (BoS) for confirmation ✅
This method allows me to stay precise, disciplined, and aligned with the market narrative, rather than chasing price.
💡 My Motto:
"Capital management, discipline, and consistency in your trading edge."
A positive risk-to-reward ratio, paired with a high win rate, is the backbone of any solid trading plan 📈🔐
⚠️ Losses?
They’re part of the mathematical game of trading 🎲
They don’t define you — they’re necessary, they happen, and we move forward 📊➡️
🙏 I appreciate you taking the time to review my Daily Forecast.
Stay sharp, stay consistent, and protect your capital
— FRNGT 🚀
TVC:DXY

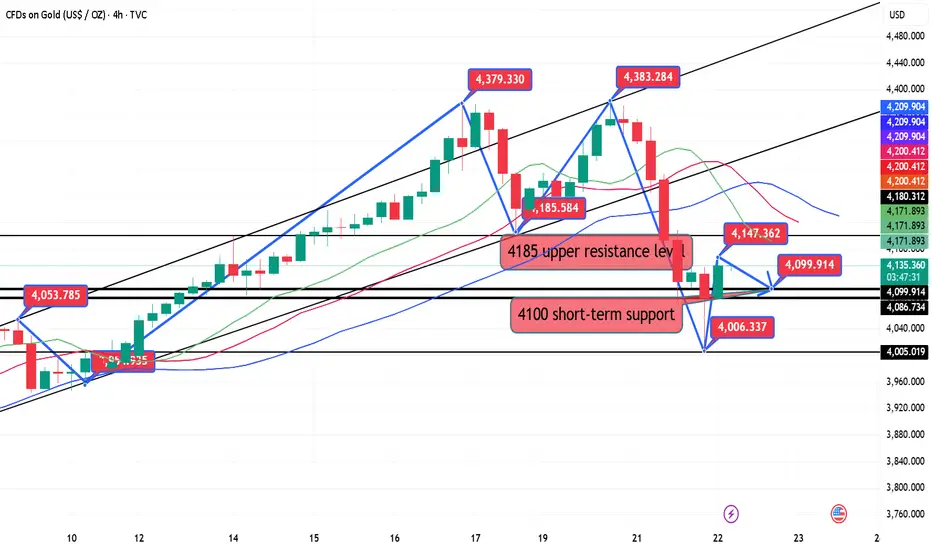
10.22 Gold continues to correctAfter forming a double top early Tuesday morning, gold has been experiencing resistance during Tuesday's Asian session, signaling a potential Waterloo. As of Wednesday's Asian session, gold hit a low of 4004 before rebounding above 4100, a bullish consolidation. Gold is currently trading in a range-bound environment. We continue to monitor the 4147-50 resistance level, which also marked the resistance level at midnight Tuesday. Gold prices retreated after hitting this resistance level several times last night. During the day, we will monitor the upward resistance level. If gold fails to break through, we will maintain a volatile trading strategy. We will prioritize shorting within this resistance level.
From the 4-hour chart, we are currently focusing on the 4147-4150 resistance level for the upside, while the -4085-4100 support level is expected to remain. If bulls fail to break through, gold will likely continue its range-bound correction. Trading strategies should prioritize trading within this range. In the intermediate range, we should be cautious about buying orders and wait patiently for key entry points. I'll provide detailed trading strategies during the trading session, so please stay tuned.
Gold Trading Strategy:
1. Short gold with a light position at 4147-4150, stop loss at 4156, target at 4085-4100. Hold if it breaks through!
2. Go long gold at 4085-4095, stop loss at 4078, target at 4145-50. Hold if it breaks through!
EURUSD buy positionOn 15m timeframe, there are several confirmations present at the moment. Session low met from today's LDN session, P line and DXY double confirmation mirroring the Euro at the moment. Although not taking the trade in its active time, I'd say it's worth the 10 pips, just like the UJ earlier today:)

DXY Rejection from Premium Zone | USD Weakness AheadHello Billionaires!!
The US Dollar Index (DXY) is showing signs of exhaustion after tapping into the FVG + Order Block within the premium zone.
We’ve also confirmed a Market Structure Shift (MSS) to the downside — signaling a potential short-term reversal.
📊 Analysis Breakdown:
FVG & OB confluence near 98.90 🧠
MSS indicates bearish intent ⚡
Targeting buying zone around 98.30 area 🩸
This scenario supports USD weakness, aligning with potential bullish moves in EURUSD, GBPUSD, and AUDUSD.
💡 Trade Plan:
DXY → Short bias below OB
USDJPY → Short setup favored
EURUSD, GBPUSD, AUDUSD → Look for long setups
Smart Money likely engineered liquidity above before pushing price lower to rebalance inefficiency.

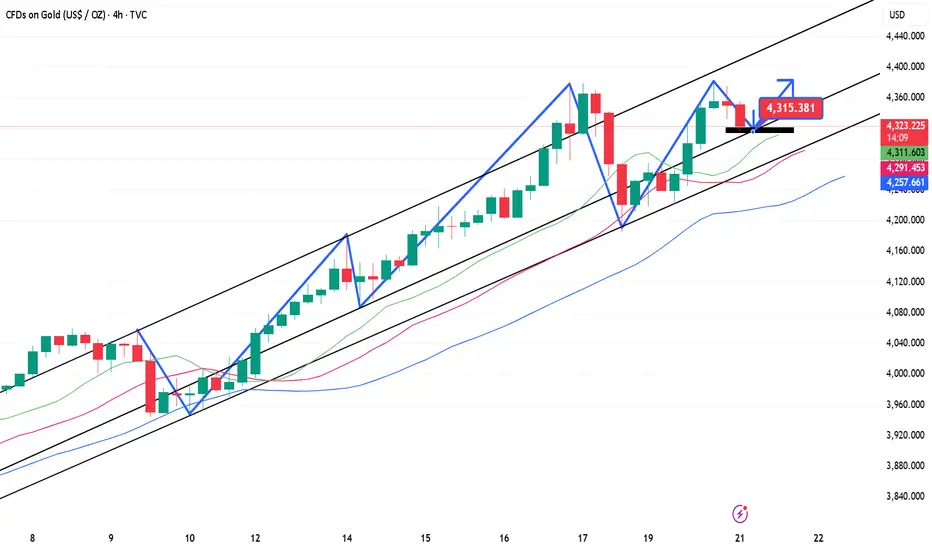
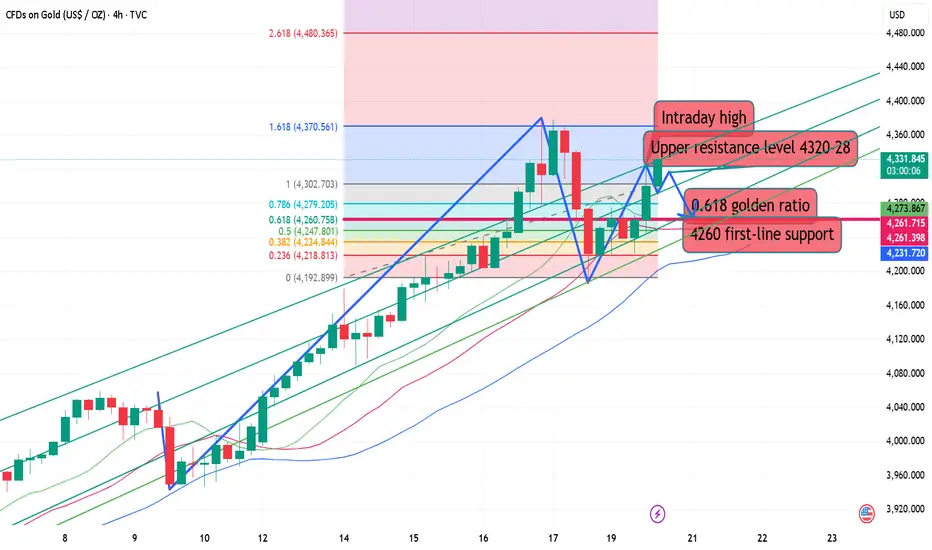
10.21 Gold correction continues to riseTechnical Analysis
The 4-hour MACD formed a death cross with shrinking volume, converging and flattening, indicating current volatility. The 4-hour candlestick chart also closed at a high level with a small Yin-Yang candlestick. The question now remains whether the candlestick chart will rise directly or retrace to the middle line near 4292. A direct rise would not fall below the morning's low of 4332.
The hourly chart began to fluctuate and decline after trading sideways this morning. Currently, attention is focused on support near 4332. The hourly MACD formed a golden cross with shrinking volume, and the STO indicator corrected downward, indicating a potential decline in the hourly chart. Current support on the hourly chart lies around 4332-4327 and 4302.
In summary:
The daily chart suggests today's decline is not over, and will likely reach at least 4300. The question now remains whether the 4-hour chart will fluctuate at a high level or rise directly. A direct rise would likely lead to a continued rise to around 4420, while consolidation at a high level would likely lead to a decline. Therefore, a short position around 4372-4377 is feasible. As for long orders, they need to be placed near 4267-4275, and the first long order can be placed near 4296-97.
Strategy:
Short near 4368-70, defend 4382, target 4335-4300-4270
Long near 4296-97 below, defend 4290, target 4330
Long near 4268-72 intraday, defend 4262, target 4300-4330-4370, etc.
Breaking above 4382 will directly lead to the 4410-4420-4480 line, so if it breaks above 4382 and then falls back to 4370, go long.
Like
10.20 Gold breaks out of volatility and accelerates its riseThe 4260 level can be considered a short-term watershed, primarily because last week's upward movement peaked at 4380. The initial decline occurred at this level, and after rebounding below 4380, the price fell again, breaking below this level and reaching below 4200. However, this trend has not been sustained, and the price has risen again after breaking through this level in the US market. Therefore, in terms of future trading strategy, I personally believe that gold prices will continue to rise, and I recommend waiting for a pullback before continuing to invest in bullish long positions.
In short, 4260 is considered a watershed between bulls and bears, and also a protective level for our future strategies. The recommended entry point is around 4300, with an eye on resistance at the previous high of 4330!
10.20 Gold short-term resistance looks at 4280Gold prices twice confirmed their all-time high of 4380 before falling, the first time by $100 and the second time by nearly $200.
Last Friday, gold prices were insane, plummeting from 4380 to 4279, leaving $100 of room for further gains, before rising another $100 to find 4380.
After confirming resistance at 4380 for the second time, the price continued to rise, signaling a downward trend. Pressure was placed on the short side at 4380, 4355, 4350, 4321, and 4364. The price continued to move around the established downward trend, gradually shifting between levels, and finally accelerating to 4186 before ending the decline.
The price rebounded in late trading, returning to the 4250 mark to end the week!
Judging from Monday's market action, the market has entered a broad range-bound sweep. Specifically, the bullish rally may have temporarily paused, gathering momentum for a subsequent rebound.
We must clearly understand the positioning of our defensive lines. When these lines are breached, adjustments and changes must be made:
1. Coordination between the two lines on the hourly and 30-minute charts
It has fallen back into the 30-minute chart's two-line range, between 4280 and 4110.
It remains above the upper limit of the two lines on the hourly chart, at 4221. Although it broke briefly last Friday, the closing price quickly recovered. Support is also being sought at 4221 in the European session this afternoon.
The upper limit of the two lines, 4280-4220, is where the support is being sought.
If the price breaks through this range, the nature of the market will begin to change.
2. Top and bottom reversal positions and Within the small channel, pressure is building up in the 4280-4385 area. The lower band is extending and expanding, focusing on the 4180-4200 range.
In the Asian session, prices fluctuated around the 4219-4271 range. In the afternoon, we confirmed that the 4268 area was beginning to bearishly bearish. Based on this strategy, we chose to enter a bearish position from above, targeting the 4220 area. Once the price started to move, we would aggressively chase the price, pursuing the bearish trend until it accelerated to the 4221 area.
Short-term strategies for the European and US sessions
1. Short-term trading in the 4278-4282 area, with the upper pressure at 4286, a stop-loss at 4298, and a target of 4250. The next target is 4225-4215.
2. After completing the $100 sweep, focus on the 4320 area for short selling. The specific target is a bit further out, so stay tuned for real-time alerts.
3. Currently, the price has returned to around 4260, so we will wait for the plan in the first point.
