10.8 Gold Daily Short-Term Operation Guide!!!In the 1-hour chart, the Asian session continues to rise with $3985 as support. A quick pullback would be an opportunity to buy in. Unless the Asian session decline continues in the European session and then in the US session, or if the Asian session breaks the bottom in the European session and fails to continue in the US session, don't try to bet on a pullback; instead, follow the trend.
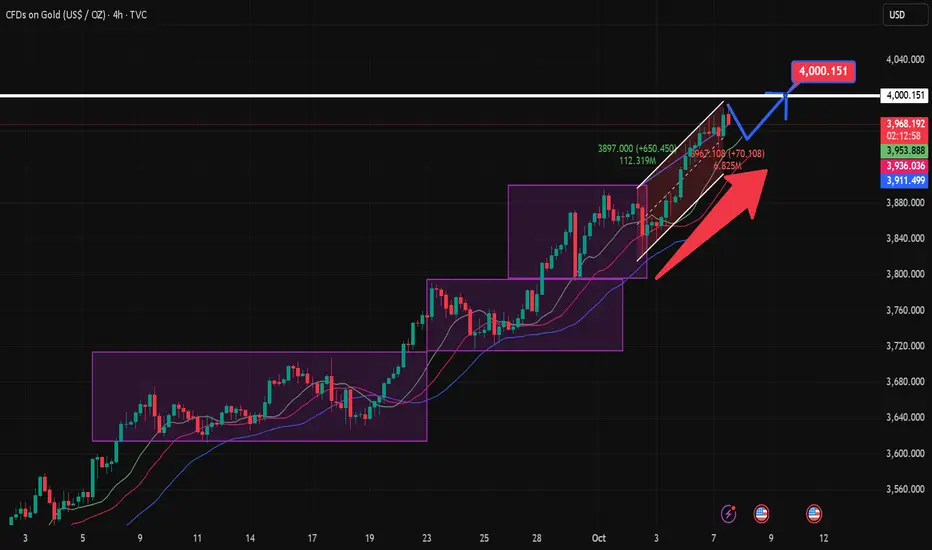
Secondly, give up on speculating on the top. Currently, the strong upward trend remains unchanged on both the daily and 4-hour charts. Even after breaking through $4000 in the short term, there's still no sign of an end. While bullish, be wary of pullbacks. In other words, be prepared for a pullback and avoid chasing orders.
If the pullback approaches the $4000-3980 range, buy long. If the European session's strength doesn't offer opportunities, and there are further pullbacks before the US market opens, keep an eye on $4030-4050.
Dxyanalysis
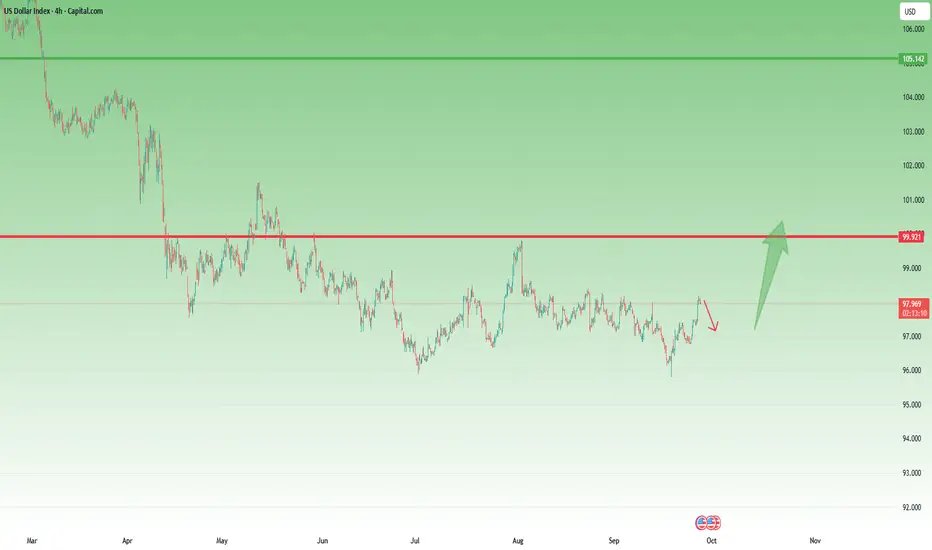
DXY – The Road to 100 Looks ClearIn my previous analysis on DXY, I mentioned that as long as the 97.60 zone holds, there are strong chances for an upside move and a possible test of the 100 level.
Indeed, the index reversed perfectly from that support area and has now broken above the interim resistance around 98.60, trading close to 99 at the time of writing.
Over the last three sessions, DXY has also completed an inverted Head & Shoulders pattern, with the neckline breakout confirming the bullish structure.
From here, the path toward the 100 zone appears clear and technically justified.
I maintain a bullish bias for the U.S. Dollar Index, which naturally implies a bearish outlook for EURUSD and GBPUSD in the short term.

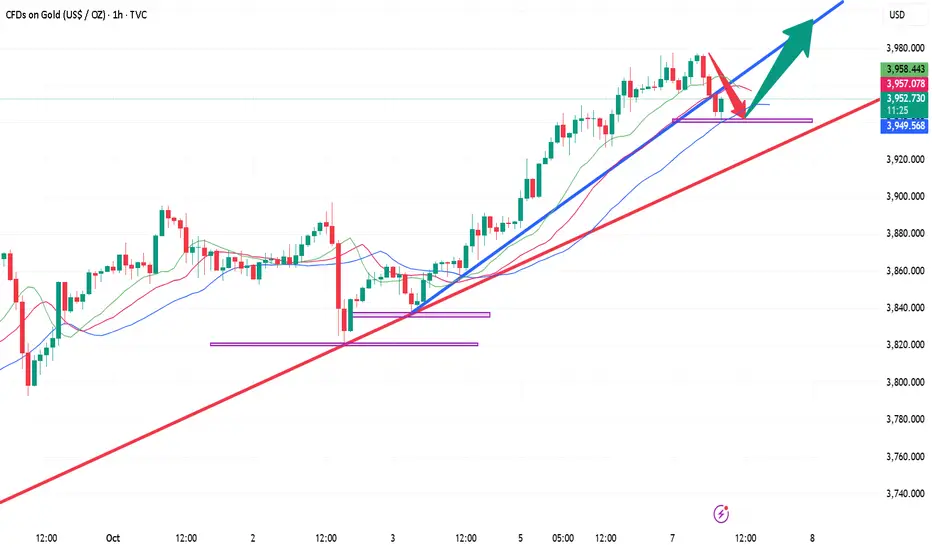
Gold is rising as expected, with the US market eyeing 4000!!!After gold retreated to around 3940, it began to rally. The strategy for the future remains to buy on dips. Short-term long positions near 3942 can be reduced, with a target of 3980 still in sight. Be mindful of the risks. Short-term investors can consider buying around 3954, with a stop-loss at 3946, and targeting a range between 3980 and 4000. Be mindful of the risks.
October 7th US Gold Trading: For those holding positions near 3942, reduce positions and hold with a profit and loss at 3946. Target resistance near 3980, and a breakout to 4000.
Short-term investors can consider buying further near 3954, with a stop-loss at 3946 and a profit target of 3980-4000. Be mindful of the risks.
10.7 Gold Intraday Short-Term Operation Guide!!!Gold typically enters a correction phase on Tuesday after a strong rally on Monday. Maintain a bullish outlook for the day, with the primary support area being the 3955-60 range (which encompasses the early morning low, opening price, and high trading volume). Bulls are expected to mount a counterattack here. Today's market will not simply replicate Monday's unilateral surge, but will likely exhibit a pattern of "high-level fluctuations, false breakouts, and subsequent declines, followed by a test of the bottom and subsequent upward movement." Trading strategies should be abandoned in favor of buying at the bottom of the market fluctuations.
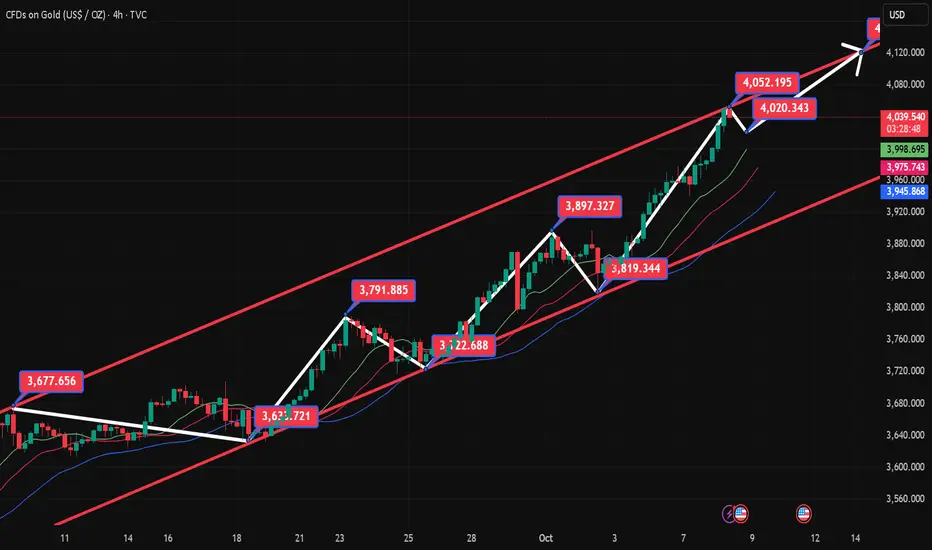
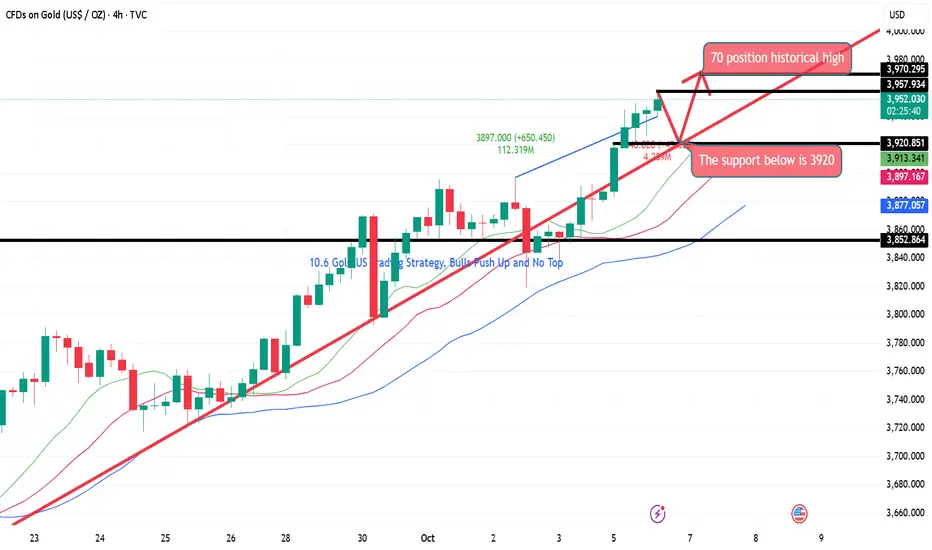
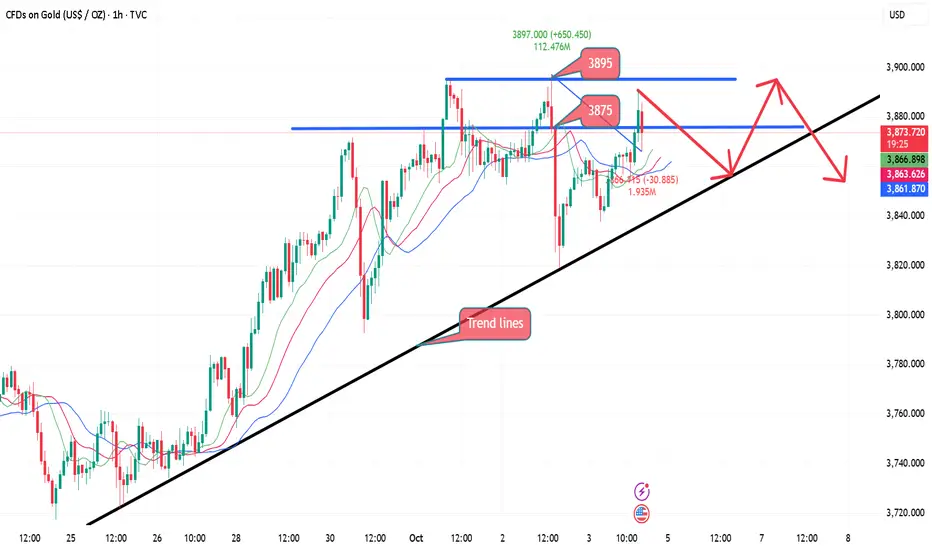
10.6 Gold US Trading Strategy, Bulls Push Up and No TopLooking at the 4-hour market trend, we are watching for short-term support at 3920, with a focus on the 3895-3900 support level. The bulls are rising strongly and there is no end in sight. Trading strategies should focus on buying on pullbacks. For intermediate positions, we should be cautious in chasing orders and patiently wait for key entry points. I will provide detailed trading strategies during the trading session, so please pay attention.
10.6 Gold's callback is small and it may continue to riseAfter breaking through a previous resistance zone on the 4-hour chart, gold is continuing its upward trend along its short-term moving average. Intraday pullbacks have been mild and sustained, and there are still no signs of a peak in the short term. On the hourly chart, after a surge, gold is maintaining a high-level correction, but recent high-level corrections have ultimately evolved into secondary gains, and today's pullbacks were not significant. On the short-term chart, the candlestick chart is gradually coming under pressure, maintaining a weak trend along the short-term moving average. Some short-term correction is possible. If the correction in the US market is not significant, it may even rebound to the current price after a minor correction. Further upward movement is expected after the open!!!
10.6 Gold falls back and continues to go longGold prices are currently moving out of a narrow range of highs on the daily chart. The K-line chart continues to maintain a relatively stable upward trend along the short-term moving average. Watch for any pullbacks on the daily chart to confirm a secondary upward trend. Focus on the support zone around 3900 in the short term. On the 4-hour chart, the price broke through the previous resistance zone, and the short-term moving average began to diverge upward, indicating a relatively strong short-term trend. On the hourly chart, the intraday pullbacks were neither strong nor prolonged, and the K-line chart continues to maintain a relatively strong trend along the short-term moving average. Some divergence is showing on the short-term chart, so watch for short-term adjustments.
Trading Strategy:
BUY: 3910 TP1:3925 TP2:3940
SELL: 3940 TP1:3910 TP2:3900
DXYDXY is going sideways, we meed more sideways movement this week before going up.
Disclosure: We are part of Trade Nation's Influencer program and receive a monthly fee for using their TradingView charts in our analysis.

DXY nfp again breaking the support?Hello traders, this is a complete multiple timeframe analysis of this pair. We see could find significant trading opportunities as per analysis upon price action confirmation we may take this trade. Smash the like button if you find value in this analysis and drop a comment if you have any questions or let me know which pair to cover in my next analysis.

DXY Strategy Unlocked — Will Bulls Control the Next Swing?⚡ US Dollar Index (DXY) Swing/Day Trade Setup ⚡
💹 Asset: DXY (US Dollar Index)
📈 Plan: Bullish — Pending Order Strategy
📊 US Dollar Index (DXY) Real-Time Data
Daily Change: +0.55 (+0.56%)
Day's Range: 97.62 – 98.60
52-Week Range: 96.38 – 110.18
🔔 Trade Setup (Thief Plan)
Breakout Entry: 98.800 ⚡ (Set TradingView alarm to catch the move in real time)
Stop Loss: “Thief SL” @ 24,000.0 (only after breakout confirmation).
📝 Adjust your SL based on your strategy & risk appetite, Ladies & Gentlemen (Thief OG’s).
Target: Resistance/overbought zone at 100.20
🎩 Escape target: 100.000 (take profits before market flips).
😰 Fear & Greed Sentiment
Index Level: 64 (Greed)
Market Mood: Moderately greedy, driven by:
📉 Net new 52-week highs vs. lows (bullish)
📊 VIX near averages (neutral)
🛡️ Bonds underperforming stocks (risk-on)
📈 Junk bond demand narrowing spreads (greed signal)
🌍 Fundamental & Macro Score
Fed Rate Cut Probability: 90% (Sept 18 FOMC, 25 bps cut expected)
Key Drivers:
✅ Labor Data: NFP (Sept 5) is crucial for direction.
⚠️ Trade Policy: Court ruled Trump tariffs illegal (appeal pending).
⬇️ Consumer Confidence: Michigan Index at 3-month low (58.2).
⬆️ ISM Manufacturing: Ahead of release, possible USD support.
Safe-Haven Demand: Geopolitical tensions supporting USD.
🐂 Overall Market Outlook Score
Bullish (Long): 60%
Bearish (Short): 40%
Bias: Short-term bullish as long as 97.60 holds.
USD rebound + bond yield strength + equity weakness backing USD.
⚠️ Risk: Break below 97.60 → next target 96.55 (bearish).
💡 Key Takeaways
🎯 NFP Report (Sept 5) = decisive catalyst.
⚖️ Fed debates + trade policy = medium-term uncertainty.
📉 Breakout above 98.80 is the key to bullish continuation.
🔍 Related Markets to Watch
FX:EURUSD
FX:GBPUSD
FX:USDJPY
OANDA:XAUUSD
CAPITALCOM:US30
✨ “If you find value in my analysis, a 👍 and 🚀 boost is much appreciated — it helps me share more setups with the community!”
#DXY #USD #DollarIndex #Forex #DayTrading #SwingTrading #BreakoutStrategy #ThiefTrader #TradingSetup

WEEKLY MARKET ANALYSIS-DXY, BTC,ETH, NAS100,SPX,XAU,XAGThis weekend's analysis will cover the Dollar Index, Bitcoin, Ethereum, NAS100, SPX500, Gold and Silver.
The DXY has found a strong support on both the monthly and daily charts. DXY has officially also broken it's weekly closing resistance level and I think a shift in momentum will propel DXY up higher in the next week towards a target zone of 99 to 99.600.
Bitcoin is still in a correction and currently paused on the weekly 21 EMA, I think it's consolidating sideways and will continue selling to the intended target of $102k in the coming week.
ETH nicely came to the previous resistance and seems to find some buyers there but there is no momentum or RSI strength to support an upward move, so I am bearish on ETH and think the price will fall some more into the target zone below $3,823.
NAS100 and SPX500 are also looking quite over stretch on it's Bollinger Bands and KC channels on the weekly charts, with weekly bearish candles suggesting a pullback in the equities is very likely in the next coming week.
Gold and Silver are in a strong uptrend and the uptrend will continue but I see profit taking on the charts. I expect some sideways consolidation and a minor pullback before the bullish continuation.
I thank you for listening to my publications and I wish you a great trading week. Cheers everybody!!

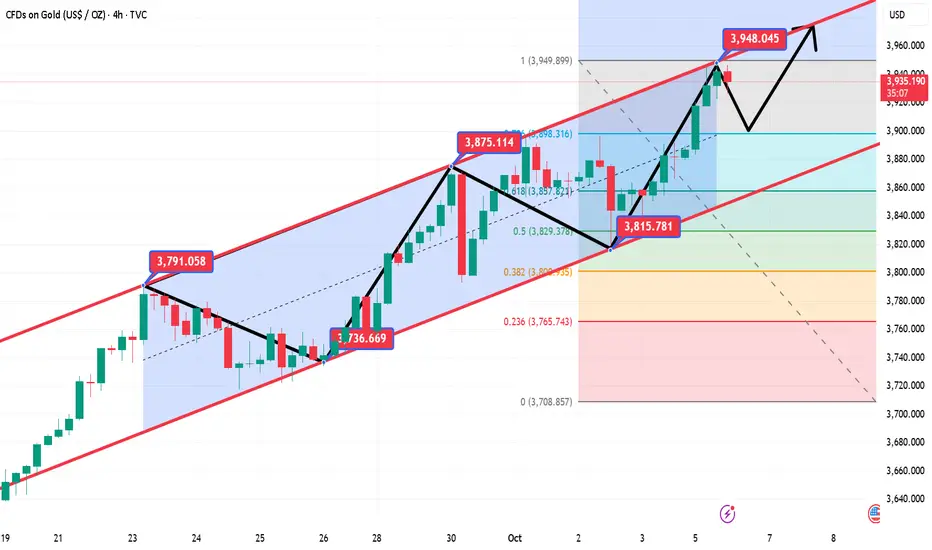
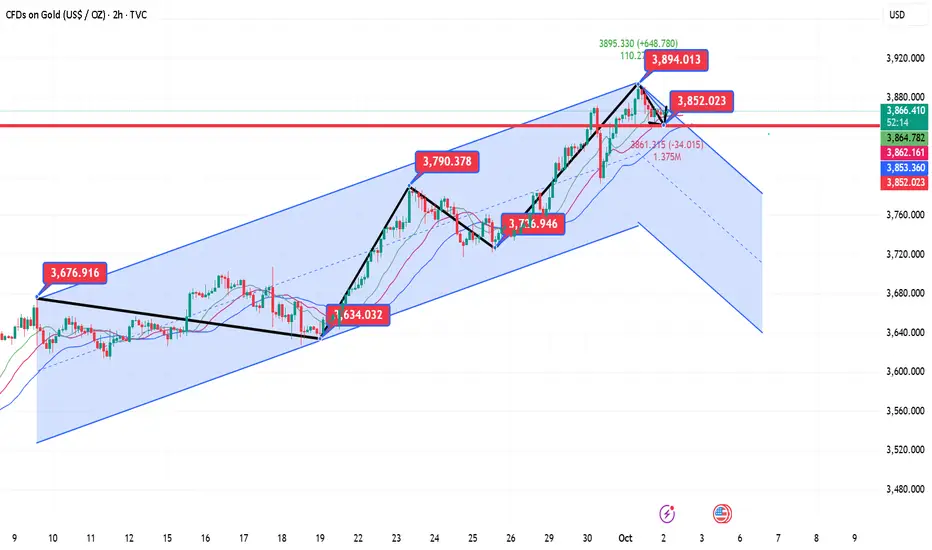
10.3 Gold US Market Technical Analysis!!!Our overall judgment on gold in October is "bumpy", that is, the market has turned from the steady slow bull market in September to a fluctuating rise. There will be a tug-of-war between long and short positions, and there will be a tug-of-war between highs and lows and a rapid rebound. However, this does not mean the end of the bull market, but only a change in the rising rhythm. We should pay attention to this pattern change in the short term. We will still view it as a strong rhythm during the day. After the volatile upward trend in the Asian and European sessions, we will choose to follow up with a bullish trend after a pullback. Pay attention to the suppression around 3874 and 3895 on the upside. At the same time, due to the uncertainty of the non-farm payroll results, whether it is announced or not will have a greater impact on today's operations.
10.2 Gold fluctuates at a high level!!!Market Analysis:
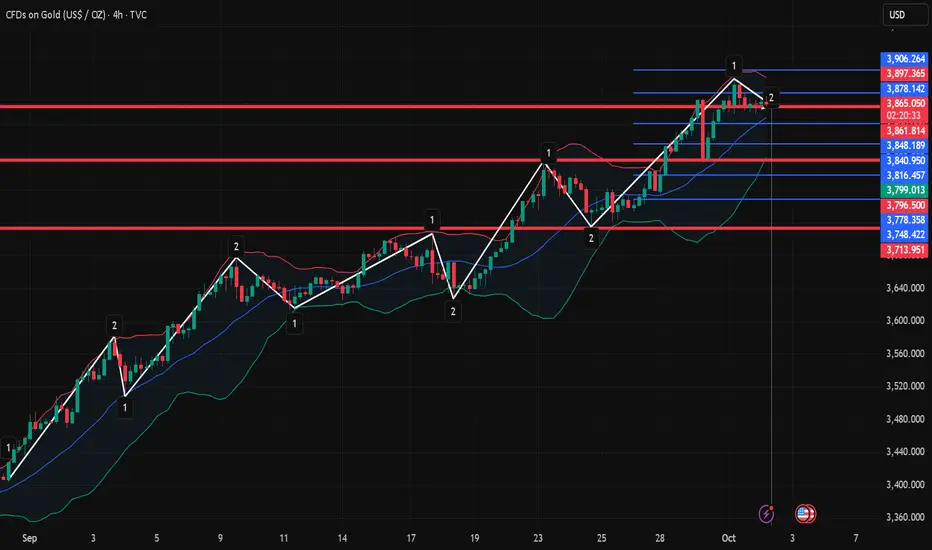
① The daily MACD is forming a golden cross at a high level with high volume and volatility, and the STO indicator is overbought, indicating a high-priced trend. A candlestick chart with a hanging line after consecutive long-term bullish candlesticks indicates high-priced volatility, with the risk of a pullback. This is unless another long-term bullish candlestick pattern breaks yesterday's hanging line.
Therefore, today's upside focus is on yesterday's high of 3895. A break above this level could push the price towards the 4000 mark.
Current daily support lies near the MA5 and MA10 moving averages, corresponding to support levels of 3837 and 3787. However, the MA10 moving average has no chance of success, so the main focus for the day is support at 3837. This means the intraday range remains between 3837 and 3895.
② The 4-hour MACD is forming a high-level death cross, and the STO indicator's fast line is showing an upward curve, indicating a volatile trend in the 4-hour chart. Short-term support in the 4-hour chart lies near the middle line at 3844, but this is expected to gradually move up to around 3850 over time. We observe that the three Bollinger Bands on the 4-hour chart are currently narrowing, indicating range-bound fluctuations. The upper band is currently holding pressure at 3901, but it will likely move down to around 3890-95 over time.
③ On the hourly chart, the three Bollinger Bands are also narrowing, with the lower band and the MA60 moving average currently supporting the 3852-54 level. If the price falls below 3852, a downward trend is likely.
9.2 Gold Short-Term Technical Analysis Guide!!!Gold prices naturally retreated after hitting a new high on Wednesday, but the candlestick chart remains oscillating upward (with higher lows). If prices fall below the midline of the trend channel at 3869, the market is likely to shift towards the 3850-35 range. Currently, gold prices are showing this trend. Conservative investors can consider entering the market based on whether the 3834/35 support levels are broken (a rebound could reach as high as 50; if it falls below, the market is bearish and could reach 3810).
Reference support levels: 3849, 3834, and 3794.
Reference resistance levels: 3880, 3903, and 3917.
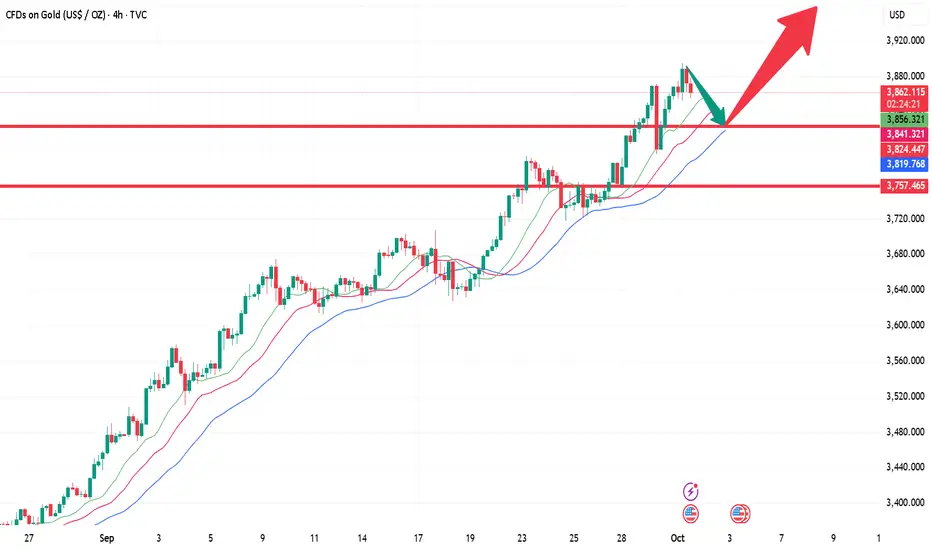
10.1 Gold US Trading StrategyJudging from the 4-hour market trend, the bulls closed with a positive sign and fluctuated at a high level. The short-term support below is 3814-25, and the important support is 3800-08. The bulls are rising strongly and there is no top. The operation is mainly to go long on pullbacks. In the middle position, watch more and do less, be cautious in chasing orders, and wait patiently for key points to enter the market.
9.30 Gold continues to hit new highsThe gold market continued to rise yesterday. It opened at 3759.9 in the morning and then fell back. The daily low was 3756.3 and then the market fluctuated and rose strongly. The daily high touched the daily high of 3834.2 and then consolidated. The daily line finally closed at 3833.9. The daily line closed with a saturated large bullish candle with a slight shadow. After ending this pattern, today's market retraced to more levels. In terms of points, the long positions at 3325 and 3322 below and the long positions at 3368-3370 last week and the long positions at 3377, 3385 and 3563 were reduced and the stop loss was followed up at 3650. Today's long positions at 3805 are conservative at 3802, and the stop loss is 3798. The target is 3838, 3845 and 3852-3855 pressure.
9.30 Gold New High Technical Analysis!!!Technical Analysis:
From a 4-hour perspective, short-term support is seen at 3800-05, with key support remaining around 3785-90. Short-term resistance is seen at 3830-35. Trading strategies should prioritize buying on dips. In the interim, caution is advised with caution when buying, patiently waiting for key entry points.

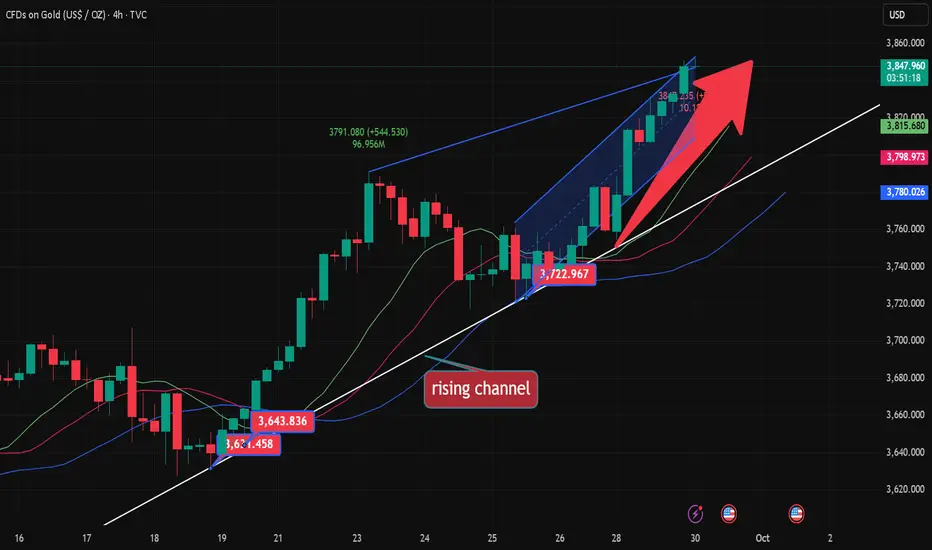
9.29 Gold price hits a new highOn the hourly chart, gold successfully broke through the $3,700 mark last week and continued its strong performance by breaking through $3,800 on Monday. For support, the $3,800 mark is a key level. Gold prices surged higher this morning, and after a breakout, prices continued to rise. For upward pressure, the intraday high, also a historical high, at $3,819 is also near the upper limit of the daily Bollinger Band. If gold prices stabilize at $3,800 and reach new all-time highs, the upward trend is expected, with no predictions of a top. The 5-day moving average and the MACD indicator are forming a golden cross, while the KDJ and RSI indicators are forming a golden cross in overbought territory. Short-term technical indicators suggest that bulls maintain their advantage.

U.S Dollar Index (DXY) Bullish Reversal Setup – Targeting 98.913Previous Trend:
There was a strong upward move, forming a rising channel (highlighted in pink).
Price reached the upper boundary of the channel and then reversed downward.
Current Price Action:
Price broke below the midline of the channel and is approaching a potential support zone.
This zone is marked by a blue rectangle (support/demand area).
Trade Idea: Long Setup (Buy Position)
Entry Point: Around 97.862
Stop Loss: Around 97.665–97.679 (just below support zone)
Target Point: 98.913 (near previous high)
✅ Trade Rationale
Support Zone: The marked area has previously acted as a demand zone, likely to support price again.
Bullish Recovery Expectation: The idea is that price will bounce from this support zone and resume upward movement.
Good Risk-Reward Ratio:
Risk: ~20 pips (from 97.862 to 97.665)
Reward: ~105 pips (from 97.862 to 98.913)
Risk-to-Reward Ratio: ~1:5 — a favorable setup.
⚠️ Cautions
Price is still above entry level (98.020) — the setup assumes a pullback to the 97.86 area before buying.
If price breaks below 97.665, the setup would be invalidated (stop loss hit).
Channel Breakout Risk: Since the channel is already broken to the downside, this trade assumes a temporary dip before a rebound — which may or may not happen.
📌 Summary
Parameter Value
Entry 97.862
Stop Loss 97.665
Target 98.913
Risk-Reward ~1:5
Trade Direction Long (Buy)
Confirmation Needed Pullback to support zone

DXY (U.S. Dollar Index) – Bearish MomentumPrice is giving us signs of Bearish Momentum while respecting the larger descending channel structure, having recently tapped the upper trend line with a strong rejection.
Expecting:
A lower time frame correction to confirm continuation.
Targeting 90% if price breaks impulsively to the downside.
If price taps into our area of interest, we might expect a potential bullish reversal, depending on price action and correction quality.
Let price do the work, wait for the correction before entering short.

DXYDXY is in correction and can give us some more sideways before any push up.
Disclosure: We are part of Trade Nation's Influencer program and receive a monthly fee for using their TradingView charts in our analysis.

DXY – Reversal in Motion, Correction Next?In my previous DXY analysis, I highlighted that all the bad news might already be priced in for the USD, opening the door for a reversal.
That scenario is now unfolding: after making new dips, the index bounced strongly from the 95 zone and is currently trading around 98.
After such a sharp rebound, the market looks ready for a correction. This pullback phase could provide traders with attractive opportunities – especially to position short on the major USD pairs, but at better, higher prices.
Trading Plan:
• The reversal has confirmed, but I expect a correction before continuation.
• I’m looking for retracements to offer entry levels for USD shorts via majors.
• As always, flexibility is key – monitor price action closely to time entries correctly.
The market has started to shift – now it’s about waiting for the correction to align risk and reward properly. 🚀
DXY Breakout Trade Setup – Bullish Channel & High R:R OpportunitChart Overview:
Instrument: U.S. Dollar Currency Index (DXY)
Timeframe: 1 Hour (1H)
Current Price: 98.371
Analysis Date: September 26, 2025
🔍 Technical Structure:
1. Bullish Channel:
A clear ascending channel is drawn, indicating a strong short-term uptrend.
Price action has been respecting the channel well, moving between the upper and lower trendlines.
A bullish breakout is either anticipated or just confirmed above the channel.
🟦 Trade Setup (Long Position):
✅ Entry Point:
Price: 98.267 (blue horizontal line labeled "Entry Point")
This is slightly below the current price (98.371), suggesting an entry on a slight pullback after breakout.
🛑 Stop Loss:
Price: 97.986 (also marked 97.982 on the lower blue line)
Located below a recent support zone and below the breakout structure.
This gives a safety buffer if the breakout fails.
🎯 Target Point (Take Profit):
Price: 99.676
This is based on the measured move from the height of the channel, projected upward from the breakout point.
📐 Risk-to-Reward Ratio (RRR):
Very favorable; visually it appears to be around 4:1 or higher.
Small stop loss area (red box) relative to the large target area (green box).
High RRR makes this setup attractive for risk-managed traders.
🔎 Additional Observations:
Trend: Strong bullish momentum leading into the breakout.
Volume / Confirmation: Not shown on the chart, but ideally you’d want volume confirmation for the breakout.
Timing: Entry and confirmation should align with break and retest of the channel top.
✅ Summary of the Trade Plan:
Component Value
Entry 98.267
Stop Loss 97.986
Take Profit 99.676
Risk-Reward ~4:1
Trade Type Long (Buy)
Strategy Breakout + Retest
⚠️ Important Notes:
Wait for confirmation (like a bullish candle close above the channel or successful retest).
Be aware of macroeconomic news that can affect DXY (e.g., Fed announcements, interest rate decisions, inflation data).
Use position sizing appropriate to your risk tolerance.
