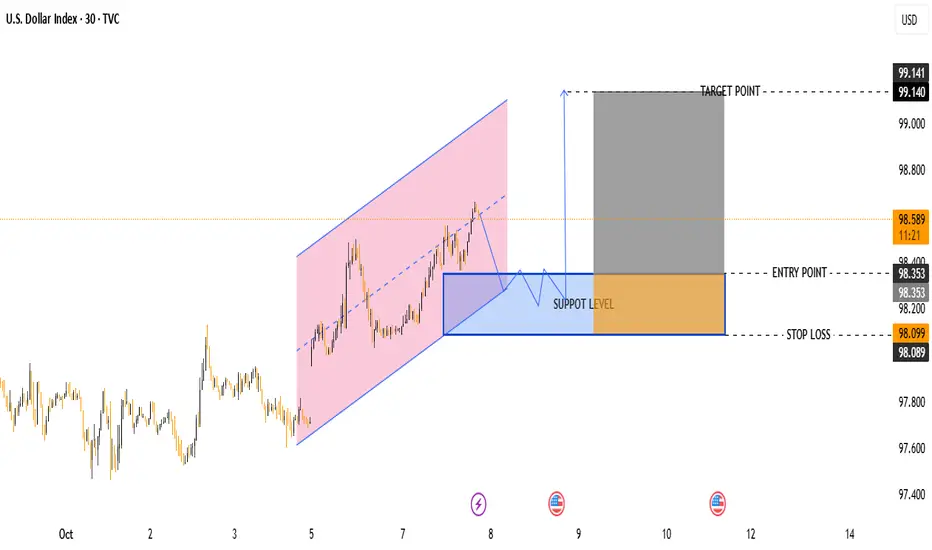
DXY Buy Opportunity – Support Retest Before Next Leg UpPair: U.S. Dollar Index (DXY)
Timeframe: 30 minutes
Current Price: 98.602
Trend: Short-term bullish channel (highlighted in pink)
🧭 Key Levels
Support Zone: 98.100 – 98.350
Entry Point: 98.353 (buy zone confirmation)
Stop Loss: 98.099 (below support)
Target Point: 99.140
📊 Market Structure
The price is moving within an ascending channel, showing a steady uptrend.
It has recently reached the upper boundary of the channel and is now expected to retrace toward the support zone (blue box).
After retesting this support level, a bullish continuation is expected.
🧩 Trade Idea
Plan: Wait for price to retest the blue support area.
If bullish candlestick confirmation appears (e.g., bullish engulfing, hammer), enter a buy trade near 98.350.
Stop Loss: below 98.099 (safe margin under support).
Take Profit: near 99.140, aligning with the top of the projected move.
Risk–Reward Ratio:
Approx. 1:3.5 — good reward compared to risk.
⚠ Possible Scenarios
1. ✅ Bullish Scenario:
Price respects the support level → breaks above 98.80 → continues to 99.14.
→ Confirms continuation of bullish trend.
2. ❌ Bearish Scenario:
Price breaks below 98.10 → invalidates bullish setup → channel structure fails → potential drop toward 97.80 zone.
📈 Conclusion
Current trend: Bullish, but waiting for a retracement and confirmation is key.
Buy zone: 98.35–98.10
Target: 99.14
Stop Loss: 98.09
Dxybuy
U.S Dollar Index (DXY) Bullish Reversal Setup – Targeting 98.913Previous Trend:
There was a strong upward move, forming a rising channel (highlighted in pink).
Price reached the upper boundary of the channel and then reversed downward.
Current Price Action:
Price broke below the midline of the channel and is approaching a potential support zone.
This zone is marked by a blue rectangle (support/demand area).
Trade Idea: Long Setup (Buy Position)
Entry Point: Around 97.862
Stop Loss: Around 97.665–97.679 (just below support zone)
Target Point: 98.913 (near previous high)
✅ Trade Rationale
Support Zone: The marked area has previously acted as a demand zone, likely to support price again.
Bullish Recovery Expectation: The idea is that price will bounce from this support zone and resume upward movement.
Good Risk-Reward Ratio:
Risk: ~20 pips (from 97.862 to 97.665)
Reward: ~105 pips (from 97.862 to 98.913)
Risk-to-Reward Ratio: ~1:5 — a favorable setup.
⚠️ Cautions
Price is still above entry level (98.020) — the setup assumes a pullback to the 97.86 area before buying.
If price breaks below 97.665, the setup would be invalidated (stop loss hit).
Channel Breakout Risk: Since the channel is already broken to the downside, this trade assumes a temporary dip before a rebound — which may or may not happen.
📌 Summary
Parameter Value
Entry 97.862
Stop Loss 97.665
Target 98.913
Risk-Reward ~1:5
Trade Direction Long (Buy)
Confirmation Needed Pullback to support zone

DXY Breakout Trade Setup – Bullish Channel & High R:R OpportunitChart Overview:
Instrument: U.S. Dollar Currency Index (DXY)
Timeframe: 1 Hour (1H)
Current Price: 98.371
Analysis Date: September 26, 2025
🔍 Technical Structure:
1. Bullish Channel:
A clear ascending channel is drawn, indicating a strong short-term uptrend.
Price action has been respecting the channel well, moving between the upper and lower trendlines.
A bullish breakout is either anticipated or just confirmed above the channel.
🟦 Trade Setup (Long Position):
✅ Entry Point:
Price: 98.267 (blue horizontal line labeled "Entry Point")
This is slightly below the current price (98.371), suggesting an entry on a slight pullback after breakout.
🛑 Stop Loss:
Price: 97.986 (also marked 97.982 on the lower blue line)
Located below a recent support zone and below the breakout structure.
This gives a safety buffer if the breakout fails.
🎯 Target Point (Take Profit):
Price: 99.676
This is based on the measured move from the height of the channel, projected upward from the breakout point.
📐 Risk-to-Reward Ratio (RRR):
Very favorable; visually it appears to be around 4:1 or higher.
Small stop loss area (red box) relative to the large target area (green box).
High RRR makes this setup attractive for risk-managed traders.
🔎 Additional Observations:
Trend: Strong bullish momentum leading into the breakout.
Volume / Confirmation: Not shown on the chart, but ideally you’d want volume confirmation for the breakout.
Timing: Entry and confirmation should align with break and retest of the channel top.
✅ Summary of the Trade Plan:
Component Value
Entry 98.267
Stop Loss 97.986
Take Profit 99.676
Risk-Reward ~4:1
Trade Type Long (Buy)
Strategy Breakout + Retest
⚠️ Important Notes:
Wait for confirmation (like a bullish candle close above the channel or successful retest).
Be aware of macroeconomic news that can affect DXY (e.g., Fed announcements, interest rate decisions, inflation data).
Use position sizing appropriate to your risk tolerance.

U.S. Dollar Index (DXY) – Bullish Pullback & Long Setup (2H Char1. Price Action & Structure
The chart shows a bullish channel (red shaded area) where price has been making higher highs and higher lows since around September 18.
Price recently reached the upper trendline of the channel and is now pulling back toward the middle/lower zone.
2. Key Levels
Support Zone: Around 97.575 – 97.257 (blue labels).
This is where the chart suggests a potential buy/long entry.
The gray box marks the area where price is expected to reverse to the upside.
Stop-Loss Level: Slightly below 97.257, around 97.238 (red level).
If price breaks below this, it would invalidate the bullish setup.
Target Point: 98.799 – 98.805
This is the projected move upward, shown with the big arrow.
3. Expected Scenario
The zigzag line indicates that price may dip into the support zone, consolidate, and then bounce back up strongly toward the target point.
This is a long (buy) trade setup with a favorable risk-to-reward ratio since the potential reward is much bigger than the stop loss risk.
4. Risk–Reward Ratio
Risk (downside): Around 0.3 points (from 97.575 entry to 97.238 stop).
Reward (upside): Around 1.2 points (from 97.575 entry to 98.799 target).
That’s roughly 4:1 R:R — a very good trade setup if price respects the support zone.
Summary
✅ Bullish Bias – Price is in an uptrend channel.
📉 Buy Zone: 97.575 – 97.257
📊 Target: 98.799 – 98.805
🛑 Stop Loss: Below 97.238
🎯 Expectation: Short-term dip followed by a strong bullish rally.

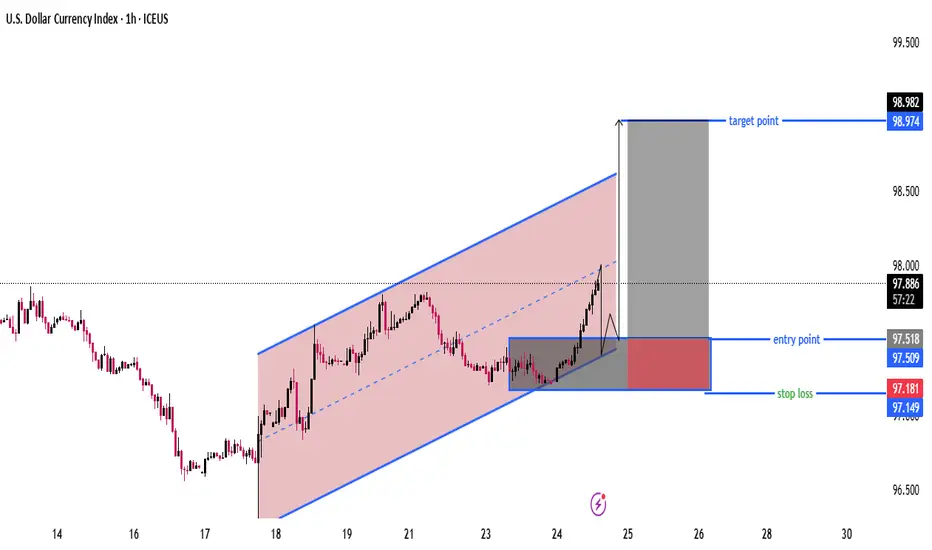
DXY Bullish Channel Setup with 1:4.5 RRR (Entry 97.50 → Target 9Chart Analysis
Trend:
Price is moving inside a rising parallel channel (marked in red with blue borders).
Currently near the mid-to-upper side of the channel.
Setup Highlighted:
Entry Point: Around 97.50 – 97.52 (support zone).
Stop Loss: Around 97.15 – 97.18 (below support and channel bottom).
Target Point: Around 98.97 – 98.98 (near channel top).
Risk-to-Reward Ratio (RRR):
Risk: ~0.33 points (97.50 → 97.18).
Reward: ~1.46 points (97.50 → 98.98).
RRR ≈ 1:4.5, which is a strong setup.
Price Action:
The chart suggests a retest of support (97.50 area) before a bullish continuation.
If buyers hold this level, upward momentum could push toward the 98.90–99.00 zone.
Invalidation:
A breakdown below 97.15 would invalidate the long setup and may push price toward 96.80 – 96.50 support levels.
📌 Summary
Bias: Bullish (as long as price holds above 97.15).
Plan: Wait for a pullback to the entry zone (97.50) for confirmation.
Target: 98.90 – 99.00.
Stop Loss: Below 97.15.
Strong RRR trade idea within the bullish channel.
DXY at Its Most Critical Level of 2025 — Will the 100 Bank LevelThe Dollar Index (DXY), just like several other majors, is approaching a very important level. We’re now near the 100 mark, which is not only a psychological level — but also a key institutional (bank) level.
There’s also a gap zone left behind that price is about to fill. I believe the index will stay in a range over the next 1–2 days as it waits for critical data later this week — especially Wednesday’s announcements and Friday’s NFP report, which could set the tone for what’s next.
Based on current market sentiment, Trump’s remarks, Powell’s upcoming speech, and broader macro factors, I believe DXY has the potential to break above 100 and move toward 102–104, if that level is broken cleanly.
Let’s also not forget — price bounced from a monthly demand block near 96, and we’re seeing weak support across majors like EUR and Gold. That adds confluence for potential dollar strength.
📌 What do you think — is dollar strength just around the corner?
🔁 This analysis will be updated whenever necessary.
Disclaimer: This is not financial advice. Just my personal opinion.
DXY BUYBy utilizing Fibonacci retracement levels, historical patterns, , we can formulate a hypothesis that the market might follow a similar trajectory if bullish sentiment prevails.

U.S. Dollar Index (DXY) Bullish Reversal Setup – 1H Chart Analy ENTRY POINT: 100.005
→ This is the area where the trade is suggested to enter long (buy).
🟥 STOP LOSS: Around 99.307
→ Placed below strong support to manage risk.
🟦 SUPPORT ZONE: 99.776 - 99.307
→ Strong historical demand zone, price has bounced from here before.
🟪 BREAKOUT ZONE: Near 100.5
→ If price breaks the trendline here, it may trigger bullish momentum.
🎯 TARGET POINT: 103.096
→ This is the take profit zone (blue box) with a potential gain of +3.29%.
📊 Trade Setup Summary:
✅ Buy Setup: Price approaching support zone, forming a potential reversal.
⚠️ Watch for breakout: Above the trendline to confirm bullish move.
✨ Great Risk-to-Reward: Small risk (tight stop), big reward.

US DOLLAR Analysis: Bullish Momentum Building?TVC:DXY is finally showing signs of stabilization. The index has successfully rejected a key support level, an area where price has historically attracted strong buying interest. This level closely aligns with the psychological $100 mark, which has once again acted as a pivotal point for market participants, reinforcing its relevance as a key technical level.
The recent price action confirms bullish interest, as evidenced by a strong rejection pattern within the zone, with long lower wicks and bullish follow-through candles. The support zone held firm, and buyers have stepped in, initiating an upward move.
Now that price has bounced from this level, the probability of a continued rally increases. If the bullish momentum sustains, the price could move toward the 102.500 level, a logical near-term target based on previous structure and minor resistance.
However, a failure to maintain above the 100.00 handle or a sudden shift in sentiment could still pose downside risks. A confirmed breakdown below the green support zone would invalidate this bullish outlook and potentially open the door for further declines.
Remember, always confirm your setups and use proper risk management.

EURUSD m15 SellThere’s another Sell opportunity on EURUSD.
I've set the RRR to 1:1.50, with a TP level at 1.13694.
I opened three short positions at: 1.13795 / 1.13802 / 1.13834.
EURUSD is one of the four pairs I trade the most and trust the most.
🔔 If you want to catch setups like this daily, make sure to follow me.Hello everyone. There's a
🔔 I post detailed trade ideas and daily market analysis like this every day on my TradingView profile.

Price Action + Fundamentals Point to Dollar StrengthThe current market environment presents compelling evidence for a bullish move in the US Dollar Index (DXY). While some patience is required, the setup is increasingly favorable for the dollar to appreciate in the coming weeks and months.
Key Factors Supporting a Bullish Move:
Monthly Close Above 100.160:
A critical technical level to monitor is the monthly close above 100.160. If achieved, it would signal a strong bullish breakout, setting the stage for a continuation higher. Given current price action and market dynamics, this scenario looks highly probable. However, if the price fails to close above 100.160 and instead breaks below it, we could potentially start looking for short opportunities.
Bond Market Strength (30Y, 10Y, 5Y):
This past week, we witnessed notable strength across the US bond market. Yields declined as prices rose, typically a positive signal for the dollar as it reflects capital inflows into US assets.
COT Report Insights:
The Commitment of Traders (COT) report reveals a critical shift: commercial traders, often considered the "smart money," are beginning to accumulate long positions in the dollar. This change in positioning historically precedes significant bullish moves.
Seasonal Patterns:
Seasonality also favors the dollar during this period. Historically, the dollar tends to strengthen in the mid-year months, aligning perfectly with the current technical and fundamental landscape.
Targets:
Initial Target: 106.120
Given the accumulation signs and supportive macro backdrop, a move towards 106.120 seems very realistic.

US DOLLAR at Key Support: Will Price Rebound to 103.350?TVC:DXY is currently testing a key support zone, an area where the price has previously shown strong bullish reactions. The recent price action suggests that buyers may step in and drive the price higher. A bullish confirmation, such as a strong rejection pattern, bullish engulfing candles, or long lower wicks, would increase the probability of a bounce from this level. If buyers regain control, the price could move toward the 103.350 level.
However, a breakout below this support would invalidate the bullish outlook, potentially opening the door for further downside.
This is not financial advice but rather how I approach support/resistance zones. Remember, always wait for confirmation, like a rejection candle or volume spike before jumping in.
Please boost this post, every like and comment drives me to bring you more ideas! I’d love to hear your perspective in the comments.
Best of luck , TrendDiva

U.S. Dollar Index (DXY) – Key Technical Levels & Market OutlookU.S. Dollar Index (DXY) Monthly Chart Analysis 📊💵
The U.S. Dollar Index (DXY) is currently navigating a critical price structure, with key supply and demand zones influencing market direction. Here’s a professional breakdown of the chart’s technical outlook:
📍 Key Technical Insights
✅ Supply & Demand Zones
Supply Zone (Resistance): 109 - 114 📈 – A key area where selling pressure has historically emerged. A decisive breakout above this level could signal further upside potential.
Demand Zone (Support): 100 - 103 📉 – A strong accumulation zone where buyers have stepped in previously. A breakdown below could indicate a shift in market sentiment.
✅ Market Structure & Momentum
A Break of Structure (BOSS) has been identified, signaling a shift in trend dynamics.
The market is currently ranging between major resistance (~109) and support (~100).
✅ 200-Month Moving Average 📊
The long-term moving average (red line) is acting as dynamic support, reinforcing the bullish bias unless decisively breached.
📊 Potential Scenarios
🔹 Bullish Outlook: If DXY maintains support above 100-103 and breaks past 109, the index could aim for 114+ in the coming months. 🚀
🔹 Bearish Risk: A sustained drop below 100 may open the door for further downside towards 95-89, signaling a broader correction. ⚠️
📌 Conclusion
The DXY remains in a consolidation phase, with key inflection points around 103 (support) and 109 (resistance). A breakout or breakdown from this range will determine the next major trend. Traders should monitor these levels closely for potential trading opportunities.

DXY Continues bullish momentum from 108.600For the DXY, I anticipate a corrective move, as the price has recently broken structure to the upside. This break has created new demand zones, which we can expect to act as strong support, allowing bullish momentum to continue.
This week, my focus will be on the 8-hour demand zone around 108.600. If the price mitigates this zone, I’ll look for lower time-frame confirmation to enter a trade. My target will be the 8-hour supply zone above, where I anticipate some bearish pressure may emerge.
However, if the price moves lower and breaches the 8-hour demand zone, I’ll shift my attention to the extreme 5-hour demand zone for a potential buying opportunity, aligning with the overall bullish trend.
Let’s stay sharp and make the most of this week. Let’s crush Q1!

DXY IndexDXY - U.S Dollar Index
Completed " 12345 " Impulsive Waves and " A " Corrective Waves
Break of Structure
RSI - Divergence
Rising Wedge as an Corrective Pattern in Short Time Frame
Demand Zone

EUR/USD Trade Setup – 1 Hour TimeframeMessy Price Action 🤕🤧
On the 1-hour timeframe, EUR/USD has formed a supply zone around the 1.11600 price area, and the price is currently pulling back to that level. Meanwhile, the DXY (US Dollar Index) is tapping into a demand level on the daily timeframe.
I’ve also noticed the price slowing down at a minor resistance level, but I’ll wait for a pullback to the supply zone for a more effective entry. Minor support and resistance levels are generally less reliable.
Note: There are two types of Support and Resistance Levels
1. Major Support and Resistance Levels:
These levels have the strength to stop and reverse a trending market altogether.
They are key turning points in the market.
2. Minor Support and Resistance Levels:
These levels only temporarily delay rising or falling prices within a larger trend.
They provide short-term pauses but are generally less impactful..

DXY "Dollar Index" Bank Money Heist Plan on Bullish SideHola ola My Dear,
Robbers / Money Makers & Losers,
This is our master plan to Heist DXY "Dollar Index" Bank based on Thief Trading style Technical Analysis.. kindly please follow the plan I have mentioned in the chart focus on Long entry. Our target is Red Zone that is High risk Dangerous level, market is overbought / Consolidation / Trend Reversal at the level Bearish Robbers / Traders gain the strength. Be safe and be careful and Be rich.
Note: If you've got a lot of money you can get out right away otherwise you can join with a swing trade robbers and continue the heist plan, Use Trailing SL to protect our money.
Entry : Can be taken Anywhere, What I suggest you to Place Buy Limit Orders in 15mins Timeframe Recent / Nearest Swing Low
Stop Loss : Recent Swing Low using 1h timeframe
Warning : Fundamental Analysis comes against our robbery plan. our plan will be ruined smash the Stop Loss. Don't Enter the market at the news update.
Loot and escape on the target 🎯 Swing Traders Plz Book the partial sum of money and wait for next breakout of dynamic level / Order block, Once it is cleared we can continue our heist plan to next new target.
Support our Robbery plan we can easily make money & take money 💰💵 Follow, Like & Share with your friends and Lovers. Make our Robbery Team Very Strong Join Ur hands with US. Loot Everything in this market everyday make money easily with Thief Trading Style.

(DXY) Dollar - Break out pending from its consolidationThe DXY is currently in a consolidation phase, and I expect it to break out soon. Regardless of the direction, we have marked points of interest (POIs) that will help us capitalize on trading opportunities.
- Scenario 1: Price Breaks Upwards
If the price breaks above the consolidation, I anticipate it will fill the imbalance and tap into the supply zones marked on the 30-minute and 8-hour charts.
- Scenario 2: Price Breaks Downwards
If the price moves down, I expect it to mitigate the 16-hour demand zone. This zone appears to be a strong buy setup, likely pushing the dollar back up. There’s also an imbalance above this demand zone that needs to be filled.
Overall, I am favoring an upward move, as this aligns with my bearish outlook on GOLD, EUR/USD, and GBP/USD.

DXY is overbought, maybe a little corrections?(4/12/2024)In our last analysis, the DXY TVC:DXY moved as we had anticipated. Right now the bullish scenario is dominant, but DXY is overbought and hit a resistance.
So there is a chance that price make some retracement.
Our technical view has been shown in the chart.
If you like it then Support us by Like, Following, and Sharing.
Thanks For Reading
Team Fortuna
-RC
(Disclaimer: Published ideas and other Contents on this page are for educational purposes and do not include a financial recommendation. Trading is Risky, so before any action do your research.)

DXY H1 / BULLISH MARKET STRUCTURE SIGNAL => 📈✅ Hello Traders!
This is my idea related to the future movement of DXY H1. As we can see, the market is reacting from the resistance level, and at this moment, I'm looking for a bullish confirmation to execute a long entry. The perfect scenario would be to see a retracement until the OB that I mentioned and after that, to go bullish. In case of confirmation, I will execute this trade.
Traders, if my proposal resonates with you or if you hold a divergent viewpoint regarding this trade, feel free to share your thoughts in the comments. I welcome the opportunity to hear your perspectives.
____________________________________
Follow, like, and comment to see my content:
www.tradingview.com

DXY continued to rise significantly and gold prices started to fThe DXY index, also known as the USD index, is a measure of the strength of the U.S. dollar relative to six of the United States' major trading partners, including the euro (EUR), yen, and Japanese yen (JPY). ), British Pound (GBP), Canadian Dollar (CAD), Swedish Krona (SEK), Swiss Franc (CHF).
The USD Index is calculated from the exchange rates of 6 other currencies (together with the parts that make up the USD Index): EUR 57.6%, JPY 13.6%, GBP 11.9%, CAD 9.1%, SEK 4.2%, CHF 3.6%. Therefore, fluctuations in this index depend not only on the US domestic economy, but also on its correlation with major economies around the world.
To understand this better, let's look back a little at history. When the US Federal Reserve began raising interest rates in 1994, the dollar appreciated until 2000 as tech stocks rose. However, the bursting of the dot-com bubble and the September 11, 2001 terrorist attacks ended DXY's bullish momentum and caused the US dollar to plummet. DXY fell to historic lows during the 2008 financial crisis.
The DXY index started rising again from his 2011 year. This is mainly due to two factors. First, in 2011, most economies in southern Europe were in a difficult situation due to over-indebtedness, which led to a weak euro and a strong US dollar. Second, the Fed first talked about tapering its bond purchases in 2013 and began raising interest rates in 2015. In 2016, with the election of Donald Trump as US president, the dollar hit a 13-year high amid confidence that the Federal Reserve would increase spending on roads, bridges and industry, as well as raise interest rates. , investors are optimistic about future growth rates. of the US economy.

DXY:Oil prices recovered after a volatile end to OctoberOil prices rose slightly in Asian trade on Wednesday, the first in five months, as traders priced in lower risk premiums from the Israel-Hamas war and focus now shifted to the Federal Reserve's interest rate decisions. I have recovered from the worst month of .
The market also had mixed data on U.S. oil inventories, showing that while overall inventories increased, gasoline and distillate inventories declined significantly.
Oil prices have fallen sharply in recent trading amid growing expectations that Israel and Hamas will not have a significant impact on Middle East oil flows, especially with no Arab powers in sight. Others are also involved in the conflict.
However, the World Bank has warned that the conflict could continue to affect oil supplies and cause prices to rise. However, the organization also predicts that oil prices will remain depressed until 2024 on the back of slowing global economic growth. Concerns over weak demand in China also weighed on oil markets, following disappointing factory activity data released on Tuesday by the world's biggest oil importer. The figures came after a dire business report in the euro zone, raising concerns about a slowdown in global economic growth.

Latest news: Gold price has surpassed the $2,000 mark, as demandGold prices rose above $2,000 amid rising geopolitical tensions in the Middle East and demand for safe-haven assets ahead of the Federal Open Market Committee (FOMC) meeting. However, the 10-year bond yield has reached 5.02%, the highest level since 2007, and remains high.
The increase in the US government's debt service rate strengthens the strength of the US dollar, leading to increases in the price of both the US dollar and gold. But gold, which doesn't pay interest, is often under selling pressure when the U.S. dollar and government bond yields rise.
Despite these factors and the fact that U.S. real yields have reached a 15-year high of over 2.60%, gold prices remain resilient.
