DXYU.S Dollar Index
- Order Block
- Fair Value Gap
- Completed " 12345 " Impulsive Waves and " A " Corrective waves
- Fibonacci Level - 50.00% / 61.80%
- Demand Zone
Dxyshort

DXYU.S Dollar Index
- Bearish Channel as an corrective pattern in Short Time Frame
- Break of Structure
- RSI - Divergence
- Completed " 123 " Impulsive Waves
- Demand Zone

DXY Trade Set Up Dec 16 2025Price has swept SSL and has low range liquidity above which i will expect to be swept before a continuation lower

DXY Trade Set Up Dec 12 2025Price is overall in a strong bearish trend which i expect to continue after filling 4h FVG and/or tapping into supply to continue to lower SSL

DXY FRGNT WEEKLY FORECAST - Q4 | W50 | Y25 |📅 Q4 | W50 | Y25 |
📊 DXY FRGNT WEEKLY FORECAST
🔍 Analysis Approach:
I’m applying Smart Money Concepts, focusing on:
Identifying Points of Interest on the Higher Time Frames (HTFs) 🕰️
Using those POIs to define a clear trading range 📐
Refining those zones on Lower Time Frames (LTFs) 🔎
Waiting for a Break of Structure (BoS) for confirmation ✅
This method allows me to stay precise, disciplined, and aligned with the market narrative, rather than chasing price.
💡 My Motto:
"Capital management, discipline, and consistency in your trading edge."
A positive risk-to-reward ratio, paired with a high win rate, is the backbone of any solid trading plan 📈🔐
⚠️ Losses?
They’re part of the mathematical game of trading 🎲
They don’t define you — they’re necessary, they happen, and we move forward 📊➡️
🙏 I appreciate you taking the time to review my Daily Forecast.
Stay sharp, stay consistent, and protect your capital
— FRNGT 🚀
TVC:DXY

DXY FRGNT Daily Forecast -Q4 | W47| D21 | Y25 |📅 Q4 | W47| D21 | Y25 |
📊 DXY FRGNT Daily Forecast
🔍 Analysis Approach:
I’m applying Smart Money Concepts, focusing on:
Identifying Points of Interest on the Higher Time Frames (HTFs) 🕰️
Using those POIs to define a clear trading range 📐
Refining those zones on Lower Time Frames (LTFs) 🔎
Waiting for a Break of Structure (BoS) for confirmation ✅
This method allows me to stay precise, disciplined, and aligned with the market narrative, rather than chasing price.
💡 My Motto:
"Capital management, discipline, and consistency in your trading edge."
A positive risk-to-reward ratio, paired with a high win rate, is the backbone of any solid trading plan 📈🔐
⚠️ Losses?
They’re part of the mathematical game of trading 🎲
They don’t define you — they’re necessary, they happen, and we move forward 📊➡️
🙏 I appreciate you taking the time to review my Daily Forecast.
Stay sharp, stay consistent, and protect your capital
— FRNGT 🚀
TVC:DXY

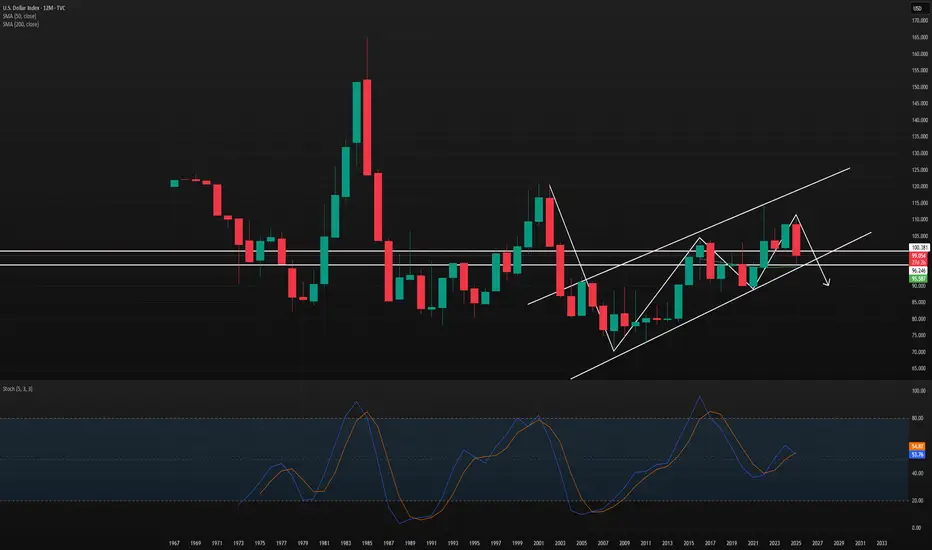
Monitoring a 12 month bearish move on DXYMonitoring a 12 month bearish move on DXY.
TVC:DXY - Monitoring for a bearish reversal on 12 month chart
TVC:ZXY
TVC:EXY
TVC:BXY
TVC:SXY
TVC:JXY
ICMARKETS:XAUUSD
The national debt just crossed over $38 trillion can't be good for USD.
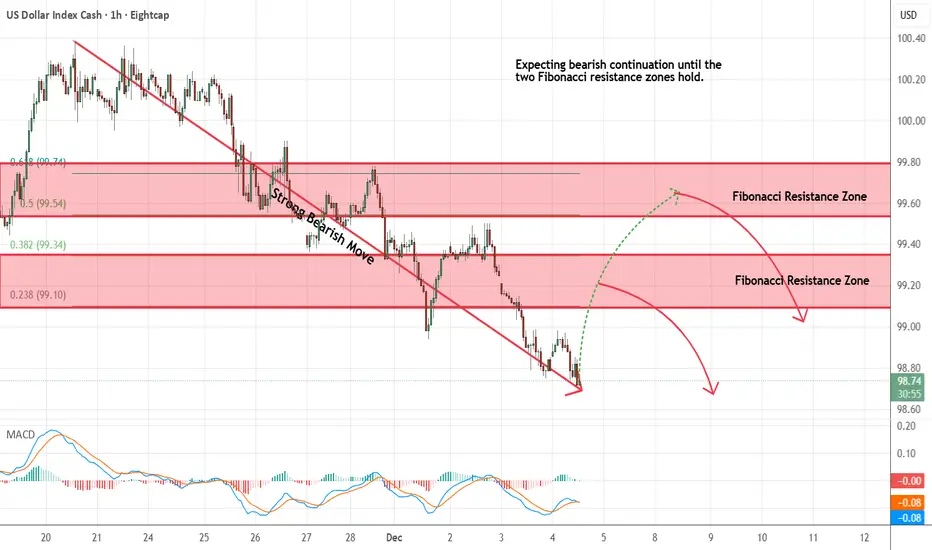
US Dollar Index - Looking To Sell Pullbacks In The Short TermH1 - Strong bearish move.
No opposite signs.
Expecting bearish continuation until the two Fibonacci resistance zones hold.
If you enjoy this idea, don’t forget to LIKE 👍, FOLLOW ✅, SHARE 🙌, and COMMENT ✍! Drop your thoughts and charts below to keep the discussion going. Your support helps keep this content free and reach more people! 🚀
-------------------------------------------------------------------------------------------------------------------
DXY FRGNT Daily Forecast -Q4 | W49| D3| Y25 | 📅 Q4 | W49| D3| Y25 |
📊 DXY FRGNT Daily Forecast
🔍 Analysis Approach:
I’m applying Smart Money Concepts, focusing on:
Identifying Points of Interest on the Higher Time Frames (HTFs) 🕰️
Using those POIs to define a clear trading range 📐
Refining those zones on Lower Time Frames (LTFs) 🔎
Waiting for a Break of Structure (BoS) for confirmation ✅
This method allows me to stay precise, disciplined, and aligned with the market narrative, rather than chasing price.
💡 My Motto:
"Capital management, discipline, and consistency in your trading edge."
A positive risk-to-reward ratio, paired with a high win rate, is the backbone of any solid trading plan 📈🔐
⚠️ Losses?
They’re part of the mathematical game of trading 🎲
They don’t define you — they’re necessary, they happen, and we move forward 📊➡️
🙏 I appreciate you taking the time to review my Daily Forecast.
Stay sharp, stay consistent, and protect your capital
— FRNGT 🚀
TVC:DXY

DXYU.S Dollar Index
- Buy Side Liquidity
- Break of Structure
- Completed " 12345 " Impulsive Waves
- Change of Characteristics
- RSI - Divergence

What should we expect from DXY Index by the end of 2023❗️❓🗺️👋Hi everyone (Reading time less than 3 minutes⏰) .
📚One of the most important Indices that we should have an analysis of is the DXY index because it has a direct impact on the Forex , Cryptocurrency , and stock and etc markets. So, in this post, I'm going to show you the 🗺️ Roadmap 🗺️ for DXY until at least the End of 2023 and Early 2024 .
💡I used the Monthly time frame and Elliott wave theory to display the DXY index roadmap better.
💡First of all, it is better to know that the DXY index has formed an Ascending Channel since 2008 and is moving in it.
🌊According to the theory of Elliott waves , the DXY index has succeeded in completing its 5 impulsive waves in the ascending channel so that the 3rd wave was an extended wave .
🌊As a result, it seems that Corrective waves have started, and to confirm this, it is better to wait for the break of the lower line of the ascending channel.
🔔I expect the DXY to move between 🔴Heavy Resistance zone($107.62-$103.10)🔴 and 🟢Support zone($101.64-$99.58)🟢 by the end of 2023 and early 2024, and in mid-2024 , the DXY will begin to trend Down , and Financial markets will likely turn 🚀Green🚀 .
DXY Index Analyze ( DXYUSD ), Monthly time frame ⏰.
Do not forget to put Stop loss for your positions (For every position you want to open).
Please follow your strategy; this is just my Idea, and I will be glad to see your ideas in this post.
Please do not forget the ✅' like '✅ button 🙏😊 & Share it with your friends; thanks, and Trade safe.

DXYDXY - U.S Dollar Index
- Completed " 1234 " Impulsive Waves
- Fair Value Gap
- Bullish Channel as an corrective pattern in Short Time Frame
- Resistance Level
- Double Top in Short Time Frame

DXY FRGNT Daily Forecast -Q4 | W47| D19 | Y25 |📅 Q4 | W47| D19 | Y25 |
📊 DXY FRGNT Daily Forecast
🔍 Analysis Approach:
I’m applying Smart Money Concepts, focusing on:
Identifying Points of Interest on the Higher Time Frames (HTFs) 🕰️
Using those POIs to define a clear trading range 📐
Refining those zones on Lower Time Frames (LTFs) 🔎
Waiting for a Break of Structure (BoS) for confirmation ✅
This method allows me to stay precise, disciplined, and aligned with the market narrative, rather than chasing price.
💡 My Motto:
"Capital management, discipline, and consistency in your trading edge."
A positive risk-to-reward ratio, paired with a high win rate, is the backbone of any solid trading plan 📈🔐
⚠️ Losses?
They’re part of the mathematical game of trading 🎲
They don’t define you — they’re necessary, they happen, and we move forward 📊➡️
🙏 I appreciate you taking the time to review my Daily Forecast.
Stay sharp, stay consistent, and protect your capital
— FRNGT 🚀
TVC:DXY

DXY FRGNT Daily Forecast - Q4 | W47| D18 | Y25 |📅 Q4 | W47| D18 | Y25 |
📊 DXY FRGNT Daily Forecast
🔍 Analysis Approach:
I’m applying Smart Money Concepts, focusing on:
Identifying Points of Interest on the Higher Time Frames (HTFs) 🕰️
Using those POIs to define a clear trading range 📐
Refining those zones on Lower Time Frames (LTFs) 🔎
Waiting for a Break of Structure (BoS) for confirmation ✅
This method allows me to stay precise, disciplined, and aligned with the market narrative, rather than chasing price.
💡 My Motto:
"Capital management, discipline, and consistency in your trading edge."
A positive risk-to-reward ratio, paired with a high win rate, is the backbone of any solid trading plan 📈🔐
⚠️ Losses?
They’re part of the mathematical game of trading 🎲
They don’t define you — they’re necessary, they happen, and we move forward 📊➡️
🙏 I appreciate you taking the time to review my Daily Forecast.
Stay sharp, stay consistent, and protect your capital
— FRNGT 🚀
TVC:DXY

DXYU.S Dollar Index
- Completed " 12345 " Impulsive Waves and " AB " Corrective Wave
- Break of Structure
- Demand Zone
- Order Block
- Change of Characteristics

DXY (Dollar Index) Daily Outlook (Count 3)This is a daily timeframe outlook of the TVC:DXY . This is in alignment with my previously posted weekly outlook and is a slight alteration of the last posted Daily outlook, both shown in the related publications area.
In this update I am looking for the DXY to continue lower potentially in an ending diagonal pattern towards the red and yellow target zones at around 93.8. As mentioned on the chart, if we see price decline in a traditional impulse with no overlap between wave 4 and 1 then the measured move target will be surpassed.
I have a short trade shown on the DXY chart but this is only indicative of the move I expect, I am instead long FX:EURUSD which moves inversely to the DXY. More comments on the chart.

DXYU.S Dollar Index
- Bullish Channel as an corrective pattern in Long Time Frame
- Break of Structure
- Completed " 1234 " Impulsive Waves
- Fibonacci Level - 23.60%
- Demand Zone

DXY FRGNT Daily Forecast -Q4 | W46 | D11 | Y25 |📅 Q4 | W46 | D11 | Y25 |
📊 DXY FRGNT Daily Forecast
🔍 Analysis Approach:
I’m applying Smart Money Concepts, focusing on:
Identifying Points of Interest on the Higher Time Frames (HTFs) 🕰️
Using those POIs to define a clear trading range 📐
Refining those zones on Lower Time Frames (LTFs) 🔎
Waiting for a Break of Structure (BoS) for confirmation ✅
This method allows me to stay precise, disciplined, and aligned with the market narrative, rather than chasing price.
💡 My Motto:
"Capital management, discipline, and consistency in your trading edge."
A positive risk-to-reward ratio, paired with a high win rate, is the backbone of any solid trading plan 📈🔐
⚠️ Losses?
They’re part of the mathematical game of trading 🎲
They don’t define you — they’re necessary, they happen, and we move forward 📊➡️
🙏 I appreciate you taking the time to review my Daily Forecast.
Stay sharp, stay consistent, and protect your capital
— FRNGT 🚀
TVC:DXY

DXY FRGNT Weekly Forecast -Q4 | W46 | Y25 |📅 Q4 | W46 | Y25 |
📊 DXY FRGNT Weekly Forecast
🔍 Analysis Approach:
I’m applying Smart Money Concepts, focusing on:
Identifying Points of Interest on the Higher Time Frames (HTFs) 🕰️
Using those POIs to define a clear trading range 📐
Refining those zones on Lower Time Frames (LTFs) 🔎
Waiting for a Break of Structure (BoS) for confirmation ✅
This method allows me to stay precise, disciplined, and aligned with the market narrative, rather than chasing price.
💡 My Motto:
"Capital management, discipline, and consistency in your trading edge."
A positive risk-to-reward ratio, paired with a high win rate, is the backbone of any solid trading plan 📈🔐
⚠️ Losses?
They’re part of the mathematical game of trading 🎲
They don’t define you — they’re necessary, they happen, and we move forward 📊➡️
🙏 I appreciate you taking the time to review my Daily Forecast.
Stay sharp, stay consistent, and protect your capital
— FRNGT 🚀
TVC:DXY

FRGNT FUN COUPON FRIDAY -Q4 | W45 | D7| Y25 | DXY📅 Q4 | W45 | D7| Y25 |
📊 DXY FRGNT Daily Forecast
FRGNT FUN COUPON FRIDAY
🔍 Analysis Approach:
I’m applying Smart Money Concepts, focusing on:
Identifying Points of Interest on the Higher Time Frames (HTFs) 🕰️
Using those POIs to define a clear trading range 📐
Refining those zones on Lower Time Frames (LTFs) 🔎
Waiting for a Break of Structure (BoS) for confirmation ✅
This method allows me to stay precise, disciplined, and aligned with the market narrative, rather than chasing price.
💡 My Motto:
"Capital management, discipline, and consistency in your trading edge."
A positive risk-to-reward ratio, paired with a high win rate, is the backbone of any solid trading plan 📈🔐
⚠️ Losses?
They’re part of the mathematical game of trading 🎲
They don’t define you — they’re necessary, they happen, and we move forward 📊➡️
🙏 I appreciate you taking the time to review my Daily Forecast.
Stay sharp, stay consistent, and protect your capital
— FRNGT 🚀
TVC:DXY

DXY FRGNT Daily Forecast -Q4 | W45 | D6| Y25 |📅 Q4 | W45 | D6| Y25 |
📊 DXY FRGNT Daily Forecast
🔍 Analysis Approach:
I’m applying Smart Money Concepts, focusing on:
Identifying Points of Interest on the Higher Time Frames (HTFs) 🕰️
Using those POIs to define a clear trading range 📐
Refining those zones on Lower Time Frames (LTFs) 🔎
Waiting for a Break of Structure (BoS) for confirmation ✅
This method allows me to stay precise, disciplined, and aligned with the market narrative, rather than chasing price.
💡 My Motto:
"Capital management, discipline, and consistency in your trading edge."
A positive risk-to-reward ratio, paired with a high win rate, is the backbone of any solid trading plan 📈🔐
⚠️ Losses?
They’re part of the mathematical game of trading 🎲
They don’t define you — they’re necessary, they happen, and we move forward 📊➡️
🙏 I appreciate you taking the time to review my Daily Forecast.
Stay sharp, stay consistent, and protect your capital
— FRNGT 🚀
TVC:DXY

DXY FRGNT Daily Forecast -Q4 | W45 | D5| Y25 |📅 Q4 | W45 | D5| Y25 |
📊 DXY FRGNT Daily Forecast
🔍 Analysis Approach:
I’m applying Smart Money Concepts, focusing on:
Identifying Points of Interest on the Higher Time Frames (HTFs) 🕰️
Using those POIs to define a clear trading range 📐
Refining those zones on Lower Time Frames (LTFs) 🔎
Waiting for a Break of Structure (BoS) for confirmation ✅
This method allows me to stay precise, disciplined, and aligned with the market narrative, rather than chasing price.
💡 My Motto:
"Capital management, discipline, and consistency in your trading edge."
A positive risk-to-reward ratio, paired with a high win rate, is the backbone of any solid trading plan 📈🔐
⚠️ Losses?
They’re part of the mathematical game of trading 🎲
They don’t define you — they’re necessary, they happen, and we move forward 📊➡️
🙏 I appreciate you taking the time to review my Daily Forecast.
Stay sharp, stay consistent, and protect your capital
— FRNGT 🚀
TVC:DXY

DXY FRGNT Daily Forecast -Q4 | W45 | D4| Y25 |
📅 Q4 | W45 | D4| Y25 |
📊 DXY FRGNT Daily Forecast
🔍 Analysis Approach:
I’m applying Smart Money Concepts, focusing on:
Identifying Points of Interest on the Higher Time Frames (HTFs) 🕰️
Using those POIs to define a clear trading range 📐
Refining those zones on Lower Time Frames (LTFs) 🔎
Waiting for a Break of Structure (BoS) for confirmation ✅
This method allows me to stay precise, disciplined, and aligned with the market narrative, rather than chasing price.
💡 My Motto:
"Capital management, discipline, and consistency in your trading edge."
A positive risk-to-reward ratio, paired with a high win rate, is the backbone of any solid trading plan 📈🔐
⚠️ Losses?
They’re part of the mathematical game of trading 🎲
They don’t define you — they’re necessary, they happen, and we move forward 📊➡️
🙏 I appreciate you taking the time to review my Daily Forecast.
Stay sharp, stay consistent, and protect your capital
— FRNGT 🚀
TVC:DXY
