DXY FRGNT WEEKLY FORECAST - Q4 | W51 | Y25 |
📅 Q4 | W51 | Y25 |
📊 DXY FRGNT WEEKLY FORECAST
🔍 Analysis Approach:
I’m applying Smart Money Concepts, focusing on:
Identifying Points of Interest on the Higher Time Frames (HTFs) 🕰️
Using those POIs to define a clear trading range 📐
Refining those zones on Lower Time Frames (LTFs) 🔎
Waiting for a Break of Structure (BoS) for confirmation ✅
This method allows me to stay precise, disciplined, and aligned with the market narrative, rather than chasing price.
💡 My Motto:
"Capital management, discipline, and consistency in your trading edge."
A positive risk-to-reward ratio, paired with a high win rate, is the backbone of any solid trading plan 📈🔐
⚠️ Losses?
They’re part of the mathematical game of trading 🎲
They don’t define you — they’re necessary, they happen, and we move forward 📊➡️
🙏 I appreciate you taking the time to review my Daily Forecast.
Stay sharp, stay consistent, and protect your capital
— FRNGT 🚀
TVC:DXY
Dxyusd

Dollar Index at Critical Support — Is a Big USD Rally Coming?Today I want to analyze the DXY index( TVC:DXY ) for you, which is one of the key indices in the financial markets.
At the moment, the DXY index is moving near a support zone($98.85-$98.50), Monthly Support (1) level, and the 21_SMA(Weekly).
In addition, the DXY has been trending inside a descending channel for roughly the past 13 trading days.
The main question is whether the DXY can break below this confluence of support levels or not.
Looking at the 4-hour chart, we can identify a Morning Star candlestick reversal pattern, and there is also a clear bullish Regular Divergence (RD+) between the last two lows.
Moreover, the US 10-Year Government Bond Yield ( TVC:US10 ) appears bullish in my view — and its upward movement can potentially support a rise in the DXY as well.
From my perspective, the best currency pairs to capitalize on a stronger USD are USDJPY( FX:USDJPY ) and EURUSD( FX:EURUSD ).
We should also keep in mind that several important US economic indicators will be released this week, which could significantly impact market direction. So be extra cautious with your positions, especially during data releases:
JOLTS Job Openings➡️09 December
Federal Funds Rate➡️10 December
FOMC Statement➡️10 December
FOMC Press Conference➡️10 December
Unemployment Claims➡️11 December
I expect that once the DXY breaks above the upper line of the descending channel, it could at least move toward one of the higher Fibonacci levels.
Do you think the U.S. interest rate will be cut this week?
💡 Please respect each other's opinions and express agreement or disagreement politely.
📌U.S. Dollar index Analysis (DXYUSD), 4-hour time frame.
🛑 Always set a Stop Loss(SL) for every position you open.
✅ This is just my idea; I’d love to see your thoughts too!
🔥 If you find it helpful, please BOOST this post and share it with your friends.

DXY FRGNT Daily Forecast -Q4 | W48| D24 | Y25 |📅 Q4 | W48| D24 | Y25 |
📊 DXY FRGNT Daily Forecast
🔍 Analysis Approach:
I’m applying Smart Money Concepts, focusing on:
Identifying Points of Interest on the Higher Time Frames (HTFs) 🕰️
Using those POIs to define a clear trading range 📐
Refining those zones on Lower Time Frames (LTFs) 🔎
Waiting for a Break of Structure (BoS) for confirmation ✅
This method allows me to stay precise, disciplined, and aligned with the market narrative, rather than chasing price.
💡 My Motto:
"Capital management, discipline, and consistency in your trading edge."
A positive risk-to-reward ratio, paired with a high win rate, is the backbone of any solid trading plan 📈🔐
⚠️ Losses?
They’re part of the mathematical game of trading 🎲
They don’t define you — they’re necessary, they happen, and we move forward 📊➡️
🙏 I appreciate you taking the time to review my Daily Forecast.
Stay sharp, stay consistent, and protect your capital
— FRNGT 🚀
TVC:DXY

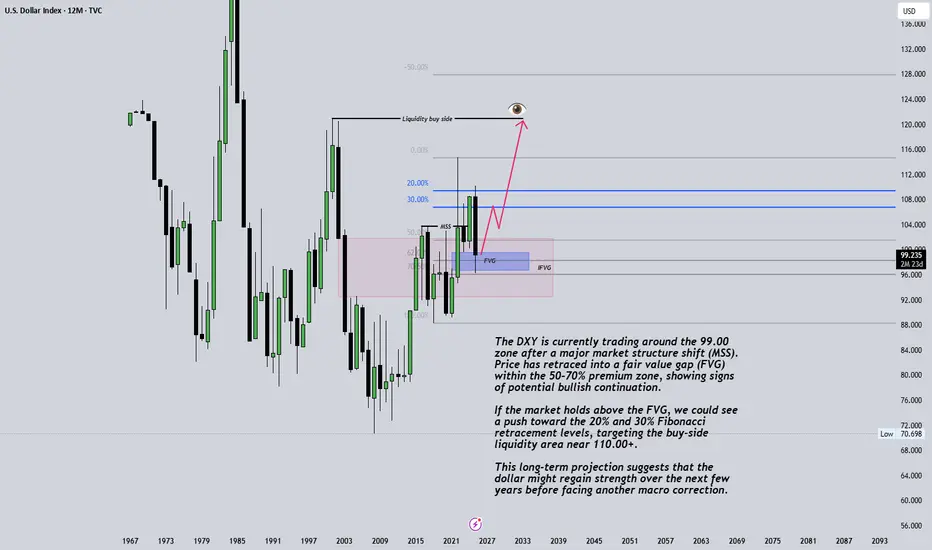
US Dollar Index (DXY) Monthly OutlookThe DXY is currently trading around the 99.00 zone after a major market structure shift (MSS). Price has retraced into a fair value gap (FVG) within the 50–70% premium zone, showing signs of potential bullish continuation.
If the market holds above the FVG, we could see a push toward the 20% and 30% Fibonacci retracement levels, targeting the buy-side liquidity area near 110.00+.
This long-term projection suggests that the dollar might regain strength over the next few years before facing another macro correction.
📅 Timeframe: Monthly
💡 Bias: Bullish towards liquidity highs
⚠️ Disclaimer: This analysis is for educational purposes only and does not constitute financial advice.
#DXY #USDX #DollarIndex #ForexAnalysis #SmartMoneyConcepts #MarketStructure #FVG #Liquidity #Herotraderfx #TradingView
U.S. Dollar IndexHello Dear Traders
This is the updated analysis of the DXY chart. Last week, I explained its bullish trend to you, and this week I was waiting for the necessary confirmations for entry based on last week’s analysis. With this 1-hour confirmation, we can say that this chart has fully turned bullish, and the targets remain as stated in the previous analysis.
Therefore, we can consider sell entries on the Euro, Pound, Australian Dollar, and New Zealand Dollar, while conversely, we can enter buy positions on the Japanese Yen, Canadian Dollar, and Swiss Franc.
Thank you for your support. A very simple and clear chart has been drawn for your use.
Wishing you all success!
Fereydoon Bahrami
A retail trader in the Wall Street Trading Center (Forex)
Risk Disclosure:
Trading in the Forex market is risky due to high price volatility. This analysis is solely my personal opinion and should not be considered financial advice. Please do your own research. You are responsible for any profits or losses resulting from this analysis.

DXY Dollar Index Market Bullish Heist Plan🌟Hi! Hola! Ola! Bonjour! Hallo!🌟
Dear Money Makers & Robbers, 🤑 💰
Based on 🔥Thief Trading style technical and fundamental analysis🔥, here is our master plan to heist the DXY Dollar Index market. Please adhere to the strategy I've outlined in the chart, which emphasizes long entry. Our aim is the high-risk Red Zone. Risky level, overbought market, consolidation, trend reversal, trap at the level where traders and bearish robbers are stronger. 👀 So Be Careful, wealthy and safe trade.💪🏆🎉
Entry 📈 : You can enter a Bull trade at any point after the Breakout.
however I advise placing Buy limit orders within a 15 or 30 minute timeframe. Entry from the most recent or closest low or high level should be in retest.
Stop Loss 🛑: Using the 4H period, the recent / nearest low or high level.
Goal 🎯: 110.500
Scalpers, take note : only scalp on the Long side. If you have a lot of money, you can go straight away; if not, you can join swing traders and carry out the robbery plan. Use trailing SL to safeguard your money 💰.
Based on the fundamental analysis, I would conclude that the DXY (US Dollar Index) is: Bearish
Reasons:
Interest rate differential: The Federal Reserve's (Fed) interest rate (4.50%) is high compared to other major economies, but the rate hike cycle is expected to slow down, which could lead to a decline in the DXY.
Economic growth: The US GDP growth (2.1%) is slowing down, and the economy is facing headwinds from trade tensions and global economic uncertainty, which could lead to a decline in the DXY.
Trade balance: The US trade deficit (USD 50 billion) is large and growing, which could put downward pressure on the DXY.
Fiscal policy: The US fiscal policy is becoming increasingly expansionary, which could lead to a decline in the DXY.
However, it's essential to consider the following risks:
Global economic slowdown: A slowdown in global economic growth, particularly in China and Europe, could lead to a flight to safety and support the DXY.
Geopolitical tensions: Escalating geopolitical tensions, particularly in the Middle East and North Korea, could lead to a flight to safety and support the DXY.
Fed's monetary policy: The Fed's dovish stance and potential interest rate cuts could support the DXY.
Please note that this is a general analysis and not personalized investment advice. It's essential to consider your own risk tolerance and market analysis before making any investment decisions.
Take advantage of the target and get away 🎯 Swing Traders Please reserve the half amount of money and watch for the next dynamic level or order block breakout. Once it is resolved, we can go on to the next new target in our heist plan.
Keep in mind that these factors can change rapidly, and it's essential to stay up-to-date with market developments and adjust your analysis accordingly.
💖Supporting our robbery plan will enable us to effortlessly make and steal money 💰💵 Tell your friends, Colleagues and family to follow, like, and share. Boost the strength of our robbery team. Every day in this market make money with ease by using the Thief Trading Style.🏆💪🤝❤️🎉🚀
I'll see you soon with another heist plan, so stay tuned 🫂

DXY "Dollar Index market" Bullish Heist Plan🌟Hi! Hola! Ola! Bonjour! Hallo!🌟
Dear Money Makers & Robbers, 🤑 💰
Based on 🔥Thief Trading style technical analysis🔥, here is our master plan to heist the DXY "Dollar Index" market. Please adhere to the strategy I've outlined in the chart, which emphasizes long entry. Our aim is the high-risk Red Zone. Risky level, overbought market, consolidation, trend reversal, trap at the level where traders and bearish robbers are stronger. 👀 So Be Careful, wealthy and safe trade.💪🏆🎉
Entry 📈 : You can enter a bull trade at any point,
however I advise placing Multiple Buy limit orders within a 15 or 30 minute timeframe. Entry from the most recent or closest low & high level should be in retest.
Stop Loss 🛑: Using the 4H period, the recent / nearest low level.
Goal 🎯: 109.500
Scalpers, take note : only scalp on the Long side. If you have a lot of money, you can go straight away; if not, you can join swing traders and carry out the robbery plan. Use trailing SL to safeguard your money 💰.
Warning⚠️ : Our heist strategy is incompatible with Fundamental Analysis news 📰 🗞️. We'll wreck our plan by smashing the Stop Loss 🚫🚏. Avoid entering the market right after the news release.
Take advantage of the target and get away 🎯 Swing Traders Please reserve the half amount of money and watch for the next dynamic level or order block breakout. Once it is resolved, we can go on to the next new target in our heist plan.
💖Supporting our robbery plan will enable us to effortlessly make and steal money 💰💵 Tell your friends, Colleagues and family to follow, like, and share. Boost the strength of our robbery team. Every day in this market make money with ease by using the Thief Trading Style.🏆💪🤝❤️🎉🚀
I'll see you soon with another heist plan, so stay tuned 🫂

DXY "Dollar Index" Bank Money Heist Plan on Bullish SideHola ola My Dear,
Robbers / Money Makers & Losers,
This is our master plan to Heist DXY "Dollar Index" Bank based on Thief Trading style Technical Analysis.. kindly please follow the plan I have mentioned in the chart focus on Long entry. Our target is Red Zone that is High risk Dangerous level, market is overbought / Consolidation / Trend Reversal at the level Bearish Robbers / Traders gain the strength. Be safe and be careful and Be rich.
Note: If you've got a lot of money you can get out right away otherwise you can join with a swing trade robbers and continue the heist plan, Use Trailing SL to protect our money.
Entry : Can be taken Anywhere, What I suggest you to Place Buy Limit Orders in 15mins Timeframe Recent / Nearest Swing Low
Stop Loss : Recent Swing Low using 1h timeframe
Warning : Fundamental Analysis comes against our robbery plan. our plan will be ruined smash the Stop Loss. Don't Enter the market at the news update.
Loot and escape on the target 🎯 Swing Traders Plz Book the partial sum of money and wait for next breakout of dynamic level / Order block, Once it is cleared we can continue our heist plan to next new target.
Support our Robbery plan we can easily make money & take money 💰💵 Follow, Like & Share with your friends and Lovers. Make our Robbery Team Very Strong Join Ur hands with US. Loot Everything in this market everyday make money easily with Thief Trading Style.

US dollar market trendYesterday, the deputy governor of the Bank of Japan said that "the market is unstable and there will be no interest rate hikes". This is a relatively "dovish" statement. In addition, the upcoming September interest rate cut conveys a good opportunity to enter the market.
That is, the US dollar will still fall. Although the market is narrow today, the US dollar continued to rise at the end of the trading day, but it should not last long.
Personal analysis: looking for high points and shorting

Gold Set for Explosive Breakout! Key Levels & Patterns to Watch!Daily Chart Breakdown
Chart Overview:
Time Frame: Daily
Key Levels:
Daily LQZ: 2,450.370
4hr/ LQZ: 2,437.909
1hr TP: 2,419.054
Current Price: 2,410.920
Analysis:
Higher Highs (HH) and Higher Lows (HL): The chart indicates a strong uptrend with the formation of higher highs and higher lows. This suggests that the market is in a bullish phase.
Flag Pattern: The price action has formed a flag pattern, which is a continuation pattern. The
breakout from this pattern could lead to further upward movement.
Channels:
The price has been moving within an ascending channel, indicating sustained upward momentum. A descending channel breakout in the past led to the current ascending channel, showing a reversal and continuation of the bullish trend.
Conclusion:
The daily chart shows a strong bullish trend with key levels to watch for potential entries and take-profit targets. The flag pattern and ascending channel support the bullish outlook.
4-Hour Chart Breakdown
Chart Overview:
Time Frame: 4-Hour
Key Levels:
Daily LQZ: 2,450.370
4hr/ LQZ: 2,437.909
1hr TP: 2,419.054
Current Price: 2,410.920
Analysis:
Flag Pattern: The price action is forming a flag pattern similar to the daily chart. This reinforces the bullish continuation expectation.
Channels:
Descending Channel: A descending channel was broken, leading to the current ascending channel.
Ascending Channels: Multiple ascending channels are observed, indicating strong bullish momentum with higher lows and higher highs.
Conclusion:
The 4-hour chart aligns with the daily chart, showing strong bullish momentum with clear patterns and channels supporting further upward movement. Watching the key levels mentioned can help identify entry points and targets.
1-Hour Chart Breakdown
Chart Overview:
Time Frame: 1-Hour
Key Levels:
Daily LQZ: 2,450.370
4hr/ LQZ: 2,437.909
1hr TP: 2,419.054
Current Price: 2,410.920
Analysis:
Flag Pattern: A smaller flag pattern is forming, suggesting a short-term bullish continuation.
Channels:
Ascending Channel: The price is moving within an ascending channel, showing strong upward momentum.
Holding Channels: The price has respected the ascending channels, indicating potential for further upward movement.
Conclusion:
The 1-hour chart provides a detailed view of the recent price action, confirming the bullish trend seen in higher time frames. The ascending channels and flag pattern suggest continued upward movement with key levels acting as potential targets.
Overall Summary
The analysis across daily, 4-hour, and 1-hour charts shows a consistent bullish trend with the formation of higher highs and higher lows. Flag patterns and ascending channels indicate strong upward momentum, with key liquidity zones and take-profit targets identified for potential trading opportunities.

DXY MARKET FORCASTSince the beginning of the week, the DXY has been giving us a correction after last week's impulse move. The market has already broken above the correction area, which was a downtrend in the smaller timeframes. Therefore, I'm expecting the DXY to continue pushing up further, as it has been respecting the setups from my previous analysis. This means the DXY will likely continue rising, and on the other side, we'll be looking for sell opportunities in the gold market and dollar pairs.

Taking a Look At The Dollar Index To Kick Off 2024 DXY / USDTaking a Look At The Dollar Index To Kick Off 2024 DXY / USD As everything hinges off the us dollar I think it is important to take a close look at the dollar index as we trade into the London Open today. In the video I give you my top down approach looking at the DXY

DXY Index will Go Down to 🟢Heavy Support zone🟢(1-Hour)⏰✅The DXY index managed to break the Uptrend line and 🟢 Support zone 🟢.
💫Currently, DXY reacted well to the Resistance line and formed a 💫Shooting Star Candlestick Pattern💫 near this line in the 1-hour time frame ⏰.
🔔I expect the DXY to trend lower in the coming hours , enter the 🟢 Heavy Support zone 🟢, and fall to at least the 🟡 Price Reversal Zone(PRZ) 🟡.
U.S.Dollar Currency Index ( DXYUSD ) Analyze, 1-hour time frame⏰.
Do not forget to put Stop loss for your positions (For every position you want to open).
Please follow your strategy; this is just my Idea, and I will be glad to see your ideas in this post.
Please do not forget the ✅' like '✅ button 🙏😊 & Share it with your friends; thanks, and Trade safe.

dxy have a resthi guys
dollar index is so hot
i want sell on dxy
my structure by ssm and smc look a rest for pull back on dxy

💵DXY💵 will have an upward trend in the Coming Months🚀Hi everyone👋.
💡The DXY index managed to break the 🔴 Resistance zone($103.80-$103.38) 🔴 last week.
🌊According to the Elliott wave theory , DXY completed the Zigzag correction(ABC/5-3-5) with the Expanding Ending Diagonal .
🔔I expect the DXY index to go up in the 🌙Coming Months🌙 and break the upcoming 🔴 Resistance zones 🔴 one by one.
U.S.Dollar Currency Index ( DXYUSD ) Analyze, Daily time frame⏰.
Do not forget to put Stop loss for your positions (For every position you want to open).
Please follow your strategy, this is just my Idea, and I will be glad to see your ideas in this post.
Please do not forget the ✅' like '✅ button 🙏😊 & Share it with your friends; thanks, and Trade safe.

DXY, to longThe DXY has formed a doji on the Daily frame which shows indecision in the price, however the DXY has been able to consolidate above the 103,917 support with a strong rejection wick above it which gives me a bullish signal to the trendline resistance at 104.991 with a possibility of breaking above the ascending channel to the next required resistance of 105.654.
This could cause the dollar quotes to sell in the coming week.

DXY Monthly Analysis after the price retramcemt to fill FVG ''Fare Value Gap'' which is in the levels of the golden zone of Fibonacci OTE ''Optimal Trade Enrty '' we will see a reversal of the price towards the supply zone

DXY 29June2023DXY analysis is still in accordance with the analysis some time ago, still in the a-b-c correction period. if we pull the fibo extension, from wave a to wave b, we can know the forecast of wave c will end.
fibo extension 1.618 is adjacent to the SnD H4 area. it could be that the price is heading in that direction.

DXY Weekly OutlookWeekly Timeframe
- DXY tapped the Weekly Fair Value Gap & 0.5 Level of the whole move.
- As Per 37 Year Seasonality chart, DXY will go to tap May Highs & Weekly Liquidity Upside.
Daily Timeframe :
- On Daily time frame withing the Weekly FVG, we get a Daily Orderblock.
- This orderblock is acting as a support and price is giving a good reaction from the orderblock.
- So far Price stays above this order block, expecting the price to move towards 104.699 - 105.883 Levels.
12 HR Timeframe
This chart is from the perspective of Pattern & Elliot Wave Count.
- On 12 HR it's forming Wave 4 Bull flag with ABC subwaves.
- Breakout from this bull flag will confirm that the price is heading for the extended 5th Wave.

DXY Weekly CloseOnly a personal opinion - DXY Weekly
Seems positive for the USD today; look out two weeks, and it can still remain around the 102 level.
It will be sideways in the area 102-103 for the following week, now attempting to go to area 103.
If it break, the area 103 will continue to the area 104,448.
Perhaps the usd will receive some good news.

DXY Index Next MovePair : DXY Index
Description :
Break of Structure
Short Sell Long Buy Divergence
Bearish Channel in Long Term and Breakout of the Upper Trend Line
Completed " 1234 " Impulsive and Making it " 5th " Wave
Rising Wedge in Short Time Frame as a Corrective Pattern

DXY LONG PLAY 06-02-23 (H4)The weekly close was very bullish , this is my first target next week. I am targeting the daily FVG and equilibrium of the FVG. My long-term play is the weekly volume imbalance as it has been for a few weeks but it may take months to play out.

Plan A or Plan B on this index?Hello, my dear friends and fellow traders.
What we are going to look at today is the US dollar index. When looking at the daily chart this is a good setup for the price of this index to go up. if we see if this index can be taken long position, according to the daily time scale in this index, it is at the lower side. Very dangerous one to take a long position. But it has the potential to go up.
So, keep the trailing stop small in this. If you take it for a long time, there is a 1:2 RR chance of giving it. Also, it has a 1:8 chance of giving a good move to go up.
However, due to the current opposition, there are chances to stop this rally. So, the first profit target in this should be 1:2. Then if you want you can keep 1:8 but it depends on the system.
Till then wishing you a good luck on this strategy. See you in my next post.
It is wise to follow your risk management before taking entry.
I love to share my ideas. Feel free to revise the text and provide feedback. It makes it so personal and improve us in better ways.
CAPITALCOM:DXY
Thanks & regards,
Alpha Trading Station
Disclaimer: This view is for educational purpose only & any stock mentioned here should not be taken as a trading/investing advice. We may or may not have position in the stocks mentioned here. Please consult your financial advisor before investing. Because Price is the "King of Market".
