DYDXUSDT UPDATE#DYDX
UPDATE
DYDX Technical Setup
Pattern: Falling Wedge Pattern
Current Price: 0.1915$
Target Price: 0.3428$
Target % Gain: 79.16%
Technical Analysis: DYDX is breaking out of a falling wedge pattern on the 1D chart, signaling bullish potential. Price has started to reclaim the wedge resistance after a prolonged downtrend, and the structure suggests a momentum shift to the upside. The projected move aligns with the measured target shown on the chart.
Time Frame: 1D
Risk Management Tip: Always use proper risk management.
DYDXBTC

#DYDX/USDT Secondary Trend. Capitulation Zone. Wedge #DYDX
The price is moving within a descending channel on the 1-hour frame, adhering well to it, and is heading for a strong breakout and retest.
We have a bearish trend on the RSI indicator that is about to be broken and retested, which supports the upward breakout.
There is a major support area in green at 0.595, representing a strong support point.
We are heading for consolidation above the 100 moving average.
Entry price: 0.615
First target: 0.626
Second target: 0.638
Third target: 0.652
Don't forget a simple matter: capital management.
When you reach the first target, save some money and then change your stop-loss order to an entry order.
For inquiries, please leave a comment.
Thank you.

#DYDX/USDT Breakout from Falling Wedge |
#DYDX
The price is moving within a descending channel on the 1-hour frame, adhering well to it, and is heading for a strong breakout and retest.
We have a bearish trend on the RSI indicator that is about to be broken and retested, which supports the upward breakout.
There is a major support area in green at 0.577, representing a strong support point.
We are heading for consolidation above the 100 moving average.
Entry price: 0.603
First target: 0.625
Second target: 0.641
Third target: 0.663
Don't forget a simple matter: capital management.
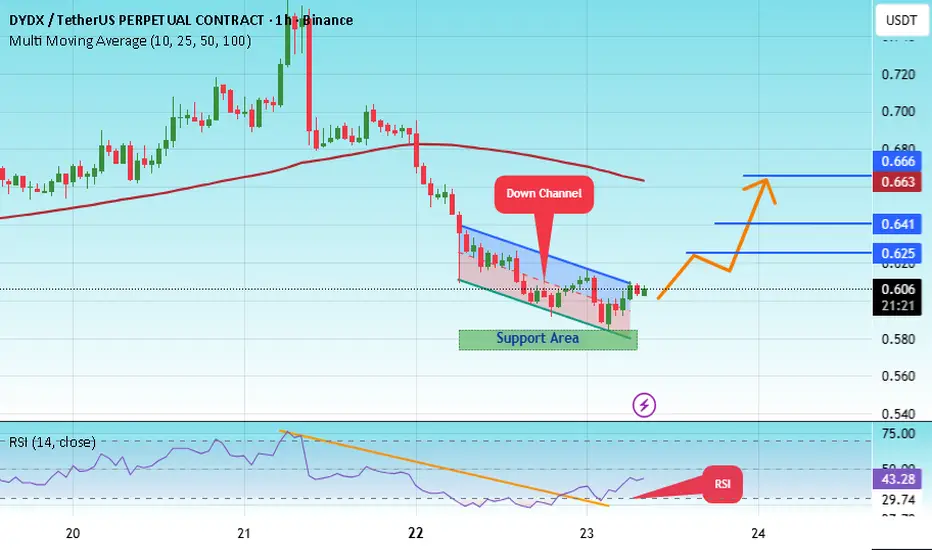
#DYDX/USDT Breakout from Falling Wedge |#DYDX
The price is moving within a descending channel on the 1-hour frame, adhering well to it, and is heading for a strong breakout and retest.
We have a bearish trend on the RSI indicator that is about to be broken and retested, which supports the upward breakout.
There is a major support area in green at 0.577, representing a strong support point.
We are heading for consolidation above the 100 moving average.
Entry price: 0.603
First target: 0.625
Second target: 0.641
Third target: 0.663
Don't forget a simple matter: capital management.
When you reach the first target, save some money and then change your stop-loss order to an entry order.
For inquiries, please leave a comment.
Thank you.

DYDXUSDT UPDATE#DYDX
UPDATE
DYDX Technical Setup
Pattern: Bullish Falling Wedge Pattern
Current Price: $1.92
Target Price: $2.40
Target % Gain: 25.22%
EURONEXT:DYDX is breaking out of a falling wedge pattern on the 1D timeframe. Current price is $1.92 with a target near $2.40, showing about 25% potential upside. The breakout confirms bullish momentum with structure favoring continuation. Always use proper risk management.
Time Frame: 1D
Risk Management Tip: Always use proper risk management.

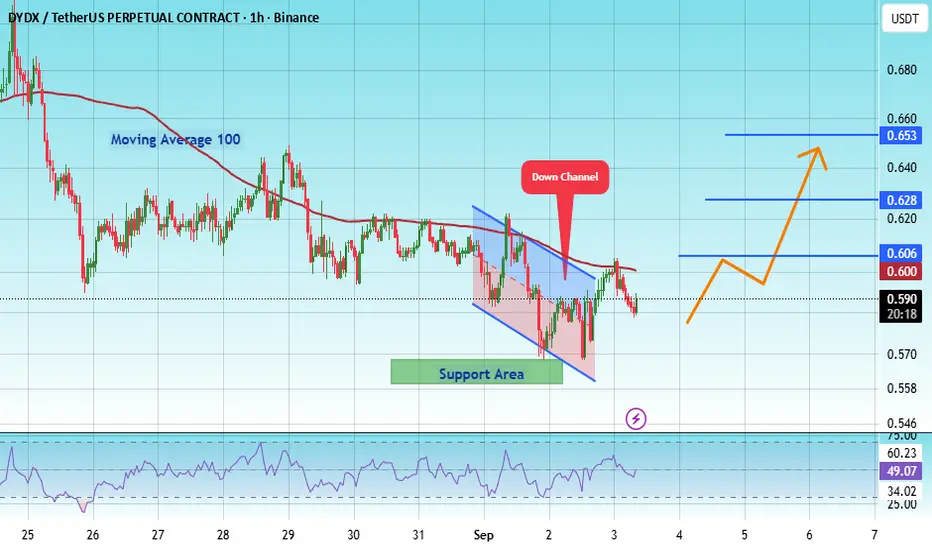
#DYDX/USDT Breakout from Falling Wedge | #DYDX
The price is moving within a descending channel on the 1-hour frame, adhering well to it, and is heading for a strong breakout and retest.
We have a bearish trend on the RSI indicator that is about to be broken and retested, which supports the upward breakout.
There is a major support area in green at 0.563, which represents a strong support point.
For inquiries, please leave a comment.
We are in a consolidation trend above the 100 moving average.
Entry price: 0.588
First target: 0.600
Second target: 0.628
Third target: 0.653
Don't forget a simple matter: capital management.
When you reach the first target, save some money and then change your stop-loss order to an entry order.
For inquiries, please leave a comment.
Thank you.
#DYDX/USDT#DYDX
The price is moving within an ascending channel on the 1-hour frame, adhering well to it, and is on track to break it strongly upwards and retest it.
We have support from the lower boundary of the ascending channel, at 0.612.
We have a downtrend on the RSI indicator that is about to break and retest, supporting the upside.
There is a major support area in green at 0.606, which represents a strong basis for the upside.
Don't forget a simple thing: ease and capital.
When you reach the first target, save some money and then change your stop-loss order to an entry order.
For inquiries, please leave a comment.
We have a trend to hold above the 100 Moving Average.
Entry price: 0.656.
First target: 0.670.
Second target: 0.690.
Third target: 0.717.
Don't forget a simple thing: ease and capital.
When you reach the first target, save some money and then change your stop-loss order to an entry order.
For inquiries, please leave a comment.
Thank you.

#DYDX/USDT#DYDX
The price is moving within a descending channel on the 1-hour frame, adhering well to it, and is on its way to breaking strongly upwards and retesting it.
We have support from the lower boundary of the descending channel, at 0.640.
We have a downtrend on the RSI indicator that is about to be broken and retested, supporting the upside.
There is a major support area in green at 0.638, which represents a strong basis for the upside.
Don't forget a simple thing: ease and capital.
When you reach the first target, save some money and then change your stop-loss order to an entry order.
For inquiries, please leave a comment.
We have a trend to hold above the 100 Moving Average.
Entry price: 0.650
First target: 0.669
Second target: 0.690
Third target: 0.717
Don't forget a simple thing: ease and capital.
When you reach your first target, save some money and then change your stop-loss order to an entry order.
For inquiries, please leave a comment.
Thank you.

#DyDx Superb opportunity#DYDX
The price is moving within a descending channel on the 1-hour frame, adhering well to it, and is on its way to breaking it strongly upwards and retesting it.
We have a bounce from the lower boundary of the descending channel. This support is at 0.470.
We have a downtrend on the RSI indicator that is about to be broken and retested, supporting the upside.
There is a major support area in green at 0.445, which represents a strong basis for the upside.
Don't forget a simple thing: ease and capital.
When you reach the first target, save some money and then change your stop-loss order to an entry order.
For inquiries, please leave a comment.
We have a trend to hold above the 100 Moving Average.
Entry price: 0.500.
First target: 0.522.
Second target: 0.537.
Third target: 0.559.
Don't forget a simple thing: ease and capital.
When you reach your first target, save some money and then change your stop-loss order to an entry order.
For inquiries, please leave a comment.
Thank you.

#DYDX/USDT#DYDX
The price is moving within a descending channel on the 1-hour frame, adhering well to it, and is heading towards a strong breakout and retest.
We are experiencing a rebound from the lower boundary of the descending channel. This support is at 0.566
We are experiencing a downtrend on the RSI indicator, which is about to break and retest, supporting the upward trend.
We are heading towards stability above the 100 moving average.
Entry price: 0.575
First target: 0.584
Second target: 0.592
Third target: 0.602

#DYDX#DYDX
The price is moving within a descending channel on the 1-hour frame, adhering well to it, and is heading for a strong breakout and retest.
We are seeing a bounce from the lower boundary of the descending channel, which is support at 0.
We have a downtrend on the RSI indicator that is about to break and retest, supporting the upside.
We are looking for stability above the 100 moving average.
Entry price: 0.706
First target: 0.741
Second target: 0.766
Third target: 0.800

#DYDX/USDT#DYDX
The price is moving within a descending channel on the 1-hour frame, adhering well to it, and is on its way to breaking it strongly upwards and retesting it.
We are seeing a bounce from the lower boundary of the descending channel, which is support at 0.5000.
We have a downtrend on the RSI indicator that is about to break and retest, supporting the upward trend.
We are looking for stability above the 100 moving average.
Entry price: 0.543
First target: 0.563
Second target: 0.590
Third target: 0.623

DYDXUSDT – Key Resistance Zones Marked!I’ve identified blue boxes as critical resistance areas—these are the levels where price could face heavy selling pressure. But remember, we don’t short blindly—we wait for confirmations.
📊 How I’m Trading This:
✅ Step 1: Watch for CDV confirmation is volume decreasing while price climbs?
✅ Step 2: Look for LTF breakouts downward a clean market structure shift signals entry.
✅ Step 3: If resistance holds + volume supports = I take the trade. If not, I step aside.
💡 Why This Matters:
Most traders short too early and get wrecked. I wait for clear signs of rejection before entering. That’s the difference between guessing and executing.
🔥 Final Thought:
If price suddenly breaks upwards and holds, I will not insist on a short. But if we see rejection + a retest? Then it’s go time. 🚀
📈 Follow for precision trades—because smart traders wait for the perfect moment. 🔥
A tiny part of my runners:
🎯 ZENUSDT.P: Patience & Profitability | %230 Reaction from the Sniper Entry
🐶 DOGEUSDT.P: Next Move
🎨 RENDERUSDT.P: Opportunity of the Month
💎 ETHUSDT.P: Where to Retrace
🟢 BNBUSDT.P: Potential Surge
📊 BTC Dominance: Reaction Zone
🌊 WAVESUSDT.P: Demand Zone Potential
🟣 UNIUSDT.P: Long-Term Trade
🔵 XRPUSDT.P: Entry Zones
🔗 LINKUSDT.P: Follow The River
📈 BTCUSDT.P: Two Key Demand Zones
🟩 POLUSDT: Bullish Momentum
🌟 PENDLEUSDT.P: Where Opportunity Meets Precision
🔥 BTCUSDT.P: Liquidation of Highly Leveraged Longs
🌊 SOLUSDT.P: SOL's Dip - Your Opportunity
🐸 1000PEPEUSDT.P: Prime Bounce Zone Unlocked
🚀 ETHUSDT.P: Set to Explode - Don't Miss This Game Changer
🤖 IQUSDT: Smart Plan
⚡️ PONDUSDT: A Trade Not Taken Is Better Than a Losing One
💼 STMXUSDT: 2 Buying Areas
🐢 TURBOUSDT: Buy Zones and Buyer Presence
🌍 ICPUSDT.P: Massive Upside Potential | Check the Trade Update For Seeing Results
🟠 IDEXUSDT: Spot Buy Area | %26 Profit if You Trade with MSB
📌 USUALUSDT: Buyers Are Active + %70 Profit in Total
🌟 FORTHUSDT: Sniper Entry +%26 Reaction
🐳 QKCUSDT: Sniper Entry +%57 Reaction
📊 BTC.D: Retest of Key Area Highly Likely
📊 XNOUSDT %80 Reaction with a Simple Blue Box!
📊 ORCAUSDT %29 Reaction with a Simple Blue Box!
I stopped adding to the list because it's kinda tiring to add 5-10 charts in every move but you can check my profile and see that it goes on..

#DYDX/USDT#DYDX
The price is moving in a descending channel on the 1-hour frame and is adhering to it well and is heading to break it strongly upwards and retest it
We have a bounce from the lower limit of the descending channel, this support is at a price of 0.760
We have a downtrend on the RSI indicator that is about to be broken and retested, which supports the rise
We have a trend to stabilize above the moving average 100
Entry price 0.770
First target 0.800
Second target 0.820
Third target .842

#DYDX/USDT#DYDX
The price is moving in a descending channel on the 1-hour frame and is expected to continue upwards
We have a trend to stabilize above the moving average 100 again
We have a descending trend on the RSI indicator that supports the rise by breaking it upwards
We have a support area at the lower limit of the channel at a price of 0.633
Entry price 0.647
First target 0.662
Second target 0.675
Third target 0.691

#DYDX/USDT#DYDX
The price is moving within a descending channel on the 1-hour frame, adhering well to it, and is on its way to breaking it strongly upwards and retesting it.
We are seeing a rebound from the lower boundary of the descending channel, which is support at 0.5050.
We have a downtrend on the RSI indicator that is about to break and retest, supporting the upward trend.
We are looking for stability above the 100 moving average.
Entry price: 0.7529
First target: 0.6467
Second target: 0.6932
Third target: 0.7529

#DYDX/USDT #DYDX
The price is moving in a descending channel on the 1-hour frame and is adhering to it well and is heading to break it upwards strongly
We have a bounce from the lower limit of the descending channel, this support is at a price of 1.00
We have a downtrend on the RSI indicator that is about to be broken, which supports the rise
We have a trend to stabilize above the moving average 100
Entry price 1.04
First target 1.08
Second target 1.35
Third target 1.20

DYDX/BTC: Bottoming Out or More Pain Ahead?DYDX/BTC has been in a steep downtrend for months, but we might be seeing signs of a potential reversal. The pair is currently testing a key support level within a descending channel, with price action suggesting a possible bounce.
Key Levels to Watch:
Support Zone: ~0.00000900 - 0.00000950
Resistance Levels: ~0.00001200 (short-term), ~0.00001500 (major)
Target: 0.00001316 (+32.92%)
Stop Loss: 0.00000850 (-5.21%)
Risk/Reward Ratio: 5.2
Indicators & Market Structure:
The price is hovering around the lower bound of the channel, which has previously acted as a strong demand zone.
DMF Index shows a potential momentum shift, with green bars indicating early bullish divergence.
If bulls can hold this zone, we might see a relief rally towards mid-channel resistance.
Strategy Outlook:
A long position from the current levels offers an attractive R/R ratio. However, a breakdown below 0.00000850 could signal further downside. The coming days will be critical in confirming whether this is a local bottom or just another temporary pause before further declines.

#DYDX/USDT Ready to go higher#DYDX
The price is moving in a descending channel on the 1-hour frame and sticking to it well
We have a bounce from the lower limit of the descending channel, this support is at 1.20
We have a downtrend on the RSI indicator that is about to be broken, which supports the rise
We have a trend to stabilize above the 100 moving average
Entry price 1.32
First target 1.38
Second target 1.45
Third target 1.55

#DYDX/USDT Ready to go higher#DYDX
The price is moving in a descending channel on the 30-minute frame and is sticking to it well
We have a bounce from the lower limit of the descending channel, this support is at 1.30
We have a downtrend on the RSI indicator that is about to be broken, which supports the rise
We have a trend to stabilize above the 100 moving average
Entry price 1.34
First target 1.36
Second target 1.40
Third target 1.44

DYDXUSDT: Precision Trading – Blue Box Demand Zone Identified! DYDXUSDT is offering an exceptional opportunity for traders with the blue box carefully identified as a high-potential demand zone . This level represents the most rational entry point for those seeking a balance of precision and risk management.
Why Focus on the Blue Box?
Meticulous Analysis: The blue box has been selected using volume footprint, volume profile, cumulative delta volume (CDV), and liquidity heatmaps , ensuring it highlights a key area of demand.
Strategic Confirmation: Before trading, I’ll validate the setup using CDV, liquidity heatmaps, volume profiles, volume footprints (to confirm buyers are present), and upward market structure breaks in lower time frames . This ensures only high-probability trades are taken.
Calculated Risk Management: In a market with heightened uncertainty, the blue box stands out as the most logical and calculated entry zone.
The Path Forward:
By focusing on this demand zone, we position ourselves for a well-timed entry, reducing risk while maximizing potential returns.
Engage & Elevate:
If this analysis resonates with you, please boost and share your thoughts in the comments! Your engagement inspires me to continue providing actionable insights.
Learn to Trade Like This – For Free!
Interested in learning how to identify such precise demand zones? DM me to discover how I use CDV, liquidity heatmaps, volume profiles, and volume footprints for these setups. I’m happy to share my methods completely free – let’s succeed together!
If you think this analysis helps you, please don't forget to boost and comment on this. These motivate me to share more insights with you!
I keep my charts clean and simple because I believe clarity leads to better decisions.
My approach is built on years of experience and a solid track record. I don’t claim to know it all, but I’m confident in my ability to spot high-probability setups.
If you would like to learn how to use the heatmap, cumulative volume delta and volume footprint techniques that I use below to determine very accurate demand regions, you can send me a private message. I help anyone who wants it completely free of charge.
My Previous Analysis (the list is long but I think it's kinda good : )
🎯 ZENUSDT.P: Patience & Profitability | %230 Reaction from the Sniper Entry
🐶 DOGEUSDT.P: Next Move
🎨 RENDERUSDT.P: Opportunity of the Month
💎 ETHUSDT.P: Where to Retrace
🟢 BNBUSDT.P: Potential Surge
📊 BTC Dominance: Reaction Zone
🌊 WAVESUSDT.P: Demand Zone Potential
🟣 UNIUSDT.P: Long-Term Trade
🔵 XRPUSDT.P: Entry Zones
🔗 LINKUSDT.P: Follow The River
📈 BTCUSDT.P: Two Key Demand Zones
🟩 POLUSDT: Bullish Momentum
🌟 PENDLEUSDT.P: Where Opportunity Meets Precision
🔥 BTCUSDT.P: Liquidation of Highly Leveraged Longs
🌊 SOLUSDT.P: SOL's Dip - Your Opportunity
🐸 1000PEPEUSDT.P: Prime Bounce Zone Unlocked
🚀 ETHUSDT.P: Set to Explode - Don't Miss This Game Changer
🤖 IQUSDT: Smart Plan
⚡️ PONDUSDT: A Trade Not Taken Is Better Than a Losing One
💼 STMXUSDT: 2 Buying Areas
🐢 TURBOUSDT: Buy Zones and Buyer Presence
🌍 ICPUSDT.P: Massive Upside Potential | Check the Trade Update For Seeing Results
🟠 IDEXUSDT: Spot Buy Area | %26 Profit if You Trade with MSB
📌 USUALUSDT: Buyers Are Active + %70 Profit in Total
🌟 FORTHUSDT: Sniper Entry +%26 Reaction
🐳 QKCUSDT: Sniper Entry +%57 Reaction
📊 BTC.D: Retest of Key Area Highly Likely
I stopped adding to the list because it's kinda tiring to add 5-10 charts in every move but you can check my profile and see that it goes on..

#DYDX/USDT Ready to launch upwards#DYDX
The price is moving in a descending channel on the 1-hour frame and sticking to it well
We have a bounce from the lower limit of the descending channel, this support is at a price of 1.37
We have a downtrend on the RSI indicator that is about to be broken, which supports the rise
We have a trend to stabilize above the moving average 100
Entry price 1.46
First target 1.57
Second target 1.72
Third target 1.89

DYDX Looks BullishA large pool of liquidity has been hunted and the price is showing signs of a reversal at the bottom.
It is expected to be pumped to the target soon.
The time frame is big and daily, you have to control the risk.
Closing a daily candle below the invalidation level will violate this analysis
For risk management, please don't forget stop loss and capital management
Comment if you have any questions
Thank You
