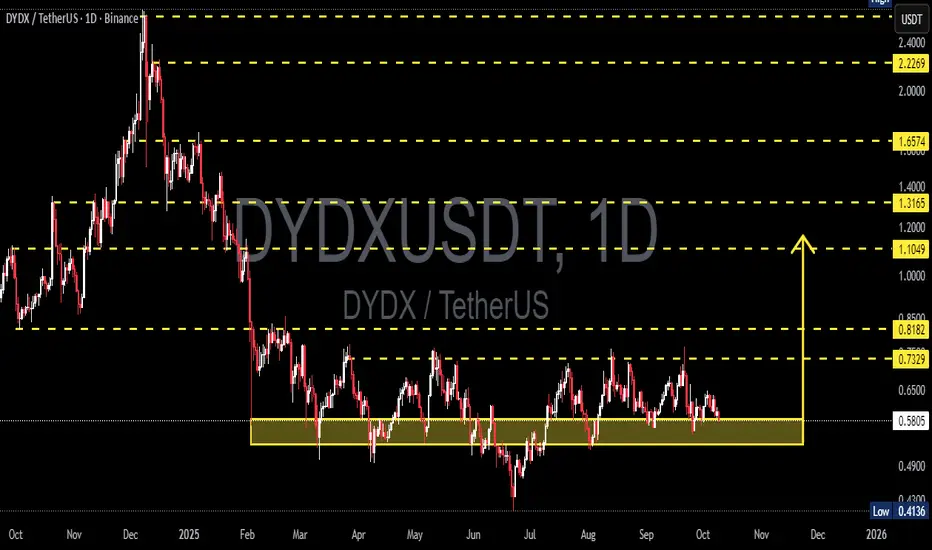
DYDX/USDT — Buyers on the Edge, Breakout or Breakdown?DYDX is once again testing its major demand zone between $0.53 and $0.58, an area that has consistently acted as a strong defensive wall for buyers over the past several months.
Each dip into this region has triggered a solid rebound — suggesting institutional or large-scale accumulation at the bottom of the range. However, with momentum fading and volume drying up, this support zone is now under serious pressure.
---
Market Structure & Technical Pattern
Primary trend: DYDX remains in a broad consolidation phase following its steep decline from the $2.2 peak.
Dominant pattern: Horizontal accumulation base — the price is trapped between a solid support zone at $0.53–$0.58 and strong resistance at $0.73–$0.82.
Market sentiment: Neutral-to-bearish; buyers still defend the base, but bullish momentum has yet to show meaningful confirmation.
At this point, the reaction around $0.53–$0.58 will determine DYDX’s next macro direction — whether it’s ready to rebound or fall into a deeper correction.
---
Bullish Scenario — Rebound from the Accumulation Zone
If DYDX holds above $0.53 and confirms a bounce with increasing volume and higher lows, the pair could initiate a mid-term reversal setup.
Breakout confirmation would occur once price breaks:
$0.73 (initial resistance) → leading to
$0.82, and then
$1.10 and $1.31 as the next targets.
As long as $0.53 remains intact, this base may serve as a launchpad for the next impulsive move upward.
---
Bearish Scenario — Breakdown Below Support
Conversely, if DYDX closes a daily candle below $0.53, the accumulation structure will shift into a distribution phase, signaling continuation of the broader downtrend.
Potential downside targets include:
$0.41 (previous low),
and if selling pressure extends, $0.30–$0.35 could be revisited.
A breakdown below $0.53 could trigger short-term capitulation, as this area has acted as a strong demand zone since early 2025.
---
Conclusion
DYDX is now sitting at a critical decision zone between $0.53 and $0.58 — a level that has defined the market structure for months.
Buyers still show resilience, but the market demands volume confirmation and a structural breakout to signal true bullish reversal.
As long as the base holds, the probability of recovery remains alive.
But a daily close below $0.53 would likely confirm a breakdown and a shift to a bearish continuation phase.
--
#DYDX #DYDXUSDT #CryptoAnalysis #TechnicalAnalysis #SupportResistance #BreakoutSetup #AccumulationZone #AltcoinAnalysis #CryptoTrading #DeFiToken #MarketStructure #PriceAction #CryptoInsights
DYDXUSDTPERP
#DYDX/USDT Secondary Trend. Capitulation Zone. Wedge #DYDX
The price is moving within a descending channel on the 1-hour frame, adhering well to it, and is heading for a strong breakout and retest.
We have a bearish trend on the RSI indicator that is about to be broken and retested, which supports the upward breakout.
There is a major support area in green at 0.595, representing a strong support point.
We are heading for consolidation above the 100 moving average.
Entry price: 0.615
First target: 0.626
Second target: 0.638
Third target: 0.652
Don't forget a simple matter: capital management.
When you reach the first target, save some money and then change your stop-loss order to an entry order.
For inquiries, please leave a comment.
Thank you.

#DYDX/USDT Breakout from Falling Wedge |
#DYDX
The price is moving within a descending channel on the 1-hour frame, adhering well to it, and is heading for a strong breakout and retest.
We have a bearish trend on the RSI indicator that is about to be broken and retested, which supports the upward breakout.
There is a major support area in green at 0.577, representing a strong support point.
We are heading for consolidation above the 100 moving average.
Entry price: 0.603
First target: 0.625
Second target: 0.641
Third target: 0.663
Don't forget a simple matter: capital management.
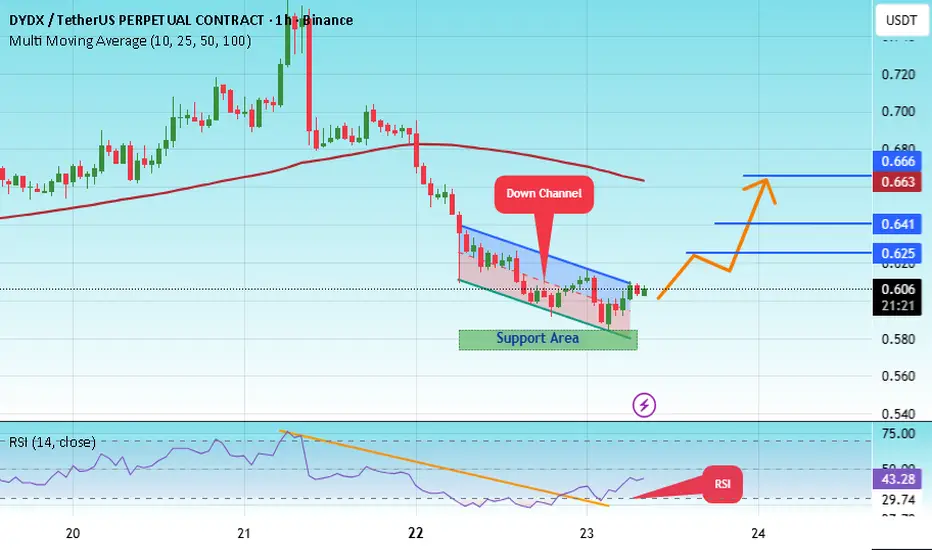
#DYDX/USDT Breakout from Falling Wedge |#DYDX
The price is moving within a descending channel on the 1-hour frame, adhering well to it, and is heading for a strong breakout and retest.
We have a bearish trend on the RSI indicator that is about to be broken and retested, which supports the upward breakout.
There is a major support area in green at 0.577, representing a strong support point.
We are heading for consolidation above the 100 moving average.
Entry price: 0.603
First target: 0.625
Second target: 0.641
Third target: 0.663
Don't forget a simple matter: capital management.
When you reach the first target, save some money and then change your stop-loss order to an entry order.
For inquiries, please leave a comment.
Thank you.

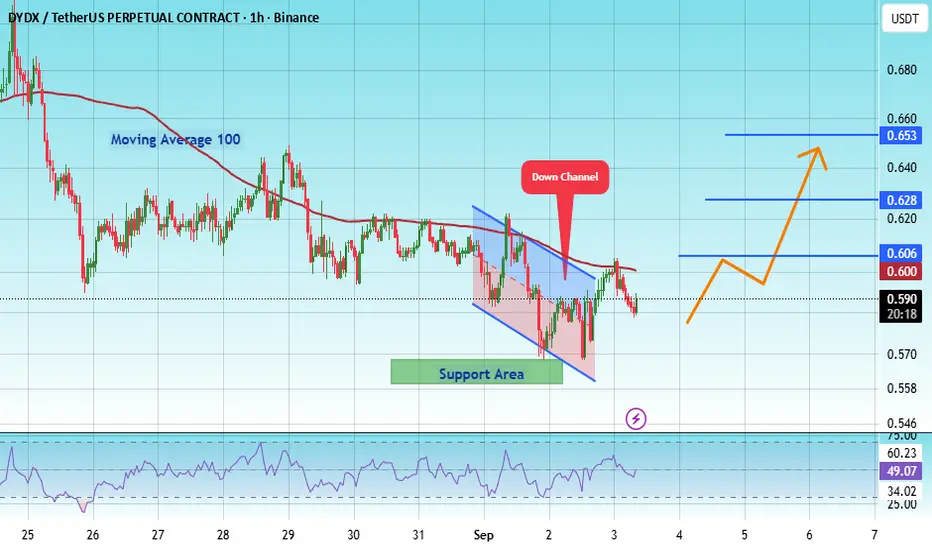
#DYDX/USDT Breakout from Falling Wedge | #DYDX
The price is moving within a descending channel on the 1-hour frame, adhering well to it, and is heading for a strong breakout and retest.
We have a bearish trend on the RSI indicator that is about to be broken and retested, which supports the upward breakout.
There is a major support area in green at 0.563, which represents a strong support point.
For inquiries, please leave a comment.
We are in a consolidation trend above the 100 moving average.
Entry price: 0.588
First target: 0.600
Second target: 0.628
Third target: 0.653
Don't forget a simple matter: capital management.
When you reach the first target, save some money and then change your stop-loss order to an entry order.
For inquiries, please leave a comment.
Thank you.
#DYDX/USDT#DYDX
The price is moving within an ascending channel on the 1-hour frame, adhering well to it, and is on track to break it strongly upwards and retest it.
We have support from the lower boundary of the ascending channel, at 0.612.
We have a downtrend on the RSI indicator that is about to break and retest, supporting the upside.
There is a major support area in green at 0.606, which represents a strong basis for the upside.
Don't forget a simple thing: ease and capital.
When you reach the first target, save some money and then change your stop-loss order to an entry order.
For inquiries, please leave a comment.
We have a trend to hold above the 100 Moving Average.
Entry price: 0.656.
First target: 0.670.
Second target: 0.690.
Third target: 0.717.
Don't forget a simple thing: ease and capital.
When you reach the first target, save some money and then change your stop-loss order to an entry order.
For inquiries, please leave a comment.
Thank you.

#DyDx Superb opportunity#DYDX
The price is moving within a descending channel on the 1-hour frame, adhering well to it, and is on its way to breaking it strongly upwards and retesting it.
We have a bounce from the lower boundary of the descending channel. This support is at 0.470.
We have a downtrend on the RSI indicator that is about to be broken and retested, supporting the upside.
There is a major support area in green at 0.445, which represents a strong basis for the upside.
Don't forget a simple thing: ease and capital.
When you reach the first target, save some money and then change your stop-loss order to an entry order.
For inquiries, please leave a comment.
We have a trend to hold above the 100 Moving Average.
Entry price: 0.500.
First target: 0.522.
Second target: 0.537.
Third target: 0.559.
Don't forget a simple thing: ease and capital.
When you reach your first target, save some money and then change your stop-loss order to an entry order.
For inquiries, please leave a comment.
Thank you.


#DYDX/USDT#DYDX
The price is moving within a descending channel on the 1-hour frame, adhering well to it, and is heading towards a strong breakout and retest.
We are experiencing a rebound from the lower boundary of the descending channel. This support is at 0.566
We are experiencing a downtrend on the RSI indicator, which is about to break and retest, supporting the upward trend.
We are heading towards stability above the 100 moving average.
Entry price: 0.575
First target: 0.584
Second target: 0.592
Third target: 0.602

DYDXUSDT 1D AnalysisDYDX ~ 1D Analysis
#DYDX Buy gradually from here with a short term target of at least 15%+.

#DYDX#DYDX
The price is moving within a descending channel on the 1-hour frame, adhering well to it, and is heading for a strong breakout and retest.
We are seeing a bounce from the lower boundary of the descending channel, which is support at 0.
We have a downtrend on the RSI indicator that is about to break and retest, supporting the upside.
We are looking for stability above the 100 moving average.
Entry price: 0.706
First target: 0.741
Second target: 0.766
Third target: 0.800

DYDXUSDT 1DDYDX ~ 1D Analysis
#DYDX If this is valid. This will be a double bottom. Buy gradually from here with a short -term target of at least 15%+.

DYDXUSDT – Key Resistance Zones Marked!I’ve identified blue boxes as critical resistance areas—these are the levels where price could face heavy selling pressure. But remember, we don’t short blindly—we wait for confirmations.
📊 How I’m Trading This:
✅ Step 1: Watch for CDV confirmation is volume decreasing while price climbs?
✅ Step 2: Look for LTF breakouts downward a clean market structure shift signals entry.
✅ Step 3: If resistance holds + volume supports = I take the trade. If not, I step aside.
💡 Why This Matters:
Most traders short too early and get wrecked. I wait for clear signs of rejection before entering. That’s the difference between guessing and executing.
🔥 Final Thought:
If price suddenly breaks upwards and holds, I will not insist on a short. But if we see rejection + a retest? Then it’s go time. 🚀
📈 Follow for precision trades—because smart traders wait for the perfect moment. 🔥
A tiny part of my runners:
🎯 ZENUSDT.P: Patience & Profitability | %230 Reaction from the Sniper Entry
🐶 DOGEUSDT.P: Next Move
🎨 RENDERUSDT.P: Opportunity of the Month
💎 ETHUSDT.P: Where to Retrace
🟢 BNBUSDT.P: Potential Surge
📊 BTC Dominance: Reaction Zone
🌊 WAVESUSDT.P: Demand Zone Potential
🟣 UNIUSDT.P: Long-Term Trade
🔵 XRPUSDT.P: Entry Zones
🔗 LINKUSDT.P: Follow The River
📈 BTCUSDT.P: Two Key Demand Zones
🟩 POLUSDT: Bullish Momentum
🌟 PENDLEUSDT.P: Where Opportunity Meets Precision
🔥 BTCUSDT.P: Liquidation of Highly Leveraged Longs
🌊 SOLUSDT.P: SOL's Dip - Your Opportunity
🐸 1000PEPEUSDT.P: Prime Bounce Zone Unlocked
🚀 ETHUSDT.P: Set to Explode - Don't Miss This Game Changer
🤖 IQUSDT: Smart Plan
⚡️ PONDUSDT: A Trade Not Taken Is Better Than a Losing One
💼 STMXUSDT: 2 Buying Areas
🐢 TURBOUSDT: Buy Zones and Buyer Presence
🌍 ICPUSDT.P: Massive Upside Potential | Check the Trade Update For Seeing Results
🟠 IDEXUSDT: Spot Buy Area | %26 Profit if You Trade with MSB
📌 USUALUSDT: Buyers Are Active + %70 Profit in Total
🌟 FORTHUSDT: Sniper Entry +%26 Reaction
🐳 QKCUSDT: Sniper Entry +%57 Reaction
📊 BTC.D: Retest of Key Area Highly Likely
📊 XNOUSDT %80 Reaction with a Simple Blue Box!
📊 ORCAUSDT %29 Reaction with a Simple Blue Box!
I stopped adding to the list because it's kinda tiring to add 5-10 charts in every move but you can check my profile and see that it goes on..

#DYDX/USDT#DYDX
The price is moving in a descending channel on the 1-hour frame and is adhering to it well and is heading to break it strongly upwards and retest it
We have a bounce from the lower limit of the descending channel, this support is at a price of 0.760
We have a downtrend on the RSI indicator that is about to be broken and retested, which supports the rise
We have a trend to stabilize above the moving average 100
Entry price 0.770
First target 0.800
Second target 0.820
Third target .842

#DYDX/USDT#DYDX
The price is moving within a descending channel on the 1-hour frame, adhering well to it, and is on its way to breaking it strongly upwards and retesting it.
We are seeing a rebound from the lower boundary of the descending channel, which is support at 0.5050.
We have a downtrend on the RSI indicator that is about to break and retest, supporting the upward trend.
We are looking for stability above the 100 moving average.
Entry price: 0.7529
First target: 0.6467
Second target: 0.6932
Third target: 0.7529

DYDXUSDT 1DDYDX ~ 1D Analysis
#DYDX High risk trading, buy after successfully penetrating this resistant line with a short -term target of at least 10%+.

DYDXUSDT 1WDYDX ~ 1W Analysis
#DYDX In this time frame 1W the lowest support for now. Buy from here if you still have a Conviction on this coin with a minimum target of 20%++

DYDX correction to 5.20$BINANCE:DYDXUSDT
Dydx now underrated. Where ill start buy Dydx again? Where ill take a profit on local correction? And why Dydx can pump to 5.20$?
✅Before we start to discuss, I would be glad if you share your opinion on this post's comment section and hit the like button if you enjoyed it.
Thank you.
Possible Targets and explanation idea
➡️Fib since drop in April.
➡️Perfect call to sell by "Trade On" indicator
➡️Accumulation phase between -0.18 and -0.618 levels
➡️Forming lower low in June and took liquidity. Correction to drop can be at least to 0.5 level by fib 5.20$
➡️2 signals Strong Buy in May and June
➡️Rejected at "Take profit" line. If we capitulate one more time we can drop to 1.05 (now its a "Buy line")
Hope you enjoyed the content I created, You can support with your likes and comments this idea so more people can watch!
✅Disclaimer: Please be aware of the risks involved in trading. This idea was made for educational purposes only not for financial Investment Purposes.
* Look at my ideas about interesting altcoins in the related section down below ↓
* For more ideas please hit "Like" and "Follow"!

DYDXUSDT 1WDYDX ~ 1W
#DYDX If you still have Conviction on this coin,. This support block would be a very good buying place for now,. Buy from here with a minimum target of 20%++

#DYDX/USDT Ready to launch upwards#DYDX
The price is moving in a descending channel on the 1-hour frame and sticking to it well
We have a bounce from the lower limit of the descending channel, this support is at a price of 1.37
We have a downtrend on the RSI indicator that is about to be broken, which supports the rise
We have a trend to stabilize above the moving average 100
Entry price 1.46
First target 1.57
Second target 1.72
Third target 1.89

DYDXUSDT 1WdYdX Update ~ 1W
#dYdX At 1W Time Frame, #dYdX Again, it was rejected from this resistance line. The best way for now. Buy gradually after breaking this resistance line with a Full Candel,. Or you can place a buy on this support block..
these two scenarios with a minimum target of 20%+

#DYDX/USDT#DYDX
The price is moving in a downward channel on the 4 -hour frame upwards and is expected to continue
We have a trend to stabilize above the moving average 100 again
We have a downward trend on the RSI indicator that supports the rise by breaking it upwards
We have a support area at the lower limit of the channel at a price of 0.0970
Entry price 1.06
First target 1.15
Second target 1.26
Third target 1.35
