#DYM/USDT — Last Line of Defense: Reversal Incoming or Breakdo#DYM
The price is moving in a descending channel on the 1-hour timeframe. It has reached the lower boundary and is heading towards breaking above it, with a retest of the upper boundary expected.
We have a downtrend on the RSI indicator, which has reached near the lower boundary, and an upward rebound is expected.
There is a key support zone in green at 0.06560. The price has bounced from this level multiple times and is expected to bounce again.
We have a trend towards consolidation above the 100-period moving average, as we are moving close to it, which supports the upward movement.
Entry price: 0.06633
First target: 0.06746
Second target: 0.06860
Third target: 0.07007
Don't forget a simple principle: money management.
Place your stop-loss order below the support zone in green.
For any questions, please leave a comment.
Thank you.
DYM

#DYM/USDT : BUY LOW
#DYM
The price is moving in a descending channel on the 1-hour timeframe. It has reached the lower boundary and is heading towards breaking above it, with a retest of the upper boundary expected.
We have a downtrend on the RSI indicator, which has reached near the lower boundary, and an upward rebound is expected.
There is a key support zone in green at 0.07430. The price has bounced from this level multiple times and is expected to bounce again.
We have a trend towards stability above the 100-period moving average, as we are moving close to it, which supports the upward movement.
Entry price: 0.07600
First target: 0.07726
Second target: 0.07915
Third target: 0.08157
Don't forget a simple principle: money management.
Place your stop-loss below the support zone in green.
For any questions, please leave a comment.
Thank you.

DYM Sell/Short Setup (30M)Price has reacted to a strong supply zone above. A breakable trendline has formed below price, and a liquidity pool above has been swept.
Based on this setup, price can now move toward at least the minimum target marked on the chart.
Take partial profits at the first target, then move the stop-loss to breakeven.
Do not enter the position without capital management and stop setting
Comment if you have any questions
thank you

#DYM/USDT : BUY LOW#DYM
The price is moving in a descending channel on the 1-hour timeframe. It has reached the lower boundary and is heading towards breaking above it, with a retest of the upper boundary expected.
We have a downtrend on the RSI indicator, which has reached near the lower boundary, and an upward rebound is expected.
There is a key support zone in green at 0.07600. The price has bounced from this level multiple times and is expected to bounce again.
We have a trend towards consolidation above the 100-period moving average, as we are moving close to it, which supports the upward movement.
Entry price: 0.07680
First target: 0.07834
Second target: 0.08000
Third target: 0.08220
Don't forget a simple principle: money management.
Place your stop-loss below the support zone in green.
For any questions, please leave a comment.
Thank you.

#DYM/USDT : BUY LOW#DYM
The price is moving in a descending channel on the 1-hour timeframe. It has reached the lower boundary and is heading towards breaking above it, with a retest of the upper boundary expected.
We have a downtrend on the RSI indicator, which has reached near the lower boundary, and an upward rebound is expected.
There is a key support zone in green at 0.08300. The price has bounced from this level multiple times and is expected to bounce again.
We have a trend towards consolidation above the 100-period moving average, as we are moving close to it, which supports the upward movement.
Entry price: 0.08411
First target: 0.08788
Second target: 0.09100
Third target: 0.09500
Don't forget a simple principle: money management.
Place your stop-loss order below the support zone in green.
For any questions, please leave a comment.
Thank you.

#DYM/USDT : BUY LOW#DYM
The price is moving in a descending channel on the 1-hour timeframe. It has reached the lower boundary and is heading towards breaking above it, with a retest of the upper boundary expected.
We have a downtrend on the RSI indicator, which has reached near the lower boundary, and an upward rebound is expected.
There is a key support zone in green at 0.08455. The price has bounced from this level multiple times and is expected to bounce again.
We have a trend towards consolidation above the 100-period moving average, as we are moving close to it, which supports the upward movement.
Entry price: 0.08777
First target: 0.08940
Second target: 0.09366
Third target: 0.09860
Don't forget a simple principle: money management.
Place your stop-loss order below the green support zone.
For any questions, please leave a comment.
Thank you.

#DYM/USDT :BUY LOW #DYM
The price is moving within an ascending channel on the 1-hour timeframe and is adhering to it well. It is poised to break out strongly and retest the channel.
We have a downtrend line on the RSI indicator that is about to break and retest, which supports the upward move.
There is a key support zone in green at 0.09715, representing a strong support point.
We have a trend of consolidation above the 100-period moving average.
Entry price: 0.10582
First target: 0.11400
Second target: 0.12528
Third target: 0.13872
Don't forget a simple money management rule:
Place your stop-loss order below the green support zone.
Once you reach the first target, save some money and then change your stop-loss order to an entry order.
For any questions, please leave a comment.
Thank you.

ENSO has found the bottom and is ready for growthIn addition to NTRN, I've hired ENSO today. It differs from NTRN by a significantly lower percentage of tokens in circulation, which will put pressure on the price and the dynamics will probably be smoother. Until October next year, emissions will be slow, exerting little pressure. In the future, I will indicate the target purchase and profit-taking zones for safe scalping in the form of inclined ranges that take into account the issue. At each test of the upper limit of profit taking, there is also an opportunity to work out long-term technical goals, according to ENSO, this is a retest of the range 1.75-2.5. After working out this range, there is a high probability of returning to the purchase zone at the next market drawdown. The main resistance today is the 1.0 level, the opening of a new month above which can lead to active purchases. The second half of the quarter opened above 0.850, which gives a signal for a stable consolidation above 1.0.
I am also considering TURTLE MITO VIC HOOK CHESS BMT with previously high technical goals for a retest of up to 300%. Against the background of the detected manipulation of issue data by binance, I will double-check the target levels for all coins and indicate them in further reviews, including inclined target ranges for reliable scalping, corresponding to further issuance for the coming year at least. I have checked the data for TURTLE ENSO and NTRN, they are reliable for scalping from the current levels.

DYMUSDT Forming Falling WedgeDYM/USDT is forming a well-defined falling wedge pattern, which typically signals a potential bullish reversal. The wedge shows declining momentum on lower highs, while support is holding firm. Volume behavior suggests accumulation — buyers are slowly stepping in as sellers’ strength fades. If DYM breaks above the wedge’s upper boundary with conviction, it could trigger a strong breakout.
On the fundamentals, Dymension is a modular Layer-1 blockchain built to host essentially app-specific blockchains that run on top of the Dymension Hub. Its architecture supports execution, consensus, and data availability in a scalable way using a Delegated Proof-of-Stake (DPoS) network. The native token, DYM, plays several critical roles: it’s used for staking (securing the network), governance (voting on protocol upgrades), and paying fees on the Hub.
Tokenomics are particularly interesting: total supply is capped at 1 billion DYM. Emission is algorithmically adjusted based on how much of DYM is staked — when staking is lower, issuance goes up; when staking is higher, issuance decreases.
There’s also a burn mechanism: a portion of protocol fees is converted back into DYM and burned, helping to counter inflation.
Strategically, a breakout above the wedge, confirmed by volume, is the trigger I would be watching for to go long. An ideal entry might come on a retest of the breakout level if it acts as support. Risk can be managed by placing a stop just below the lower trendline of the wedge. Given how DYM ties into modular blockchain growth, cross-chain infrastructure, and staking demand, the potential upside could be quite attractive — especially if adoption of its RollApps picks up.

#DYM/USDT — Last Line of Defense: Reversal Incoming or Breakdo#DYM
The price is moving within an ascending channel on the 1-hour timeframe and is holding well. It is poised to break out strongly and retest the channel.
We have a downtrend line on the RSI indicator that is about to break and retest, which supports the upward move.
There is a key support zone in green at 0.09000, representing a strong support point.
We have a trend of consolidation above the 100-period moving average.
Entry price: 0.09530
First target: 0.09797
Second target: 0.10110
Third target: 0.10488
Don't forget a simple money management rule:
Place your stop-loss order below the green support zone.
Once you reach the first target, save some money and then change your stop-loss order to an entry order.
For any questions, please leave a comment.
Thank you.

#DYM/USDT — Last Line of Defense: Reversal Incoming or Break#DYM
The price is moving within an ascending channel on the 1-hour timeframe and is adhering to it well. It is poised to break out strongly and retest the channel.
We have a downtrend line on the RSI indicator that is about to break and retest, which supports the upward move.
There is a key support zone in green at 0.07870, representing a strong support point.
We have a trend of consolidation above the 100-period moving average.
Entry price: 0.08100
First target: 0.08338
Second target: 0.08590
Third target: 0.08908
Don't forget a simple money management rule:
Place your stop-loss order below the green support zone.
Once you reach the first target, save some money and then change your stop-loss order to an entry order.
For any questions, please leave a comment.
Thank you.

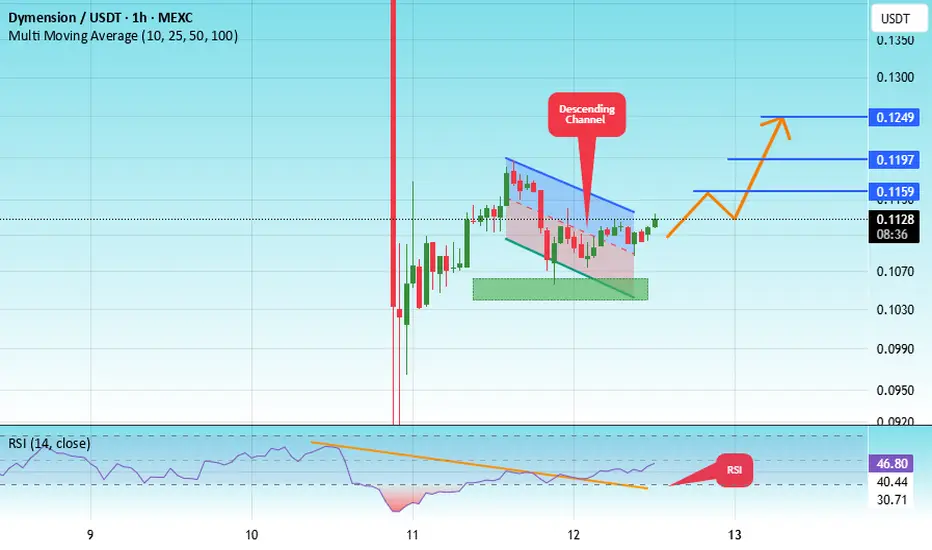
#DYM/USDT can give massive rally but breakout needed#DYM
The price is moving within a descending channel on the 1-hour frame, adhering well to it, and is heading for a strong breakout and retest.
We have a bearish trend on the RSI indicator that is about to be broken and retested, which supports the upward breakout.
There is a major support area in green at 0.1090, which represents a strong support point.
We are heading for consolidation above the 100 moving average.
Entry price: 0.1110
First target: 0.1129
Second target: 0.1158
Third target: 0.1192
Don't forget a simple matter: capital management.
When you reach the first target, save some money and then change your stop-loss order to an entry order.
For inquiries, please leave a comment.
Thank you.

#DYM/USDT — Last Line of Defense: Reversal Incoming or Breakdo#DYM
The price is moving within an ascending channel on the 1-hour timeframe and is holding well. It is poised to break out strongly and retest the channel.
We have a downtrend line on the RSI indicator that is about to break and retest, which supports the upward move.
There is a key support zone in green at 0.07130, representing a strong support point.
We have a trend of consolidation above the 100-period moving average.
Entry price: 0.07657
First target: 0.07911
Second target: 0.08316
Third target: 0.08760
Don't forget a simple money management rule:
Place your stop-loss order below the green support zone.
Once you reach the first target, save some money and then change your stop-loss order to an entry order.
For any questions, please leave a comment.
Thank you.

#DYM/USDT could be another strong contender#DYM
The price is moving in an ascending channel on the 1-hour frame, adhering well to it, and is heading for a strong breakout and retest.
We have a bearish trend on the RSI indicator that is about to be broken and retested, which supports the upward breakout.
There is a major support area in green at 0.1000, which represents a strong support point.
We are heading for consolidation above the 100 moving average.
Entry price: 0.1027
First target: 0.1043
Second target: 0.1062
Third target: 0.1090
Don't forget a simple matter: capital management.
When you reach the first target, save some money and then change your stop-loss order to an entry order.
For inquiries, please leave a comment.
Thank you.

#DYM/USDT Dymension following the Uptrend#DYM
The price is moving within a descending channel on the 1-hour frame, adhering well to it, and is heading for a strong breakout and retest.
We have a bearish trend on the RSI indicator that is about to be broken and retested, which supports the upward breakout.
There is a major support area in green at 0.1160, which represents a strong support point.
We are heading for consolidation above the 100 moving average.
Entry price: 0.1290
First target: 0.1381
Second target: 0.1482
Third target: 0.1617
Don't forget a simple matter: capital management.
When you reach the first target, save some money and then change your stop-loss order to an entry order.
For inquiries, please leave a comment.
Thank you.

#DYM/USDT — Falling Wedge Formation, Breakout or Breakdown?#DYM
The price is moving within a descending channel on the 1-hour frame, adhering well to it, and is heading for a strong breakout and retest.
We have a bearish trend on the RSI indicator that is about to be broken and retested, which supports the upward breakout.
There is a major support area in green at 0.1050, which represents a strong support point.
We are heading for consolidation above the 100 moving average.
Entry price: 0.1127
First target: 0.1160
Second target: 0.1197
Third target: 0.1250
Don't forget a simple matter: capital management.
When you reach the first target, save some money and then change your stop-loss order to an entry order.
For inquiries, please leave a comment.
Thank you.
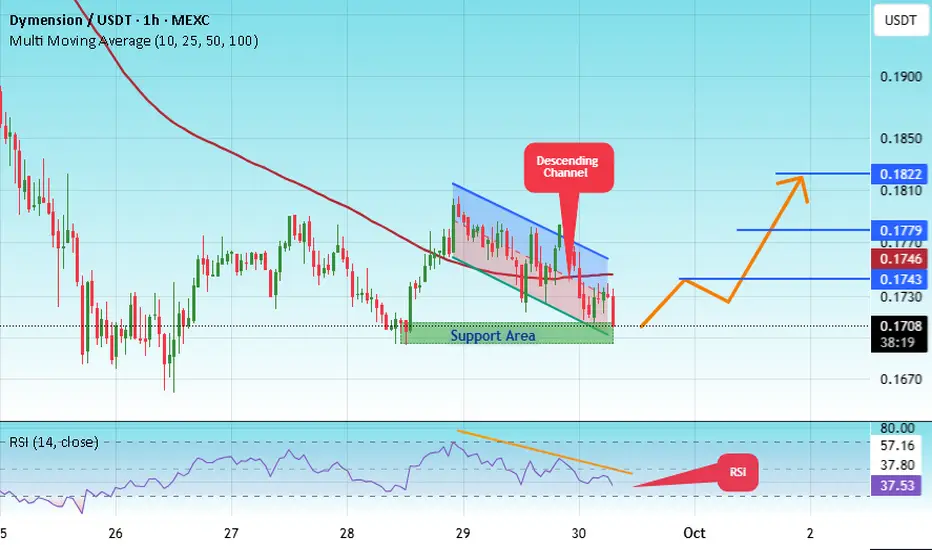
#DYM/USDT — Falling Wedge Formation, Breakout or Breakdown?#DYM
The price is moving within a descending channel on the 1-hour frame, adhering well to it, and is heading for a strong breakout and retest.
We have a bearish trend on the RSI indicator that is about to be broken and retested, which supports the upward breakout.
There is a major support area in green at 0.1690, which represents a strong support point.
We are heading for consolidation above the 100 moving average.
Entry price: 0.1727
First target: 0.1746
Second target: 0.1777
Third target: 0.1818
Don't forget a simple matter: capital management.
When you reach the first target, save some money and then change your stop-loss order to an entry order.
For inquiries, please leave a comment.
Thank you.
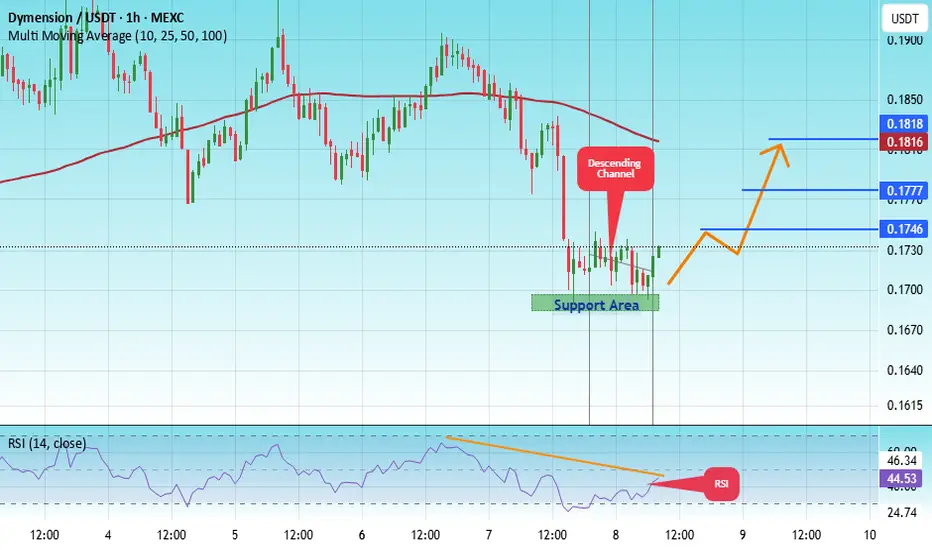
#DYM/USDT — Falling Wedge Formation, Breakout or Breakdown?#DYM
The price is moving within a descending channel on the 1-hour frame, adhering well to it, and is heading for a strong breakout and retest.
We have a bearish trend on the RSI indicator that is about to be broken and retested, which supports the upward breakout.
There is a major support area in green at 0.1700, which represents a strong support point.
We are heading for consolidation above the 100 moving average.
Entry price: 0.1713
First target: 0.1743
Second target: 0.1779
Third target: 0.1822
Don't forget a simple matter: capital management.
When you reach the first target, save some money and then change your stop-loss order to an entry order.
For inquiries, please leave a comment.
Thank you.
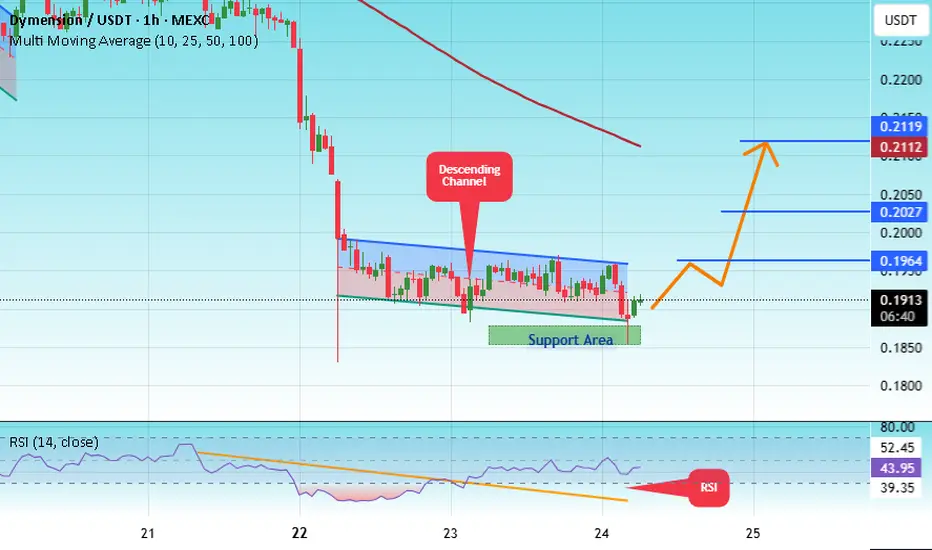
#DYM/USDT — Falling Wedge Formation, Breakout or Breakdown?#DYM
The price is moving within a descending channel on the 1-hour frame, adhering well to it, and is heading for a strong breakout and retest.
We have a bearish trend on the RSI indicator that is about to be broken and retested, which supports the upward breakout.
There is a major support area in green at 0.1853, which represents a strong support point.
We are heading for consolidation above the 100 moving average.
Entry price: 0.1912
First target: 0.1964
Second target: 0.2027
Third target: 0.2112
Don't forget a simple matter: capital management.
When you reach the first target, save some money and then change your stop-loss order to an entry order.
For inquiries, please leave a comment.
Thank you.
DYM (SPOT)BINANCE:DYMUSDT #DYM
Entry range (0.225- 0.242)
SL 4H close below 0.208
( If you think the stop loss is too much you can make stop loss 4H closing below .220)
T1 0.290
T2 0.330
T3 0.370
T4 0.490
02 Extra Target is optional 0.590 & .780
_______________________________________________________
Golden Advices.
********************
* collect the coin slowly in the entry range.
* Please calculate your losses before the entry.
* Do not enter any trade you find it not suitable for you.
* No FOMO - No Rush , it is a long journey.

DYM/USDT — Falling Wedge Formation, Breakout or Breakdown?Technical Analysis (Daily Timeframe):
The price action of DYM/USDT has been forming a falling wedge / descending structure over the past few months. This setup shows sustained downward pressure with a descending resistance line, while the support area around 0.194–0.200 continues to hold firmly.
Typically, this kind of structure ends with a strong move, either a bullish breakout or a bearish breakdown — making the current zone a critical decision point.
---
🔎 Key Levels & Pattern Details
Major Support: 0.194 (multi-tested historical low).
Current Zone: ~0.239, right under the descending resistance line.
First Breakout Zone (confirmation needed): 0.259 – 0.278.
Next Resistance Levels (targets after breakout):
0.335 → initial breakout target.
0.421 → mid-term target.
0.499 – 0.532 → strong supply zone & major resistance.
---
🚀 Bullish Scenario
1. A valid breakout requires a daily close above 0.259–0.278 with strong volume.
2. A successful retest of the breakout zone would provide additional confirmation.
3. Bullish Targets:
Target 1: 0.335.
Target 2: 0.421.
Target 3: 0.499 – 0.532.
4. Invalidation: if price loses 0.194 support.
Note: Falling wedge is often considered a bullish reversal pattern, so probability of upside increases with a confirmed breakout.
---
🐻 Bearish Scenario
1. If the price rejects at the descending resistance, consolidation may continue.
2. A daily close below 0.194 would confirm breakdown, opening room for deeper downside.
3. Potential downside targets: first re-test of 0.194, then further extension to lower levels (likely around 0.150–0.160 based on weekly structure).
4. Stop-loss for short setups can be placed above 0.278.
---
📌 Additional Insights
The wedge has been developing since May 2025 — the longer the consolidation, the more explosive the next move can be.
Watch volume & momentum indicators (RSI/MACD) for breakout validation.
For conservative traders, waiting for a confirmed breakout/breakdown is safer than entering mid-range.
---
📝 Conclusion
DYM/USDT is approaching a major turning point. A confirmed breakout above 0.259–0.278 could open a rally towards 0.335, 0.421, and even 0.532. On the other hand, a breakdown below 0.194 would confirm bearish continuation.
Patience and strict risk management are key, as this structure can deliver a significant move after months of tightening price action.
---
#DYM #DYMUSDT #Crypto #Altcoin #TechnicalAnalysis #PriceAction #FallingWedge #Breakout #BullishScenario #BearishScenario

DYMUSDT UPDATE#DYM
UPDATE
DYM Technical Setup
Pattern: Bullish Falling Wedge Pattern
Current Price: $0.236
Target Price: $0.424
Target % Gain: 90.17%
ASX:DYM is breaking out of a falling wedge on the 1D timeframe. Current price is $0.236 with a target near $0.424, showing over 90% potential upside. The breakout confirms bullish momentum with structure favoring continuation. Always use proper risk management.
Time Frame: 1D
Risk Management Tip: Always use proper risk management.

#DYM/USDT Dymension following the Uptrend#DYM
The price is moving within a descending channel on the 1-hour frame and is expected to break and continue upward.
We have a trend to stabilize above the 100 moving average once again.
We have a downtrend on the RSI indicator that supports the upward move with a breakout.
We have a support area at the lower boundary of the channel at 0.2220, acting as strong support from which the price can rebound.
We have a major support area in green that pushed the price upward at 0.2180.
Entry price: 0.2220
First target: 0.2264
Second target: 0.2300
Third target: 0.2356
To manage risk, don't forget stop loss and capital management.
When you reach the first target, save some profits and then change the stop order to an entry order.
For inquiries, please comment.
Thank you.
