DASH / USDT Weak Structure — Breakdown Below $67.76 Can Trigger DASH / USDT is showing clear weakness, and a confirmed breakdown below the key level of $67.76 can open the door for a downside move of around 17% towards $55.57. Wait for a clean breakdown and confirmation before entering, and manage risk carefully.
Dyor

TIA / USDT Holding Support — Bullish Continuation Towards $0.53TIA / USDT remains strong as long as it holds above the $0.4362–$0.4315 support zone. While price stays above this area, the upside target remains $0.4973–$0.5293. A clear breakdown below the support will invalidate this setup, so manage risk wisely and wait for confirmation.

ZEC / USDT Holding Key Support—Bounce Towards $472–$483 PossibleAs long as ZEC / USDT holds above the strong support zone of $313–$290, a bullish bounce towards $472–$483 remains possible. Watch this area closely and wait for clear confirmation before entering, as a breakdown below this support will invalidate the setup. Manage risk wisely.

ASTERUSDT — Descending Trendline Breakout | Long SetupPrice has successfully broken above the descending trendline and is now holding above a key horizontal support, which has flipped into support. This breakout confirms a bullish structure shift.
The marked zone acts as a valid entry area, while the setup remains invalid below 0.6051, which is the clear risk level. As long as price stays above this level, bullish continuation is expected.
The projected move shows a step-by-step bullish push, targeting the 0.6550 liquidity zone, where previous highs are located.
Bias: Bullish
Invalidation: Below 0.6051
Target: 0.6550

BTC Stuck in Range | Liquidity Grabs Ongoing — Patience RequiredBTC is trading below the major resistance zones marked on the chart.
As long as price fails to reclaim and hold above these upper levels, I will not turn bullish.
The structure suggests BTC is stuck in a broad range, where price is repeatedly grabbing liquidity.
During this phase, alts will also continue to grab liquidity on both sides, creating fake breakouts and stop hunts.
This is not the phase to be aggressive — this is the phase to survive.
If we manage risk properly and protect the portfolio here, the next phase will offer much cleaner and higher-probability opportunities.

XMR / USDT Approaching Key Support — 30% Bounce PossibleXMR / USDT is declining aggressively for a healthy retest of a key support zone. If price shows a strong reaction from this level, a clean bounce is expected, with a potential upside move of around 30%. Market conditions remain highly volatile, so proper risk management and confirmation are essential before entry.

CC / USDT Box Consolidation —Key Range About to Decide DirectionCC / USDT is consolidating inside a box after a smooth uptrend. The $0.1441–$0.1406 zone is the key level to watch. A bounce from this area can trigger an upside move to grab liquidity above the range, even without a direct touch of the level. A clear breakdown below this zone would open the door for a smooth downside continuation toward the target.
Manage risk wisely and follow price action for confirmation.

UNI / USDT Waiting for Liquidity Grab — Safer Entry at $5.46UNI / USDT is looking strong at current levels, but for a safer entry we are watching the $5.46 zone to allow liquidity below the higher lows and a fill of the 4H FVG. A clear reaction from this area would offer a much better risk-to-reward setup. Manage risk wisely, as buying at current price does not offer a favorable R:R.

ASTER / USDT Holding Key Support — Bullish Continuation SetupAs long as ASTER / USDT holds above the $0.741–$0.726 support zone, the structure remains strong for a bullish continuation toward $0.8720. Manage risk wisely and keep a close watch on it....Any breakdown below the key zone will invalidate this setup

ORDI / USDT : Short term setupORDI is trading near a key demand zone with potential for a 10–15% upside.
Using a two-entry plan to manage risk, with a possible secondary entry around $3.86–$3.75 if price dips.
Target remains near $4.52 as long as structure holds.
Patience and confirmation are key.
Not financial advice.

FARTCOIN / USDT Daily Close Above Key Zone— Upside Targets AheadFARTCOIN / USDT can maintain its bullish continuation if the next daily candle closes firmly above the $0.2540–$0.2725 zone. A strong hold and positive reaction from this area would open the door for a clean move toward the $0.35–$0.37 range. Wait for confirmation and manage risk carefully before entering.

BEAT / USDT at Key Trendline — Major Move IncomingBEAT / USDT is currently holding a key trendline, making this level very important to watch.
A strong bullish reaction from here can trigger an upside move toward the $3.1241–$3.6164 zone, offering a potential 40–70% rally from the trendline.
However, a clear breakdown below this level could open the door for a sharp 30–40% downside move. Wait for confirmation and manage risk carefully.

BTC Short-Term Bullish Structure | Key Zone Reaction in FocusBitcoin is maintaining a strong bullish structure on the lower timeframes. Price is currently holding above key support, and the overall momentum remains in favor of buyers. A pullback into the lower key demand zone would be healthy. If BTC reacts strongly from this area and holds above support, it will confirm continuation strength and open the path for a bullish expansion toward the 91K level in the short term.

ZEREBRO Reset and Rebound opportunity | Target $0.0382After an unsuccessful breakout, the price is expected to reset and prepare for another strong push. If the price reacts from our entry zone, the target is set at $0.03280.
Follow the setup accordingly and manage risk wisely.

KITE / USDT Bullish Structure — Watching Retest for ContinuationKITE / USDT is holding bullish structure and consolidating above key support. A clean retest of the marked entry zone can offer a good long opportunity, while a direct continuation without retest will remain risky. As long as price stays above the invalidation level, the upside remains intact with targets toward the higher resistance zone. Manage risk wisely and follow price reaction.

LIGHT / USDT remains Bullish above $1.34 - $1.16As long as LIGHT / USDT holds above the marked support zone of $1.34–$1.16, the structure remains bullish. These levels are key to watch, and any breakdown below this zone will invalidate the setup. Manage risk wisely and wait for confirmation.

ZRO Weakness Into 4H FVG — Watching for Reversal Toward $1.50ZRO / USDT is showing weakness and continues to decline toward the 4H FVG zone at $1.24–$1.21. This area will be important to watch for a potential reaction. If price shows strength from this FVG, a reversal toward $1.50 can follow. Manage risk wisely and wait for confirmation.

Giggle at Bottom Support — Spot Buying Zone ActivatedGiggle / USDT has already tapped its bottom zone, and this level looks attractive for spot accumulation. With strong backing from CZ and a clear bottom formation, the risk-to-reward is favourable for a potential upward move. Manage risk wisely and consider buying only in spot.

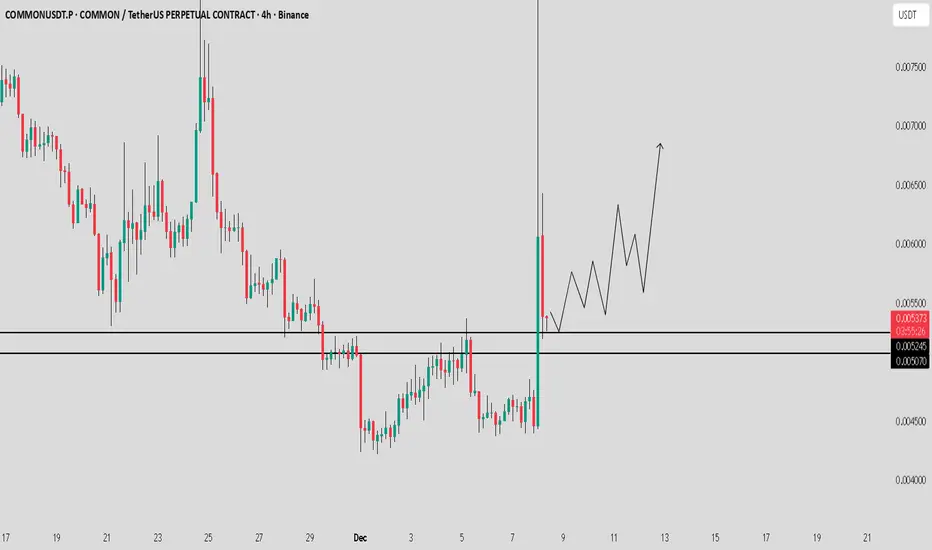
Common / USDT key zone ahead_ Expecting 15-20% upside moveKeep a close watch on this zone. If the price shows a strong reaction here, we could see a solid 15–20% move soon.
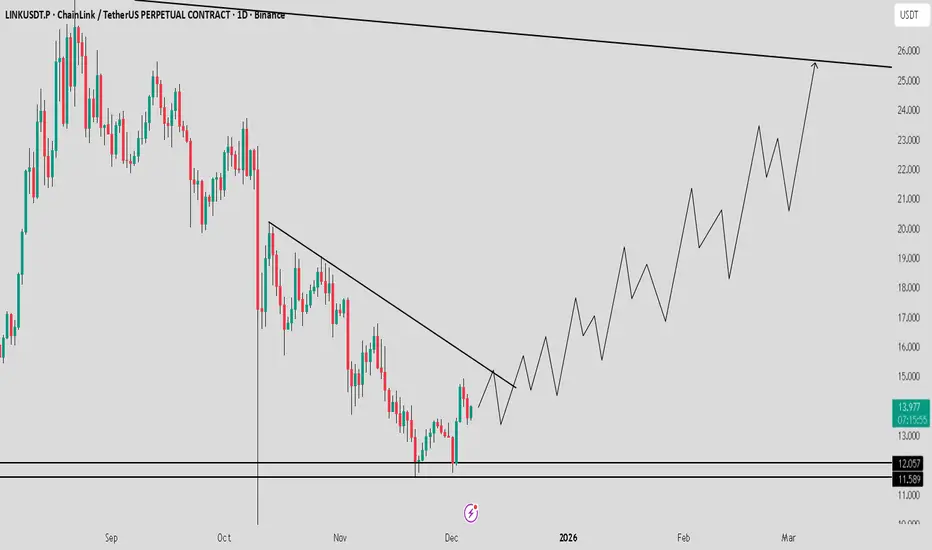
LINK Showing Strong Spot Structure_Double Bottom Point Toward 25If you want to accumulate a strong spot coin, LINK / USDT is one of the best options right now. It has formed a clean double bottom and is showing strong upward momentum. I expect a continuation move toward $25 soon. Manage risk wisely and always follow confirmations.
ORCA Approaching Trendline Test—Watching Move Toward $1.85–$1.90ORCA / USDT is showing strength and moving toward the $1.85–$1.90 zone to test the trendline resistance. Momentum looks solid, but risk management is important. Any breakdown below the marked horizontal levels will invalidate this setup.

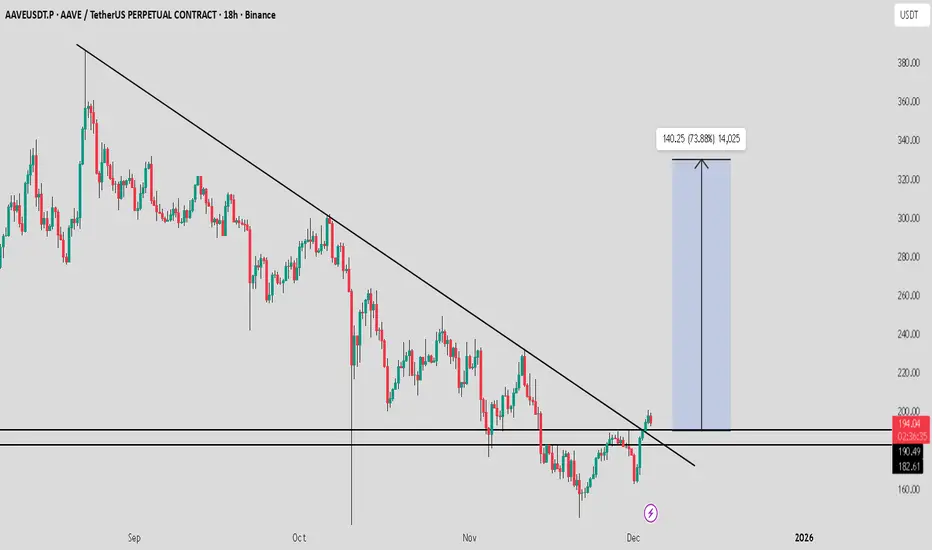
AAVE Holding Strong — Watching for Breakout Reaction Toward $250AAVE / USDT is holding strong above the marked horizontal levels. If price reacts with clear strength from this zone, it could offer a solid opportunity for a move towards $250–$320. Wait for clean confirmation before entering and manage risk wisely.
PENDLE / USDT preparing for next bullish leg up After FVG tapPendle / USDT is looking strong, but I’m expecting price to first tap the 4H FVG zone before continuing its trend towards $3 – $3.5…
A clean reaction from that zone can trigger the next bullish wave, so waiting for confirmation is important here. Momentum is still in favor of buyers, but entries should always be planned with patience.
Manage risk wisely and only enter after a clear confirmation.
