QQQ Will Explode! BUY!
My dear followers,
This is my opinion on the QQQ next move:
The asset is approaching an important pivot point 609.75
Bias - Bullish
Technical Indicators: Supper Trend generates a clear long signal while Pivot Point HL is currently determining the overall Bullish trend of the market.
Goal - 622.40
About Used Indicators:
For more efficient signals, super-trend is used in combination with other indicators like Pivot Points.
Disclosure: I am part of Trade Nation's Influencer program and receive a monthly fee for using their TradingView charts in my analysis.
———————————
WISH YOU ALL LUCK
E-signal

APPLE The Target Is UP! BUY!
My dear friends,
My technical analysis for APPLE is below:
The market is trading on 268.53 pivot level.
Bias - Bullish
Technical Indicators: Both Super Trend & Pivot HL indicate a highly probable Bullish continuation.
Target - 271.24
Recommended Stop Loss - 266.96
About Used Indicators:
A pivot point is a technical analysis indicator, or calculations, used to determine the overall trend of the market over different time frames.
Disclosure: I am part of Trade Nation's Influencer program and receive a monthly fee for using their TradingView charts in my analysis.
———————————
WISH YOU ALL LUCK

ETHUSDT.P - November 9, 2025ETHUSDT.P is showing potential for a short-term bearish reversal after testing resistance near the $3,400 zone. A sell short limit is placed at $3,348, targeting a move down toward the $3,307 partial profit zone and the $3,214 profit level. A sustained move above the $3,416–$3,432 stop level would invalidate this short setup and signal renewed bullish momentum.
Risk Assessment: Moderate to High — Structure leans bearish, but confirmation requires a breakdown below $3,348 and continued weakness toward $3,300.
Note: Do not trade if the price touches the invalidation level first before the sell short limit order.

TESLA Sellers In Panic! BUY!
My dear subscribers,
My technical analysis for TESLA is below:
The price is coiling around a solid key level - 429.39
Bias - Bullish
Technical Indicators: Pivot Points Low anticipates a potential price reversal.
Super trend shows a clear buy, giving a perfect indicators' convergence.
Goal - 446.44
About Used Indicators:
By the very nature of the supertrend indicator, it offers firm support and resistance levels for traders to enter and exit trades. Additionally, it also provides signals for setting stop losses
Disclosure: I am part of Trade Nation's Influencer program and receive a monthly fee for using their TradingView charts in my analysis.
———————————
WISH YOU ALL LUCK

EURCHF: Long Trading Opportunity
EURCHF
- Classic bullish formation
- Our team expects pullback
SUGGESTED TRADE:
Swing Trade
Long EURCHF
Entry - 0.9315
Sl - 0.9312
Tp - 0.9321
Our Risk - 1%
Start protection of your profits from lower levels
Disclosure: I am part of Trade Nation's Influencer program and receive a monthly fee for using their TradingView charts in my analysis.
❤️ Please, support our work with like & comment! ❤️

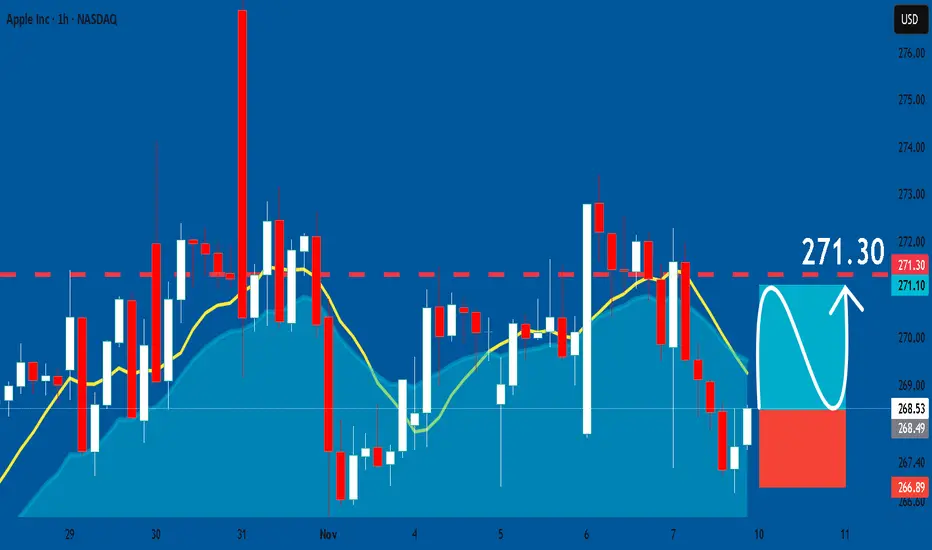
APPLE: Long Trade Explained
APPLE
- Classic bullish pattern
- Our team expects retracement
SUGGESTED TRADE:
Swing Trade
Buy APPLE
Entry - 268.53
Stop - 266.89
Take - 271.30
Our Risk - 1%
Start protection of your profits from lower levels
Disclosure: I am part of Trade Nation's Influencer program and receive a monthly fee for using their TradingView charts in my analysis.
❤️ Please, support
EURCAD Sellers In Panic! BUY!
My dear subscribers,
EURCAD looks like it will make a good move, and here are the details:
The market is trading on 1.6246 pivot level.
Bias - Bullish
My Stop Loss - 1.6231
Technical Indicators: Both Super Trend & Pivot HL indicate a highly probable Bullish continuation.
Target - 1.6272
About Used Indicators:
The average true range (ATR) plays an important role in 'Supertrend' as the indicator uses ATR to calculate its value. The ATR indicator signals the degree of price volatility.
Disclosure: I am part of Trade Nation's Influencer program and receive a monthly fee for using their TradingView charts in my analysis.
———————————
WISH YOU ALL LUCK

SPY Massive Long! BUY!
My dear followers,
I analysed this chart on SPY and concluded the following:
The market is trading on 670.89 pivot level.
Bias - Bullish
Technical Indicators: Both Super Trend & Pivot HL indicate a highly probable Bullish continuation.
Target - 678.65
About Used Indicators:
A super-trend indicator is plotted on either above or below the closing price to signal a buy or sell. The indicator changes color, based on whether or not you should be buying. If the super-trend indicator moves below the closing price, the indicator turns green, and it signals an entry point or points to buy.
Disclosure: I am part of Trade Nation's Influencer program and receive a monthly fee for using their TradingView charts in my analysis.
———————————
WISH YOU ALL LUCK

BTCUSD What Next? SELL!
My dear followers,
This is my opinion on the BTCUSD next move:
The asset is approaching an important pivot point 10376
Bias - Bearish
Safe Stop Loss - 10456
Technical Indicators: Supper Trend generates a clear short signal while Pivot Point HL is currently determining the overall Bearish trend of the market.
Goal - 10230
About Used Indicators:
For more efficient signals, super-trend is used in combination with other indicators like Pivot Points.
Disclosure: I am part of Trade Nation's Influencer program and receive a monthly fee for using their TradingView charts in my analysis.
———————————
WISH YOU ALL LUCK

BTCUSDT.P - November 8, 2025BTCUSDT.P is showing potential for a short-term bearish reversal after approaching resistance near the $104,000 zone. A sell short limit is placed at $104,070, targeting a move down toward the $102,088 partial profit zone and the $100,475 profit level.
A sustained move above the $105,875 stop level would invalidate this short setup and indicate renewed upside momentum.
Risk Assessment: Moderate to High — structure leans bearish, but confirmation requires rejection from the $104,000 resistance zone and continuation below $102,000.

TRXUSDT.P - November 4, 2025TRXUSDT.P is currently in a corrective phase after a sustained bearish move, with price consolidating around the $0.2840 level. The structure shows a potential for bullish continuation if the market successfully holds above the $0.2813–$0.2807 support zone. Two buy limit areas are identified at $0.2813 and $0.2865, suggesting layered entries for a potential upside move toward the $0.2922–$0.2940 resistance zone.
A confirmed break above $0.2865 would strengthen the bullish outlook and signal a shift in short-term momentum. Conversely, a decisive breakdown below $0.2759 would invalidate the bullish setup and reopen the path toward deeper downside targets near $0.2740.
Risk Assessment: Moderate-to-high risk — price remains within a fragile consolidation phase after a bearish trend. While early signs of accumulation are visible, failure to defend the $0.2800 area could trigger renewed selling pressure before any sustainable reversal develops.

Long SolanaTrading Fam,
Received a buy signal from my indicator on Solana the other day. Inside a nice liquidity block, above the 200/350 SMA, and inside a bullish triangle. I'll easily take this trade all day. But with the crypto market continually disappointing, I am not going to risk more than an 8% loss here. Shooting for a target of around 32% profits brings my rrr to a 1:4. Best of luck!
✌️Stew

CADJPY: Short Trading Opportunity
CADJPY
- Classic bearish formation
- Our team expects fall
SUGGESTED TRADE:
Swing Trade
Sell CADJPY
Entry Level - 108.83
Sl - 108.98
Tp - 108.55
Our Risk - 1%
Start protection of your profits from lower levels
Disclosure: I am part of Trade Nation's Influencer program and receive a monthly fee for using their TradingView charts in my analysis.
❤️ Please, support our work with like & comment! ❤️

EURJPY My Opinion! SELL!
My dear friends,
EURJPY looks like it will make a good move, and here are the details:
The market is trading on 177.35pivot level.
Bias - Bearish
Technical Indicators: Supper Trend generates a clear short signal while Pivot Point HL is currently determining the overall Bearish trend of the market.
Goal - 176.90
About Used Indicators:
Pivot points are a great way to identify areas of support and resistance, but they work best when combined with other kinds of technical analysis
Disclosure: I am part of Trade Nation's Influencer program and receive a monthly fee for using their TradingView charts in my analysis.
———————————
WISH YOU ALL LUCK

USDCAD Technical Analysis! BUY!
My dear friends,
Please, find my technical outlook for USDCAD below:
The instrument tests an important psychological level 1.4071
Bias - Bullish
Technical Indicators: Supper Trend gives a precise Bullish signal, while Pivot Point HL predicts price changes and potential reversals in the market.
Target - 1.4090
Recommended Stop Loss - 1.4054
About Used Indicators:
Super-trend indicator is more useful in trending markets where there are clear uptrends and downtrends in price.
Disclosure: I am part of Trade Nation's Influencer program and receive a monthly fee for using their TradingView charts in my analysis.
———————————
WISH YOU ALL LUCK

GOLD: Great Trading Opportunity
GOLD
- Classic bearish formation
- Our team expects pullback
SUGGESTED TRADE:
Swing Trade
Short GOLD
Entry - 4002.6
Sl - 4009.3
Tp - 3990.4
Our Risk - 1%
Start protection of your profits from lower levels
Disclosure: I am part of Trade Nation's Influencer program and receive a monthly fee for using their TradingView charts in my analysis.
❤️ Please, support our work with like & comment! ❤️

ETHUSDT.P - November 7, 2025ETHUSDT.P is showing continued signs of short-term bearish momentum after rejecting from the $3,370 resistance zone. A short position is positioned around $3,280, targeting a move toward the $3,179 profit level for a quick scalp.

EURUSD On The Rise! BUY!
My dear subscribers,
EURUSD looks like it will make a good move, and here are the details:
The market is trading on 1.1482 pivot level.
Bias - Bullish
Technical Indicators: Both Super Trend & Pivot HL indicate a highly probable Bullish continuation.
Target - 1.1530
About Used Indicators:
The average true range (ATR) plays an important role in 'Supertrend' as the indicator uses ATR to calculate its value. The ATR indicator signals the degree of price volatility.
Disclosure: I am part of Trade Nation's Influencer program and receive a monthly fee for using their TradingView charts in my analysis.
———————————
WISH YOU ALL LUCK

AUDCAD: Long Trade with Entry/SL/TP
AUDCAD
- Classic bullish formation
- Our team expects pullback
SUGGESTED TRADE:
Swing Trade
Long AUDCAD
Entry - 0.9144
Sl - 0.9133
Tp - 0.9167
Our Risk - 1%
Start protection of your profits from lower levels
Disclosure: I am part of Trade Nation's Influencer program and receive a monthly fee for using their TradingView charts in my analysis.
❤️ Please, support our work with like & comment! ❤️

NZDJPY Expected Growth! BUY!
My dear followers,
I analysed this chart on NZDJPY and concluded the following:
The market is trading on 86.179 pivot level.
Bias - Bullish
Technical Indicators: Both Super Trend & Pivot HL indicate a highly probable Bullish continuation.
Target - 86.570
Safe Stop Loss - 85.959
About Used Indicators:
A super-trend indicator is plotted on either above or below the closing price to signal a buy or sell. The indicator changes color, based on whether or not you should be buying. If the super-trend indicator moves below the closing price, the indicator turns green, and it signals an entry point or points to buy.
Disclosure: I am part of Trade Nation's Influencer program and receive a monthly fee for using their TradingView charts in my analysis.
———————————
WISH YOU ALL LUCK

ETHUSDT.P - November 6, 2025ETHUSDT has broken below its ascending trendline, signaling potential bearish momentum. The setup suggests a short bias with a profit target near $3,275 and a stop level around $3,485, aligning with a risk-reward structure favoring downside continuation.

EURUSD: Short Trade Explained
EURUSD
- Classic bearish pattern
- Our team expects retracement
SUGGESTED TRADE:
Swing Trade
Sell EURUSD
Entry - 1.1525
Stop - 1.1535
Take - 1.1503
Our Risk - 1%
Start protection of your profits from lower levels
Disclosure: I am part of Trade Nation's Influencer program and receive a monthly fee for using their TradingView charts in my analysis.
❤️ Please, support our work with like & comment! ❤️

EURAUD The Target Is DOWN! SELL!
My dear friends,
My technical analysis for EURAUD is below:
The market is trading on 1.7773 pivot level.
Bias - Bearish
Technical Indicators: Both Super Trend & Pivot HL indicate a highly probable Bearish continuation.
Target - 1.7703
About Used Indicators:
A pivot point is a technical analysis indicator, or calculations, used to determine the overall trend of the market over different time frames.
Disclosure: I am part of Trade Nation's Influencer program and receive a monthly fee for using their TradingView charts in my analysis.
———————————
WISH YOU ALL LUCK
