NFP on Good Friday | What to expect?"What to expect from NFP on Good Friday?
What is Good Friday? Good Friday is a federal holiday, which means that US equity and bond markets are closed. However, the futures market, as well as the forex market, is open. Good Friday is a rare occurrence, but it has happened in the past. The last three times it occurred were in 2021, 2015, and 2012.
Let's take a look at what happened to the price action on these past data releases when NFP came out.
EURUSD moved in 2021, 2015, and 2012.
USDJPY moved in 2021, 2015, and 2012.
This tells us that the move is comparatively smaller than on normal days' releases, and it has a lot to do with FED policy action. This time, the FED has given a hint of not increasing interest rates anymore.
The best decision here is to stand aside because the market is less volatile and may remain in a range for today.
Let us know what do you think of the idea
Editorspick

BITCOIN | MAJOR TREND SHIFTBITCOIN is showing some major moves since the start of this year 2023. Is this the year of BTC where we witness new highs in making??
On daily tf, the major trend indicator 100DEMA indicates the shift in trend when #BTC breaks above it on 12th Jan.
However some key levels for btc is yet to break. $25500 is the first hurdle for BTC to continue its upward journey. We need a remarkable closing with good volume above this level to consider an uptrend.
If BTC successfuly manage to break above the said level then we can witness 32500$ and 37000$ very quick without major correction.
Let me know in comments what do you think of the idea

GOLD | Interesting facts about GoldOANDA:XAUUSD
1.Gold is a 'noble' metal, meaning that it does not rust or lose its shine. Other noble metals include ruthenium, rhodium, palladium, silver, osmium, iridium, platinum, mercury, rhenium and copper.
2.Gold is the only yellow metal. All other metals darken or turn a yellowish colour after they have oxidised or reacted with other chemicals.
3.Gold is one of the heaviest and densest of all metals in the Periodic Chart; a cubic foot would weigh more than half a ton.
4.Pure gold will melt at 1064.43° and boils at 2856.1°. Even at normal temperatures gold is extremely soft. One gram of gold can be flattened down to a square meter sheet, which is so thin that light passes through, and because of this it has been used as a protective film on visors in space suits
5.Odourless and tasteless, gold is not toxic - and flakes may be eaten in foods or drinks.
6.Gold is far rarer than diamonds but is only the 58th rarest earth element.
7.It is estimated about 160,000 tons of gold have been mined throughout history.
8.In 2018, China was the world leader in gold mining production. Second was Australia, Russia third, US fourth and Canada fifth.
9.The largest gold nugget is the 'Welcome Stranger' mined in Australia in 1869, weighing in at a colossal 173 pounds (that is nearly 78.5 kilos).
10.The first gold coins were produced in Lydia between 700 - 650 BC. They were made from electrum, which is a naturally occurring alloy of gold.
11.The Swiss Franc was the last remaining country to peg its currency to a value in gold. It became a fiat currency in 1999.
12.The Perth Mint in Western Australia cast the largest ever coin - weighing one tonne and measuring 80 centimetres (31.4 inches) in diameter.
13.New York’s US Federal Reserve Bank is reported to hold 25% of the world's gold reserves.
14.Gold is frequently used as a safe haven asset in times of economic turmoil or geopolitical uncertainty.
15.Gold has historically had a weak correlation to movements in the financial markets and is frequently used as a hedge against inflation.

Trading Psychology: How Does Your Mind Matter In Making Money?Hello traders, today we will talk about Trading Psychology
The most famous book on trading psychology, “Tradingpsychologie” aptly remarks, ‘The greatest enemy of the trader is fear. He who is afraid loses!’.
As a trader, you must have gone through emotions such as fear, greed, regret, hope, overconfidence, doubt, nervousness etc.
While every trader goes through this emotional rollercoaster, a successful trader knows that it’s never a good idea to let your emotions influence your investment decisions.
Not letting your emotions affect your trading decisions is the real meaning of trading psychology!
In this article, we will educate you on the meaning of trading psychology. We will also reveal trading tips and tricks to mentally prepare you to trade with confidence!
So, let’s begin!
What is Trading Psychology?
Trading psychology or investor psychology refers to the trader’s emotional and mental state which dictates their trading actions.
Some of these emotions like hope, confidence are helpful and should be embraced. But emotions like fear and greed must be contained. Another emotion that is very common in financial markets is the fear of missing out or FOMO.
It is essential to understand and develop a sharp mindset along with knowledge and experience to become a successful trader.
Let us take a look at the various psychological factors that affect a trader’s mindset and some pro-tips to deal with them.
1. Fear
Fear is a natural reaction that we sense when something is at risk. While trading, risks could occur in many forms –
Some bad news about the stocks or the market
Placing a trade and realising it’s not going the way you had hoped
Fear of loss of capital
Traders generally overreact and tend to liquidate their holdings because of fear. A strong trading psychology is when traders do not let fear dictate their buy/sell strategy.
What should you do?
Every trader must first understand what they are afraid of and why? Reflect on these issues ahead of time so you can quickly identify the problem and find a solution. Your focus should be to not let the fear of loss refrain you from making profit.
2. Greed
Greed enters when you desire excess profits. Rome was not built in a day and neither will your stock market fortune. If you find yourself on a winning streak, then book your profits and move on. Majority of the time, your greed will turn a winning streak into a disaster!
What should you do?
To combat greed, you should have a predefined profit booking level. Even before you enter a trade, define your stop-loss and book-profit levels to avoid being swayed by greed.
A sound trading psychology is when you are content with your profits and do not chase irrational profits.
3. Regret
Regret in trading comes in two ways.
A trader could regret placing a trade that didn’t work or
Regret not placing a trade that could have worked.
A trading psychology based on regret can be dangerous for a trader as it may result in placing wrong trades.
What should you do?
The best way to avoid a regretful trading psychology is to accept that you can’t have all the opportunities in the market. The equation in the stock markets is very simple – You win some; you lose some.
Once you accept this rule, your trading psychology will automatically change for the better.
4. Hope
Investors often think that trading is gambling. It’s because they hope to win all the time and when they don’t, they get dejected.
What should you do?
To become a successful trader, you must have a solid trading psychology which is not dependent on hope. If you keep hoping for things to change in the near future, you’re putting your entire investment at risk.
Don’t let hope keep you invested in a loss making trade. Be practical, and book your losses at the correct time.
To attain and maintain success as a trader, you have to work hard to cultivate a mindset! Let’s see how trading psychology helps you cultivate a better mindset!
How to Improve Your Trading Psychology
1. Get Yourself in the Right Mindset
Before you even start your trading day, simply remind yourself that markets are never constant. You will have some good days and some bad days, but the bad days too shall pass.
Another effective strategy to improve your trading psychology is to give yourself time. You are not going to make a fortune on your very first trading day. You need to spend time and efforts in creating a rock solid trading strategy which isn’t affected by the market sentiments.
While you cannot completely eliminate emotions from trading, the goal is to reduce the extent of emotions controlling your trading psychology.
2. Have a Great Knowledge Base
One of the best ways to improve your trading psychology is to increase your knowledge and trading skills. Having a strong knowledge base of the stock market is key to defeating negative trading psychology. Remember, knowledge is power!
3. Remind yourself that you are Trading in Real Money
When you’re trading online, it’s easy to forget that the numbers on your screen actually represent real money. There’s nothing wrong in risking your money in hopes of generating returns. But remember to be cautious and make smarter investment decisions.
4. Observe the Habits of Successful Traders
Stock market is unique because it treats each trader differently. When it comes to trading, you should be aware of what your peers are doing, not to copy them but to learn from them.
By observing the positive characteristics of successful traders and inculcating few habits or strategies into your own trading, you can improve your trading strategies manyfolds.
5. Practice! Practice! Practice!
Last but not the least, practice is the best and most reliable way to gain mental strength. It helps you improve your trading psychology over time as you build well practised trading strategies and are well prepared for any ups or downs.
Final Thoughts
Understanding trading psychology and implementing it is a time consuming process. You have to continuously refine your trading psychology over long time periods.
To sum up, remember these three golden principles of trading psychology
Be disciplined
Be flexible
Never stop learning
I would also love to know your charts and views in the comment section.
Thank you

GOLD : How to trade with Rsi IndicatorOANDA:XAUUSD
What Does RSI Mean?
The relative strength index (RSI) measures the price momentum of a stock or other security. The basic idea behind the RSI is to measure how quickly traders are bidding the price of the security up or down. The RSI plots this result on a scale of 0 to 100.
Readings below 30 generally indicate that the stock is oversold, while readings above 70 indicate that it is overbought. Traders will often place this RSI chart below the price chart for the security, so they can compare its recent momentum against its market price.
How do you trade effectively with RSI?
The common levels to pay attention to when trading with the RSI are 70 and 30. An RSI of over 70 is considered overbought. When it below 30 it is considered oversold. Trading based on RSI indicators is often the starting point when considering a trade, and many traders place alerts at the 70 and 30 marks.
KEY TAKEAWAYS
The relative strength index (RSI) is a popular momentum oscillator introduced in 1978.
The RSI provides technical traders with signals about bullish and bearish price momentum, and it is often plotted beneath the graph of an asset’s price.
An asset is usually considered overbought when the RSI is above 70 and oversold when it is below 30.
The RSI line crossing below the overbought line or above oversold line is often seen by traders as a signal to buy or sell.
The RSI works best in trading ranges rather than trending markets.

GOLD : Whales Impact In trading MarketOANDA:XAUUSD
A whale is any individual or company who has enough money and power
To directly influence the price of a cryptocurrency or stock, usually in a negative way. Think of a whale and their large mass.
Whales use artistically created buy walls and sell walls to manipulate traders by changing current market sentiment.
Traders should be aware of large buy walls and sell walls that appear quickly. They could be part of a whale's manipulation strategy.
How do you spot a whale trade?
There are four primary ways to track whale activities,
which include monitoring known whale addresses, order books, sudden changes in market capitalization and trades on crypto exchanges.
Whales are held responsible for sudden price fluctuations in the crypto and traditional markets every so often.

GOLD : Is Rug Pull near to corner ?OANDA:XAUUSD
Hi , Trader's ..gold bullish move was because of SVB Bank collapse
Now market is extremely over bought ,
Market need's to do minimum 50% retracement near 1880 area first tp
Tp 2 1855 area in extension where 50 and 200 ema
market can give sharp downtrend
❤️ Please, support my work with follow ,share and like, thank you! ❤️

GOLD : Benefits of Investing in GoldOANDA:XAUUSD
Gold has been an inconsistent inflation hedge, but there may still be benefits to holding a small amount of the yellow metal in your portfolio. Gold has historically had a low or even negative correlation to both stocks and bonds, suggesting it offers value as a tool of diversification.
Gold prices held up pretty well during the Covid-19 pandemic market sell-off in early 2020, for example. From Feb. 1 to April 1 in 2020, the S&P 500 declined 23% while the price of gold dropped less than 0.1%.
Demand for gold from investors, central banks, jewelers and tech companies is also growing. According to the World Gold Council, global gold demand increased 12% year over year to 2.189 tons in the first half of 2022.
Depending on your individual goals, there are several easy ways to invest in gold. Investors can buy gold bullion, physical bars or coins that can be kept in a safe or bank.
You can also buy physical gold exchange-traded funds (ETFs) that hold gold bullion on investors’ behalf. The most popular gold ETF is SPDR Gold Shares (GLD).
Investors looking to speculate in the gold market can trade gold futures contracts. These contracts provide significant leverage, allowing investors to control large quantities of gold with a relatively small amount of money.
Finally, investors can buy shares of individual gold stocks or a gold mining ETF. The VanEck Gold Miners ETF (GDX) holds a diversified basket of 54 gold-related stocks, including Newmont Corp. (NEM), Barrick Gold Corp. (GOLD) and Franco-Nevada Corp. (FNV).
Conclusion : GOLD IS SAFE HEAVEN TO INVEST IN IT .

USDCHF :Bullish Rectangle Chart patternOANDA:USDCHF
Hi , Trader's .. Market Is in Bullish Trend , Now Market is Trading In rectangle pattern
Bullish Rectangle is bullish continue pattern , Market can retest it's pivot point again
after successful retest , buyer's can gain momentum and move to upper resistance
❤️ Please, support my work with follow ,share and like, thank you! ❤️

USOIL : Master Of Washing Account's TVC:USOIL
Hi , Trader's .. I am keeping chart very simple for you to understand
Price touching Resistance 1 , If price failed to break R 1 than it can Fall to pivot point around 76$
Price needs to Retest Pivot again for any further bullish momentum
Pivot point Will play a vital role as a death cross for oil

S&P 500 - RETESTING THE BREAKOUTS&P #SPX is retesting its major breakout level (Falling trendline). We are waiting for strong bullish candle in here as this level hold multiple confluence
1. EMA100 resides here
2. Test of Major falling trendline
3. Test of Tentative rising trendline (dotted)
A successful retest means S&P is gearing for new higher high (4120 and 4300). A failure will bring it back to 3800-3700 range where a review will be needed for next move.

Gold Full Scalping Vision With SMC Hi Trader's ,, How Area You Today ? Let's Start To Analyze The Market And Get The Best Chance To Enter Trades ,,
In This Chart We Have 2 Great Area For Buy & Sell Gold ,, From 1939 -1940 Sell And From 1916 - 1914 For Buy ,,.
This Is Smart Money Concept ( SMC ) Area ,, We Can Get Great Entry From This Area ..
Please Use Money Management ,, Hope You Will Be Always In Profit

Fertilizer Industry As An Alternative S&P 500Greetings.
S&P 500 Technical Analysis
From a technical point of view, S&P 500 continues to move in wave 5 of diagonal A. Due to lower inflation in the US, there is a high probability that the Fed will slow down the rate hike and, as a result, investors will start buying assets with a higher level of risk. However, historically, after the Fed started to lower the interest rate, the price of the S&P 500 corrected by 30-50% before continuing its upward movement.
The fertilizer industry as an alternative to the S&P 500
The fertilizer industry continues to be one of the most attractive in the stock market. In February 2022, Russia invaded Ukraine, which led to massive disruption in global commodity markets, including fertilizers. Before this event, the balance between fertilizer consumption and supply was determined by two factors, namely production incentives and also price competitiveness. I estimate that in the coming quarters, the balance between supply and demand for one of the most important commodities will be determined by the ability of farmers to buy fertilizer that has become very expensive. The increase in the price of fertilizers led to a significant increase in the margins of companies such as Nutrien, The Mosaic Company, and CF Industries Holdings, traded on the New York Stock Exchange, and the subsequent increase in dividend payments.
Source: IFA, IFDC, market news sources
Several reasons led to a sharp rise in the price of potash, phosphorus, and nitrogen fertilizers. The first and main reason is the sanctions against two key producing countries, namely Russia and Belarus. According to an IFA study, Russia accounts for about 25% of the world's supply of nitrogen fertilizers needed to increase crop yields. In addition, the share of Belarus and Russia in the sales of potash fertilizers is about 41%, which puts these countries in the top 3 in terms of production volumes.
Source: IFA
Fertilizer prices continue to be significantly higher than in previous years. For example, the price of potassium chloride amounted to $562.5 per ton in the 3rd quarter of 2022, which is 161.9% more than in the 3rd quarter of 2021.
Source: Author's elaboration based on data from the World Bank Group
In addition, the military conflict in Eastern Europe continues to be in an active phase and, as a result sanctions from Russia and Belarus will not soon be withdrawn. As a result, I believe that fertilizer stocks are still attractive assets for long-term investors and can become an alternative to investing in companies from the S&P 500.
Disclosure: This article may not take into account all the risks and catalysts of the assets described in it. Any part of this analytical article is provided for informational purposes only, does not constitute an individual investment recommendation, investment idea, advice, offer to buy or sell securities, or other financial instruments. The completeness and accuracy of the information in the analytical article are not guaranteed. If any fundamental/technical criteria or events change in the future, I do not assume any obligation to update this article.

US30 Sells Update - Interest Rates WeekThis was a US30 sell taken during the London session a day before the US Interest Rates news release.
Technical Analysis (explained in detail in the video):
1. Price was making lower highs from higher timeframes and continued to show bearish momentum.
2. During the Asian session yesterday, the price consolidated at a psychological level and finally made a liquidity wick as it broke previous 4-hour and hourly lows.
Fundamental and Market Sentiment Analysis:
1. Last week's CPI data showed inflation increasing, whereas the markets expected a slowdown or a decline in the price pressures.
2. The market started to price in potential higher interest rates this week.
3. Discussions around a full percentage hike started coming onto the table, and can that essentially mean a recession next year?
This week's trades are purely off of the market sentiment leading to tomorrow's interest rate hike.

Mini Course : Order Block Course Hi Trader's ,, How Are You Today ? Enjoy In Holiday ,, Buy Don't Forget To Learn Too In Holiday ..
Let,s Take A Very Fast And Mini Course For : Order Block ,,
First : What IS The Order Block Mean ?
Answer : There Are Many concepts For Order Block ,, But the Real And Easily concepts For It Is " Order Block it's The Area There Banks And Big Companies Take There Orders From it "
Second : How To Get It On Chart ?
Answer : We Have 2 Patterns For It ,, Bullish And Bearish As You Se On Chart ,,
In Bullish We Have 2 Way ,, In Down Trend We Get " Low ' High ' Lower High ' Higher High ' Lower High " Then Enter Our Trade
Or In Also Down Trend We Get " Low ' High ' Lower Low ' Higher High ' Lower High " Then Enter The Trade ..
In Bearish Pattern We Also Have 2 Way To Entry ,, In Up Trend We Get " High ' Low ' Higher Low ' Then Break Out The Low And Test It And Entry "
Stop Lose Be Above The Area With 20 - 40 Pips Only
IF You Get New Information From me ,, Please Like And Comment

ETHUSDT: Aadil1000x 3-step formationHello traders!
Welcome back to another episode with Analyst Aadil1000x.
This is my old strategy and it is not the top-ranked strategy but yes it's in the top 5 ranks out of my 500+ strategies.
This is a 3-step formation and this formation starts whenever there is a resistance that remains untested.
"Every trendline and S/R level is formed to be broken and after a breakout, there must be a retest" Aadil1000x.
What I mean by the statement is that if a trendline is too steep then it will be broken soon but too steep can not be retested. But if it's not too steep so whether the market reaches anywhere trendline will be tested.
Same in Support/Resistance level it cannot remain untested. If we know the market will come back there so we can count the step so that we can catch the peak of the retracement. In the first two steps, we form the trendline from the bottom, and after every breakout towards the downside Market will rise. On third step we will form the breakout from the top and after a breakout towards the upside market will drop and will go back to the magnetic line. Now the 1126 level will work like a magnet and the market will be there soon.
I am posting a chart of this formation as an example.
Don't forget to give some boost and follow to stay connected.

COMMODITIES SEASONAL | GOLD & USOILHello Readers!
Let's find out the monthly outlook of the two most essential commodities i.e Gold and USOIL
Gold on Monthly charts favors bulls for the month of July.Technically the yellow metal has made double top and for last three months posted negative closing. We are optimistic this month as technically it is trading on the support trendline.
USOIL (Crude Oil) monthly gives no clear indication for bulls or bears. However, if you observe closely the crude oil has hit its resistance and is trading near it. We are expecting a downward movement in black gold and pick entries in a lower timeframe
Let us know what do you think of the idea in the comment section.

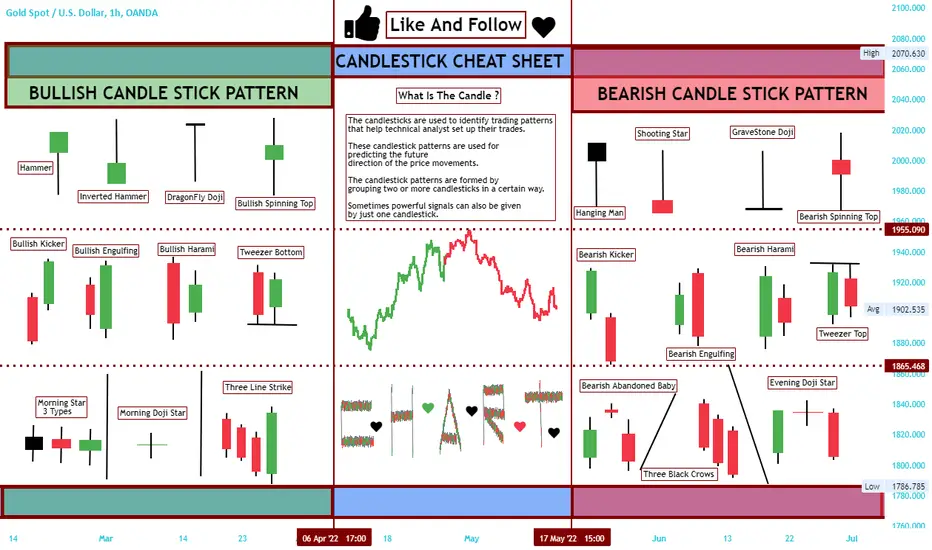
Candlestick Cheat Sheet You Must To Know➡️ Hi Trader's Whats Up Today ? Am Feel Good With New Education Post Will Inform You Many Details About Candles And Price Action ..
Let,s Start With " Bullish Candle Stick Patterns " ✅⬆️✅
1- Hammer
2- Inverted Hammer
3- Dragon Fly Doji
4- Bullish Spinning Top
5- Bullish Kicker
6- Bullish Engulfing
7- Bullish Harami
8- Tweezer Bottom
9- Morning Star
10 - Morning Doji Star
11 - Three Line Strike
Next Wave Will Be With " Bearish Candle Stick Patterns " ✅⬇️✅
1- Hanging Man
2- Shooting Star
3- Grave Stone Doji
4- Bearish Spinning Top
5- Bearish Kicker
6- Bearish Engulfing
7- Bearish Harami
8- Tweezer Top
9- Bearish Abandoned Baby
10 - Three Black Crows
11- Evening Doji Star
That' All My Friends And Show You In New Post ❤️
Most Popular Types Of Candles How to Read Candlestick charts?
Candlestick charts were originated in Japan over 100 years before the West had developed the bar charts and point-and-figure charts. In the 1700s, a Japanese man known as Homma discovered that as there was a link between price and the supply and demand of rice, the markets also were strongly influenced by the emotions of traders.
A daily candlestick charts shows the security’s open, high, low, and close price for the day. The candlestick’s wide or rectangle part is called the “real body” which shows the link between opening and closing prices.
This real body shows the price range between the open and close of that day’s trading.
When the real body is filled, black or red then it means that the close is lower than the open and is known as the bearish candle. It shows that the prices opened, the bears pushed the prices down and closed lower than the opening price.
If the real body is empty, white or green then it means that the close was higher than the open known as the bullish candle. It shows that the prices opened, the bulls pushed the prices up and closed higher than the opening price.
The thin vertical lines above and below the real body is knowns as the wicks or shadows which represents the high and low prices of the trading session.
---------------------------------------
1- Hammer Candle
Hammer is a single candlestick pattern that is formed at the end of a downtrend and signals a bullish reversal.
The real body of this candle is small and is located at the top with a lower shadow which should be more than twice the real body. This candlestick chart pattern has no or little upper shadow.
The psychology behind this candle formation is that the prices opened, and sellers pushed down the prices.
Suddenly the buyers came into the market and pushed the prices up and closed the trading session more than the opening price.
This resulted in the formation of bullish pattern and signifies that buyers are back in the market and downtrend may end.
Traders can enter a long position if next day a bullish candle is formed and can place a stop-loss at the low of Hammer.
-----------------------------------------
2- Hanging Man
Hanging Man is a single candlestick pattern which is formed at the end of an uptrend and signals bearish reversal.
The real body of this candle is small and is located at the top with a lower shadow which should be more than the twice of the real body. This candlestick pattern has no or little upper shadow.
The psychology behind this candle formation is that the prices opened and seller pushed down the prices.
Suddenly the buyers came into the market and pushed the prices up but were unsuccessful in doing so as the prices closed below the opening price.
This resulted in the formation of bearish pattern and signifies that seller are back in the market and uptrend may end.
Traders can enter a short position if next day a bearish candle is formed and can place a stop-loss at the high of Hanging Man.
-----------------------------------------
3- Three White Soldiers
The Three White Soldiers is a multiple candlestick pattern that is formed after a downtrend indicating a bullish reversal.
These candlestick charts are made of three long bullish bodies which do not have long shadows and are open within the real body of the previous candle in the pattern.
-----------------------------------------
4- Inverted Hammer
An Inverted Hammer is formed at the end of the downtrend and gives a bullish reversal signal.
In this candlestick, the real body is located at the end and there is a long upper shadow. It is the inverse of the Hammer Candlestick pattern.
This pattern is formed when the opening and closing prices are near to each other and the upper shadow should be more than twice the real body.
----------------------------------------
5- Piercing Pattern
Piercing pattern is a multiple candlestick chart pattern formed after a downtrend indicating a bullish reversal.
Two candles form it, the first candle being a bearish candle which indicates the continuation of the downtrend.
The second candle is a bullish candle which opens the gap down but closes more than 50% of the real body of the previous candle, which shows that the bulls are back in the market and a bullish reversal is going to take place.
Traders can enter a long position if the next day a bullish candle is formed and can place a stop-loss at the low of the second candle.
----------------------------------------
6- White Marubozu
The White Marubozu is a single candlestick pattern that is formed after a downtrend indicating a bullish reversal.
This candlestick has a long bullish body with no upper or lower shadows which shows that the bulls are exerting buying pressure and the markets may turn bullish.
At the formation of this candle, the sellers should be caution and close their shorting position.
Don't Forget To Like And Follow To Next Part

WAVESUSDT - TURBO UPDATE!Price has printed an ATH on April 22 for 64$ with the strong parabolic move. The drop was more serious than the upside surge as the price lost around 90%. This creates panic amongst traders as they expect more from WAVES.
This downtrend stayed approx 60 days and the price printed a LL of almost 4$. But from the previous 2 days, the Bulls stretched their muscles once again by putting so much Volume.
Price has already tried to bypass the strong resistance area but finds it difficult. So keep following the price action as we expect a strong upside in upcoming sessions. Good Luck! Trade Accordingly.

BTCUSDT - CRITICAL LEVELS IN PLAY!BTCUSDT UPDATE:
Bitcoin price is again flirting the range support and wants some Bulls volume. If we look at the previous action, when the price hit that zone it gets substantial volume around 100K.0 approx, and there is a strong pullback towards the top. Sooner or Later price will break that range, but we need to understand the price action established on the chart. Fear and Greed on a Low level since the Covid crash and Strong Project are vulnerable and a strong pullback is inevitable.

USDCHF | BEARISH TRENDUSDCHF after defining a top around 1.00
We saw a reversal sign as indicator suggesting bearish divergence.
It has broken rising trendline (white). Since then the pair is printing lower highs and lower lows.
Currently price is trading at short term support where EMA200 sustain.
Trade your levels accordingly.

EURNZD | RISING WEDGEEURNZD has been trading in rising wedge (bearish pattern). Currently price is approaching to the support of the wedge.
We are expecting a rise from here as multiple confluence point reside there. We have EMA100 and fib 38.2% level and trendline support.
However, break below from fib level will be all over for bulls and trend will be bearish.
