#EDU/USDT Forming Bullish Momentum#EDU
The price is moving within a descending channel on the hourly timeframe. It has reached the lower boundary and is heading towards a breakout, with a retest of the upper boundary expected.
The Relative Strength Index (RSI) is showing a downward trend, approaching the lower boundary, and an upward bounce is anticipated.
There is a key support zone in green at 0.1286, and the price has bounced from this level several times. Another bounce is expected.
The RSI is showing a trend towards consolidation above the 100-period moving average, which we are approaching, supporting the upward move.
Entry Price: 0.1607
Target 1: 0.1391
Target 2: 0.1486
Target 3: 0.1607
Stop Loss: Below the green support zone.
Remember this simple thing: Money management.
For any questions, please leave a comment.
Thank you.
EDU

Hidden Risk: When All Your Trades Move TogetherYou Think You Have 10 Positions. You Actually Have 1 Big Bet.
"I'm diversified - I have positions in 10 different stocks."
But if those 10 stocks all move together, you don't have 10 positions. You have one giant position wearing 10 different masks.
Correlation is the hidden risk that destroys "diversified" portfolios. Understanding it is non-negotiable.
What Is Correlation?
Definition:
Correlation measures how two assets move in relation to each other.
The Scale:
+1.0 = Perfect positive correlation (move together exactly)
0.0 = No correlation (independent movement)
-1.0 = Perfect negative correlation (move opposite exactly)
In Practice:
0.7 to 1.0 = Highly correlated
0.3 to 0.7 = Moderately correlated
-0.3 to 0.3 = Low correlation
-0.7 to -0.3 = Moderately negative correlation
-1.0 to -0.7 = Highly negative correlation
Why Correlation Matters
The Diversification Illusion:
You have 5 positions, each risking 2% of your account.
Total risk = 10%, right?
Wrong.
If all 5 positions are highly correlated (0.9+), your true risk is closer to:
5 × 2% × correlation factor = much higher than 10%
When they all move against you simultaneously, you don't lose 2% five times. You lose 10% all at once.
The 2008 Lesson:
"Diversified" portfolios collapsed together because correlations spiked to near 1.0 during the crisis. Everything fell at once.
Types of Correlation
1. Asset Correlation
How individual assets move together.
AAPL and MSFT: High correlation (both tech)
AAPL and XOM: Lower correlation (different sectors)
2. Sector Correlation
How sectors move together.
Tech and Growth: High correlation
Utilities and Tech: Lower correlation
3. Asset Class Correlation
How different asset classes move together.
Stocks and Bonds: Historically negative (but not always)
Stocks and Crypto: Increasingly correlated
4. Strategy Correlation
How different trading strategies move together.
Two momentum strategies: High correlation
Momentum and Mean Reversion: Lower correlation
Correlation Dynamics
Key Insight: Correlations Change
Correlations are not static. They shift based on:
Market regime (risk-on vs risk-off)
Volatility levels
Macro events
Time period measured
The Danger:
Correlations tend to spike toward 1.0 during crises.
Normal times: Assets move somewhat independently
Crisis times: Everything falls together
This Is When Diversification Fails You Most
Exactly when you need protection, correlations increase and your "diversified" portfolio acts as one.
How AI Analyzes Correlation
1. Real-Time Correlation Matrices
AI calculates correlation between all portfolio assets continuously.
2. Rolling Correlation
AI tracks how correlations change over time.
30-day rolling correlation
90-day rolling correlation
Identifies correlation regime changes
3. Stress Testing
AI simulates portfolio behavior when correlations spike.
What if all correlations go to 0.9?
What's the worst-case portfolio loss?
4. Correlation Clustering
AI groups assets by correlation patterns.
Identifies hidden clusters
Reveals true portfolio concentration
Managing Correlation Risk
Strategy 1: True Diversification
Don't just own different tickers. Own truly uncorrelated assets.
Checklist:
Different sectors
Different asset classes
Different geographies
Different strategies
Strategy 2: Correlation-Adjusted Position Sizing
Reduce position sizes when adding correlated assets.
Example:
First tech stock: 2% risk
Second tech stock (0.8 correlation): 1% risk
Third tech stock (0.85 correlation): 0.5% risk
Strategy 3: Correlation Limits
Set maximum correlation exposure.
Rule Example:
"No more than 30% of portfolio in assets with correlation > 0.7"
Strategy 4: Hedge with Negative Correlation
Add assets that move opposite to your main positions.
Examples:
Long stocks + Long volatility (VIX)
Long growth + Long value
Long risk assets + Long safe havens
Correlation Mistakes
Assuming Stable Correlations — "These assets have been uncorrelated for years." Reality: Correlations change, especially during stress. Plan for correlation spikes in your risk management.
Sector "Diversification" — "I own 10 different tech stocks, so I'm diversified." Reality: Same sector = high correlation = concentrated risk. Diversify across sectors, not just tickers.
Ignoring Strategy Correlation — Running 5 momentum strategies thinking they're independent. Reality: Same strategy type = correlated returns. Diversify strategy types, not just parameters.
Chasing Negative Correlation — "I'll just add negatively correlated assets." Reality: True negative correlation is rare and unstable. Focus on low correlation (near 0), not negative.
Correlation Analysis Framework
Step 1: Map Your Portfolio
List all positions and their characteristics:
Sector
Asset class
Strategy type
Geography
Step 2: Calculate Correlations
Use historical data to calculate correlation matrix.
Minimum 1 year of data
Consider multiple timeframes
Step 3: Identify Clusters
Group highly correlated positions.
Treat clusters as single positions for risk purposes
Step 4: Stress Test
Ask: "What if correlations spike to 0.9?"
Calculate worst-case portfolio loss
Ensure it's survivable
Step 5: Adjust
Reduce correlated positions
Add uncorrelated assets
Set correlation limits
Correlation Red Flags
All Positions in Same Sector — Even "different" companies in same sector are highly correlated.
All Positions Same Direction — All long or all short = directional concentration.
Correlation Increasing — Rolling correlation trending toward 1.0 = increasing risk.
Crisis Correlation Spike — During market stress, check if correlations are spiking.
Key Takeaways
Correlation measures how assets move together — high correlation = concentrated risk
"Diversified" portfolios often aren't — same sector/strategy = hidden concentration
Correlations spike during crises — exactly when you need diversification most
AI can calculate real-time correlation matrices and stress test portfolios
True diversification requires different sectors, asset classes, and strategies
Your Turn
Have you ever been surprised when "diversified" positions all moved against you?
How do you currently think about correlation in your portfolio?
Share your experience below 👇

EDUUSDT UPDATE#EDU
UPDATE
DGB Technical Setup
Pattern: Falling Wedge Pattern
Current Price: 0.1494
Target Price: 0.2235
Target % Gain: 50.30%
Technical Analysis: EDU is trading inside a falling wedge pattern on the 1D chart, which is a bullish reversal structure. Price is currently hovering near the wedge resistance, and a confirmed breakout above the descending trendline could trigger a strong upside move toward the highlighted target zone. Momentum is gradually improving, supporting the bullish scenario.
Time Frame: 1D
Risk Management Tip: Always use proper risk management.

edu looking good good but need confirmation Edu Over all Consolidating Within Descending Channel Range, And Now Showing Signs Of Recovery Towards Descending Trendline Which Is Next Resistance Around 0.17$ Edu Needs To Clear Blue Box Resistance To Target Trendline, If Trendline Got Cleared Then It Can Give Another Rally But Currently Our Target Should Be Trendline

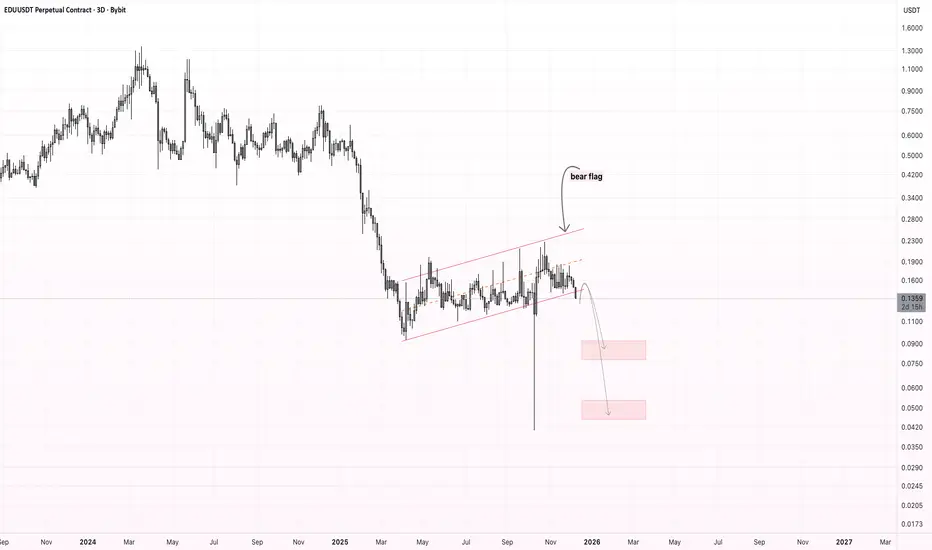
EDU – Bear Flag Breakdown Potential with Lower Targets AheadThe recent price action on EDUUSDT is forming a clear bear flag on the 3D timeframe. After a strong impulsive drop, the market has been consolidating inside an upward-sloping channel — a classic continuation pattern in a downtrend.
Price is now losing support at the lower boundary of the channel, suggesting the bear flag may be close to confirming a breakdown. If momentum continues to the downside, the next liquidity zones are located significantly lower.
Key observations:
Structure aligns with a bear flag , often signaling continuation of the prior sell-off.
Price is testing the lower trendline of the channel with increasing weakness.
A confirmed breakdown opens the path toward the next demand zones.
Downside Targets:
$0.09–$0.08
$0.055–$0.045
As long as price remains below the flag resistance, downside continuation remains the dominant scenario.
#EDU/USDT Forming Bullish Momentum#EDU
The price is moving in a descending channel on the 1-hour timeframe. It has reached the lower boundary and is heading towards breaking above it, with a retest of the upper boundary expected.
We have a downtrend on the RSI indicator, which has reached near the lower boundary, and an upward rebound is expected.
There is a key support zone in green at 0.1580. The price has bounced from this level multiple times and is expected to bounce again.
We have a trend towards consolidation above the 100-period moving average, as we are moving close to it, which supports the upward movement.
Entry price: 0.1615
First target: 0.1657
Second target: 0.1710
Third target: 0.1785
Don't forget a simple principle: money management.
Place your stop-loss order below the support zone in green.
For any questions, please leave a comment.
Thank you.

#EDUUSDT #1D (ByBit) Descending trendline breakout and retestOpen Campus is pulling back to 100EMA regained support where it seems likely to bounce and recover midterm.
⚡️⚡️ #EDU/USDT ⚡️⚡️
Exchanges: ByBit USDT
Signal Type: Regular (Long)
Leverage: Isolated (1.0X)
Amount: 5.1%
Current Price:
0.1598
Entry Targets:
1) 0.1587
Take-Profit Targets:
1) 0.3456
Stop Targets:
1) 0.0963
Published By: @Zblaba
NYSE:EDU BYBIT:EDUUSDT.P #1D #OpenCampus #Education opencampus.xyz
Risk/Reward= 1:3.0
Expected Profit= +117.8%
Possible Loss= -39.3%
Estimated Gaintime= 2-3 months

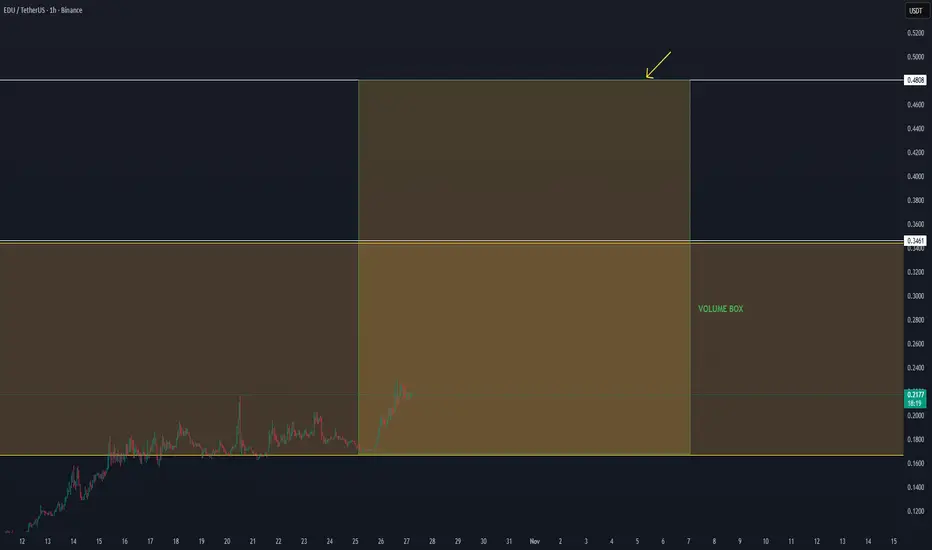
EDU/USDT – Volume Expansion Setup🔹 EDU/USDT – Volume Expansion Setup
EDU continues to show strong structure after the last move up, holding steady inside the volume box. The pair is building momentum with consistent volume increase on the lower time frames, showing clear accumulation signals.
If the current structure remains stable, EDU can continue this short-term uptrend and target the next resistance zone around $0.48, where the main reaction level is expected.
We follow the data and volume development closely — as long as the price stays supported inside the box, the momentum remains valid for a potential breakout continuation toward the upper range.
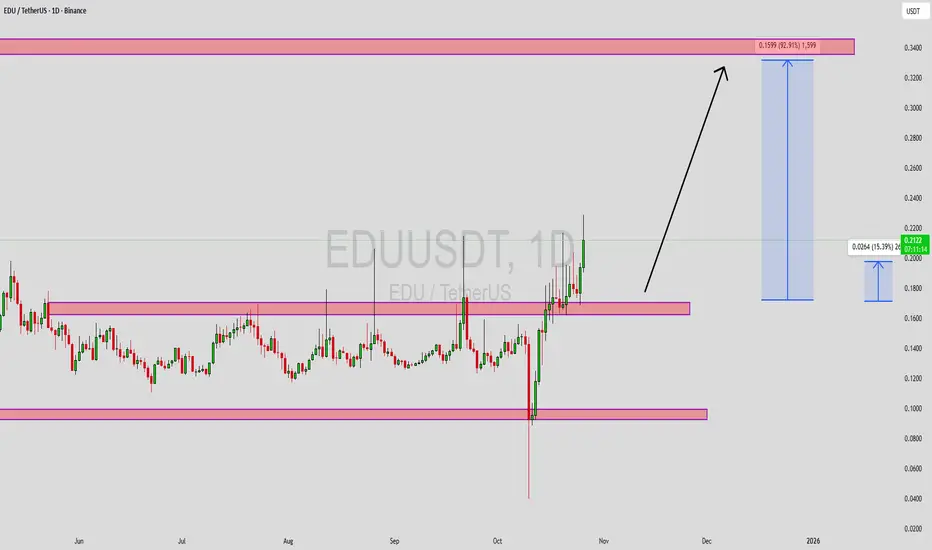
EDUUSDT Forming Bullish MomentumEDUUSDT is currently showing a strong bullish momentum pattern, indicating that buyers are firmly in control and price action is building toward a significant upward breakout. The structure suggests consistent higher lows with increasing volume, signaling that accumulation is happening in the background. As the market gains traction, EDUUSDT could be on the verge of a major push to the upside, aligning perfectly with the broader bullish sentiment across select altcoins.
The trading volume for EDUUSDT remains strong, confirming active participation and growing confidence among investors. Momentum indicators are pointing toward a continuation of the current trend, with a potential target range showing gains between 80% to 90%+. A breakout above the recent resistance levels could open the way for an extended rally, especially as traders begin positioning themselves ahead of the move.
Investor interest in EDUUSDT continues to rise, as many see this as a promising project backed by solid fundamentals and renewed technical strength. With bullish energy building across the crypto market, EDUUSDT could emerge as one of the high-performing assets in the near term. A sustained move above key levels may validate this pattern and lead to a substantial price expansion, rewarding early entries.
✅ Show your support by hitting the like button and
✅ Leaving a comment below! (What is You opinion about this Coin)
Your feedback and engagement keep me inspired to share more insightful market analysis with you!
EDU/USDT Update - Cycle TokenEDU is now trading inside the volume box area. After the last move up, the price is holding stable with volume increase on the 4H.
As long as EDU stays inside this range, we follow for a possible move to the top of the box around $0.34, where we expect first resistance.
If BTC stays stable, EDU can continue this short-term trend move to test the upper box level.

Is open campus going to give us a bullish lecture?It's been a while, and yes it's rough out there.
Among the wreck that has been left by the leverage flush there are some hidden gems.
Meet EDU (open campus)
Do you see the weekly candle?
Market structure is at LEAST 300% up from here.
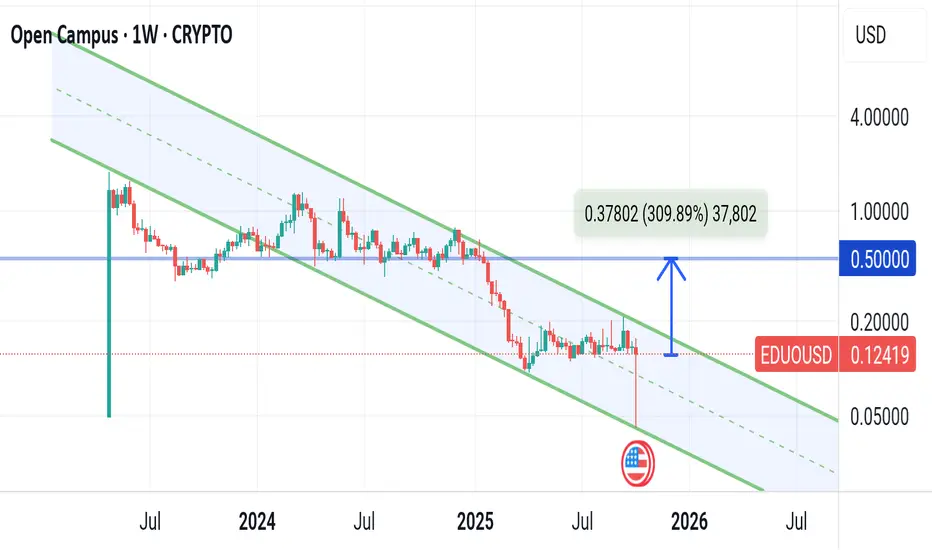
EDU BINANCE:EDUUSDT
#EDU/ USDT
Entry range (0.1200- 0.1380)
SL 4H close below 0.1170
T1 0.1730
T2 0.2800
T3 0.3300
_______________________________________________________
Golden Advices.
********************
* collect the coin slowly in the entry range.
* Please calculate your losses before the entry.
* Do not enter any trade you find it not suitable for you.
* No FOMO - No Rush , it is a long journey.

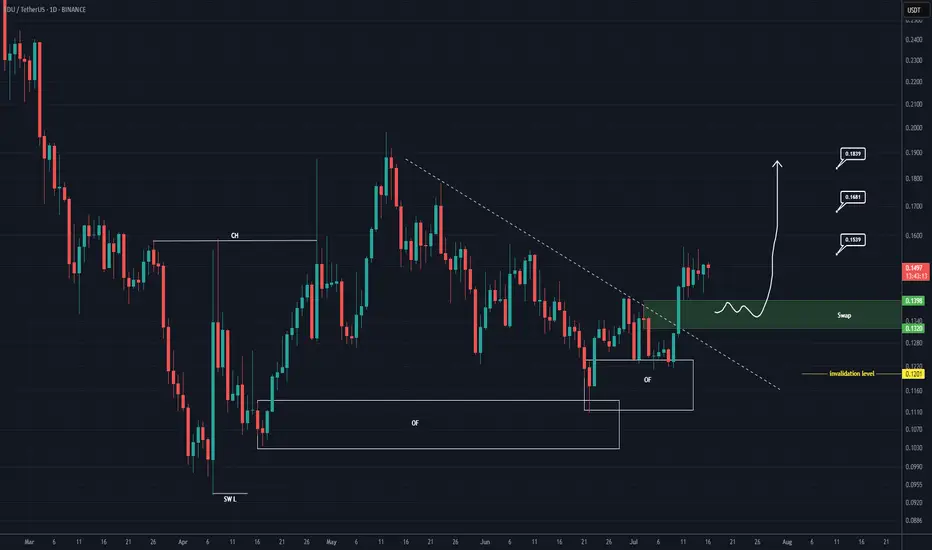
EDU Buy/Long Setup (1D)After forming a swing low, the price has created a bullish Change of Character (CH), and it has flowed well from the origin order blocks.
The trigger line has been broken, and the price has formed a SWAP zone.
Given the bullish signs on the chart, we can consider entering a buy position within the SWAP zone.
The targets are marked on the chart.
A daily candle closing below the invalidation level will invalidate this analysis.
For risk management, please don't forget stop loss and capital management
When we reach the first target, save some profit and then change the stop to entry
Comment if you have any questions
Thank You
EDUUSDT Forming Descending TriangleEDUUSDT has recently broken out of a descending triangle pattern on the daily timeframe, which is typically a bullish signal when confirmed with volume. The breakout has occurred with notable strength and solid green candle momentum, indicating a potential trend reversal and the beginning of a strong upward move. With price currently trading near $0.1499, this technical breakout opens the door for a projected gain of 60% to 70%+ in the coming days or weeks.
EDU, the native token of the Open Campus project, is gaining attention as the Web3 education narrative grows stronger. As traditional sectors like education integrate blockchain, EDU stands out as a project with real-world utility and adoption potential. The fundamentals are aligning well with the technical picture, and the increased investor interest is starting to reflect in both volume spikes and social media chatter.
If EDUUSDT maintains support above the breakout trendline, traders could see a continuation toward the $0.25 to $0.27 region — aligning with the chart projection of nearly 80% upside. This setup is further supported by increasing market sentiment, and EDU’s strategic partnerships in the education sector make this move fundamentally sound.
This is a high-potential setup for traders looking to ride breakout momentum in trending altcoins. EDU is not just riding the wave of hype but is backed by utility, strong technical structure, and market interest — making it a standout in the current altcoin rotation.
✅ Show your support by hitting the like button and
✅ Leaving a comment below! (What is You opinion about this Coin)
Your feedback and engagement keep me inspired to share more insightful market analysis with you!

#EDU/USDT#EDU
The price is moving within a descending channel on the 1-hour frame, adhering well to it, and is heading toward a strong breakout and retest.
We are experiencing a rebound from the lower boundary of the descending channel. This support is at 0.1400.
We are experiencing a downtrend on the RSI indicator, which is about to break and retest, supporting the upward trend.
We are heading toward stability above the 100 Moving Average.
Entry price: 0.1434
First target: 0.1463
Second target: 0.1488
Third target: 0.1522

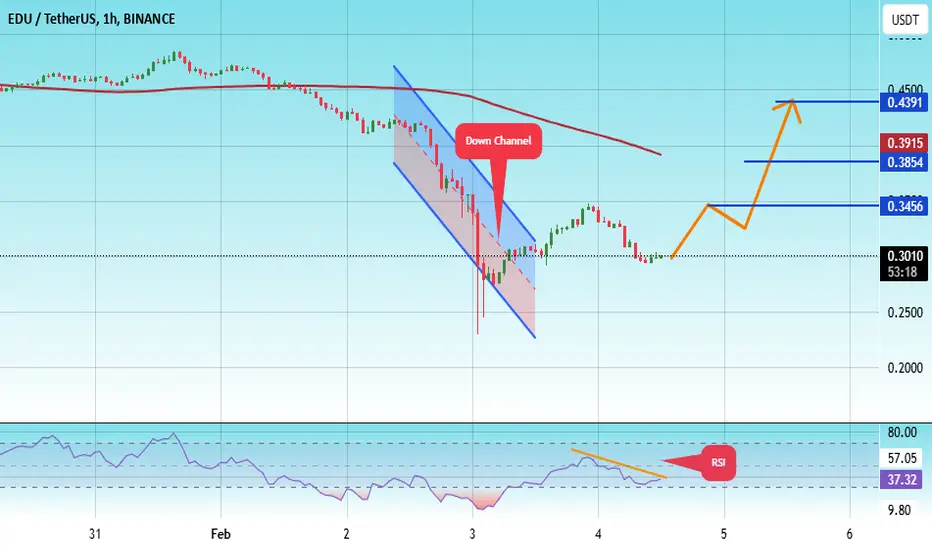
#EDU/USDT#EDU
The price is moving in a descending channel on the 1-hour frame and is adhering to it well and is heading to break it strongly upwards and retest it
We have a bounce from the lower limit of the descending channel, this support is at a price of 0.2300
We have a downtrend on the RSI indicator that is about to break and retest, which supports the rise
We have a trend to stabilize above the moving average 100
Entry price 0.2997
First target 0.3456
Second target 0.3854
Third target 0.4391
Open Edu Surged 20% Today Gearing to Reclaim $100 Mln Mkt CapOpen Edu ( NYSE:EDU ) native token spike 20% today amidst breaking out of key resistant point setting the coast to reclaim the $100 million market cap.
Built on the BNB chain, The Open Campus Protocol is a decentralized solution for educators, content creators, parents, students, and co-publishers designed to address the major challenges in education today. Despite the critical role of educators in shaping the future generation, they are often undervalued and underpaid.
With growing interest in the world of web3.0 and NFT's, NYSE:EDU might just be a ticking time bomb that is setting the stage for a billion dollar in market cap.
As of the time of writing, NYSE:EDU is up 18% with build up momentum and RSI at 57, NYSE:EDU is gearing for a 50% breakout as conformation for the $100 million market cap sojourn.
Similarly, failure to break further above the resistant level could lead to a sell-off to the $0.096 support point.
Open Campus Price Data
The Open Campus price today is $0.153184 USD with a 24-hour trading volume of $69,244,194 USD. Open Campus is up 17.44% in the last 24 hours. The current CoinMarketCap ranking is #466, with a market cap of $62,914,963 USD. It has a circulating supply of 410,715,985 EDU coins and a max. supply of 1,000,000,000 EDU coins.

#EDU/USDT#EDU
The price is moving within a descending channel on the 1-hour frame, adhering well to it, and is on its way to breaking it strongly upwards and retesting it.
We are seeing a rebound from the lower boundary of the descending channel, which is support at 0.1430.
We have a downtrend on the RSI indicator that is about to break and retest, supporting the upward trend.
We are looking for stability above the 100 Moving Average.
Entry price: 0.1480
First target: 0.1511
Second target: 0.1540
Third target: 0.1580

EDUUSDT 4DEDU ~ 4D
#EDU If you still have a Conviction on this coin,. This is a very good support block for now. buy gradually with a minimum target of 20%

5 Mistakes to Avoid When Trading Futures(My Personal Experience)Hi everybody🫶
Many of You have been asking about trading futures! So, I decided to write a post about the mistakes I’ve made in futures trading and how to avoid them. Of course, everyone has their own journey and will make their own mistakes, but learning from someone else’s experience can be incredibly valuable too!
Trading futures can be highly rewarding, but it also carries significant risks. Based on my own experience, here are five common mistakes I made and how to avoid them:
1. Ignoring Stop-Losses
Mistake:
Many traders skip setting stop-losses, hoping the price will reverse in their favor. This can lead to devastating losses.
How to avoid it:
Always set stop-losses before entering a trade. They are a simple yet effective way to limit losses. If you're worried about stop-hunts, place them considering market volatility or use trailing stops.
2. Overusing Leverage
Mistake:
High leverage can amplify profits, but it also significantly increases potential losses, especially in volatile markets.
How to avoid it:
Use minimal leverage, particularly if you're a beginner. Calculate your position size so that any potential loss does not exceed 1-2% of your capital per trade.
3. Trading Without a Clear Plan
Mistake:
Trading based on emotions or intuition often leads to chaotic decisions and loss of capital.
How to avoid it:
Develop and stick to a clear trading plan. Define your entry and exit points, position size, and risk levels before opening a trade. Regularly review and analyze your results.
4. Neglecting Risk Management
Mistake:
Putting too much capital into a single trade or failing to account for market volatility can result in substantial losses.
How to avoid it:
Diversify your positions and follow the rule: never risk more than 2% of your total capital at once. Assess current market volatility and adjust your position size accordingly.
5. Letting Emotions Drive Your Trades
Mistake:
Greed, fear, or the urge to "get even" can lead to impulsive and poorly thought-out decisions.
How to avoid it:
Stick to your pre-defined strategy instead of reacting emotionally. If you feel emotions taking over, take a break. Trading requires discipline and a calm mindset.
Avoiding these mistakes and following these tips, which come from my personal experience, can help you reduce risks and improve your chances of success in futures trading. Remember, the market is always full of opportunities, stay calm to catch them!
Thank You for staying with me
Sincerely yours,
Kateryna💋

Short Signal on EDUUSDT / Making profit even in Bleeding MarketBINANCE:EDUUSDT
📈Which side you pick?
Bull or Bear
Low-risk status: 3x-4x Leverage
Mid-risk status: 5x-8x Leverage
(For beginners, I suggest low risk status)
👾Note: The setup is active but expect the uncertain phase as well. also movement lines drawn to predict future price reactions are relative and approximate.
➡️Entry Area:
Yellow zone
⚡️TP:
0.6725
0.6375
0.5955
🔴SL:
0.7923
🧐The Alternate scenario:
If the price stabilizes against the direction of the position, below or above the trigger zone, the setup will be canceled.

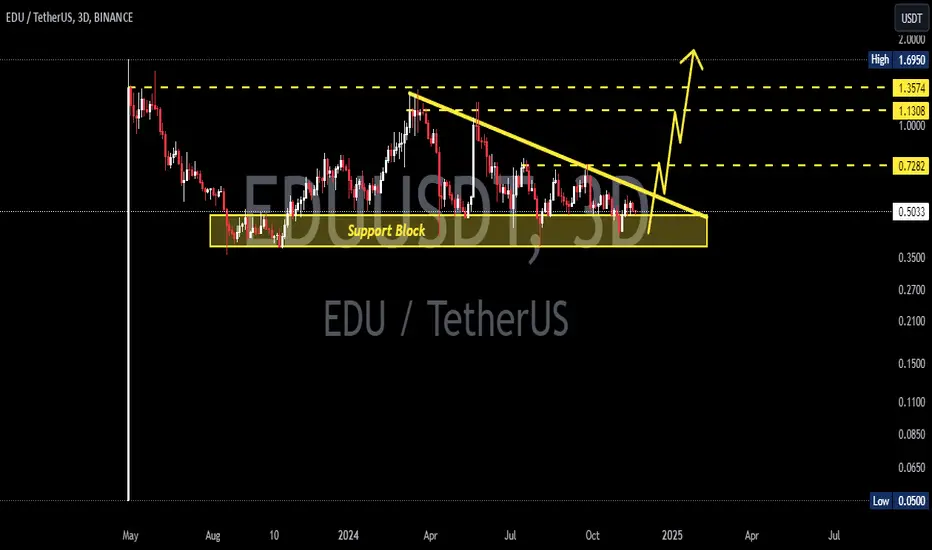
Open CampusEDU has been going in sideways since approximately it's issuance.
I think it's performing a bullish pattern to target either a new ATH or to reach the tops.
Passing $0.74 is a confirmation of the idea.
Breaking $0.47 is a stop-loss and invalidates the idea.

EDUUSDT 3DEDU ~ 3D
#EDU retest this support block,. if you still have Conviction on this coin,. Buy in stages from here. With a short term target of at least 20%+