EDUUSDT UPDATE#EDU
UPDATE
EDU Technical Setup
Pattern: Falling Wedge Pattern
Current Price: $0.168
Target Price: $0.239
Target % Gain: 44.55%
Technical Analysis: EDU is breaking out of a falling wedge pattern on the 4H chart, signaling bullish continuation potential. Price has successfully moved above the descending resistance trendline, confirming the breakout structure. The projected measured move from the wedge points toward the highlighted upside target zone, which aligns with prior resistance and reclaim levels. As long as price holds above the breakout area, momentum favors further upside expansion.
Time Frame: 4H
Risk Management Tip: Always use proper risk management.
Eduusdtidea

#EDU/USDT Forming Bullish Momentum#EDU
The price is moving in a descending channel on the 1-hour timeframe. It has reached the lower boundary and is heading towards breaking above it, with a retest of the upper boundary expected.
We have a downtrend on the RSI indicator, which has reached near the lower boundary, and an upward rebound is expected.
There is a key support zone in green at 0.1460. The price has bounced from this zone multiple times and is expected to bounce again.
We have a trend towards consolidation above the 100-period moving average, as we are moving close to it, which supports the upward move.
Entry price: 0.1500
First target: 0.1540
Second target: 0.1591
Third target: 0.1663
Don't forget a simple principle: money management.
Place your stop-loss order below the support zone in green.
For any questions, please leave a comment.
Thank you.

#EDU/USDT Forming Bullish Momentum#EDU
The price is moving within an ascending channel on the 1-hour timeframe and is adhering to it well. It is poised to break out strongly and retest the channel.
We have a downtrend line on the RSI indicator that is about to break and retest, which supports the upward move.
There is a key support zone in green at 0.1700, representing a strong support point.
We have a trend of consolidation above the 100-period moving average.
Entry price: 0.1760
First target: 0.1790
Second target: 0.1853
Third target: 0.1911
Don't forget a simple money management rule:
Place your stop-loss order below the green support zone.
Once you reach the first target, save some money and then change your stop-loss order to an entry order.
For any questions, please leave a comment.
Thank you.

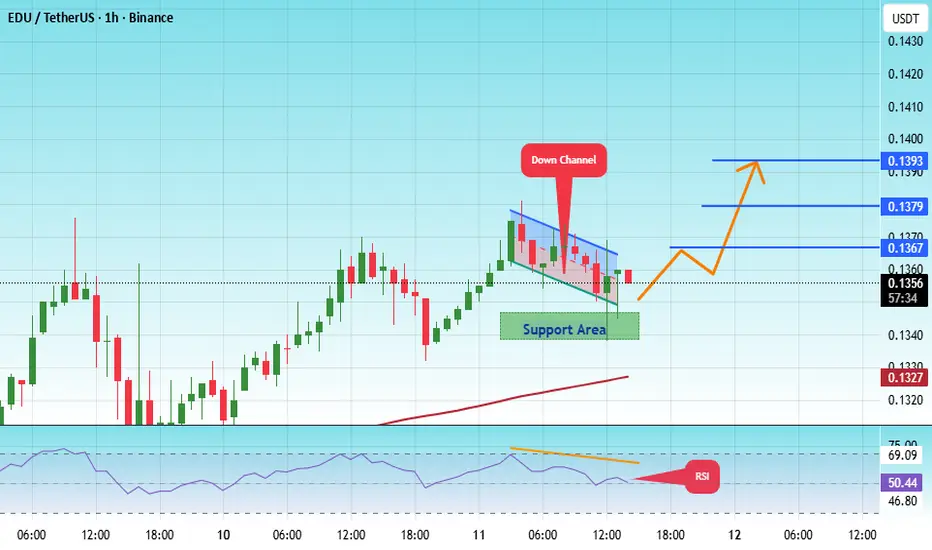
#EDU/USDT Forming Bullish Reversal#EDU
The price is moving within a descending channel on the 1-hour frame, adhering well to it, and is heading for a strong breakout and retest.
We have a bearish trend on the RSI indicator that is about to be broken and retested, which supports the upward breakout.
There is a major support area in green at 0.1342, which represents a strong support point.
For inquiries, please leave a comment.
We are in a consolidation trend above the 100 Moving Average.
Entry price: 0.1360
First target: 0.1367
Second target: 0.1380
Third target: 0.1393
Don't forget a simple matter: capital management.
When you reach the first target, save some money and then change your stop-loss order to an entry order.
For inquiries, please leave a comment.
Thank you.
#EDU/USDT#EDU
The price is moving within a descending channel on the 1-hour frame, adhering well to it, and is on its way to breaking strongly upwards and retesting it.
We have support from the lower boundary of the descending channel, at 0.1464.
We have a downtrend on the RSI indicator that is about to be broken and retested, supporting the upside.
There is a major support area in green at 0.1442, which represents a strong basis for the upside.
Don't forget a simple thing: ease and capital.
When you reach the first target, save some money and then change your stop-loss order to an entry order.
For inquiries, please leave a comment.
We have a trend to hold above the 100 Moving Average.
Entry price: 0.1487
First target: 0.1528
Second target: 0.1570
Third target: 0.1620
Don't forget a simple thing: ease and capital.
When you reach your first target, save some money and then change your stop-loss order to an entry order.
For inquiries, please leave a comment.
Thank you.

EDUUSDT Forming Descending TriangleEDUUSDT has recently broken out of a descending triangle pattern on the daily timeframe, which is typically a bullish signal when confirmed with volume. The breakout has occurred with notable strength and solid green candle momentum, indicating a potential trend reversal and the beginning of a strong upward move. With price currently trading near $0.1499, this technical breakout opens the door for a projected gain of 60% to 70%+ in the coming days or weeks.
EDU, the native token of the Open Campus project, is gaining attention as the Web3 education narrative grows stronger. As traditional sectors like education integrate blockchain, EDU stands out as a project with real-world utility and adoption potential. The fundamentals are aligning well with the technical picture, and the increased investor interest is starting to reflect in both volume spikes and social media chatter.
If EDUUSDT maintains support above the breakout trendline, traders could see a continuation toward the $0.25 to $0.27 region — aligning with the chart projection of nearly 80% upside. This setup is further supported by increasing market sentiment, and EDU’s strategic partnerships in the education sector make this move fundamentally sound.
This is a high-potential setup for traders looking to ride breakout momentum in trending altcoins. EDU is not just riding the wave of hype but is backed by utility, strong technical structure, and market interest — making it a standout in the current altcoin rotation.
✅ Show your support by hitting the like button and
✅ Leaving a comment below! (What is You opinion about this Coin)
Your feedback and engagement keep me inspired to share more insightful market analysis with you!

#EDU/USDT#EDU
The price is moving in a descending channel on the 1-hour frame and is adhering to it well and is heading to break it strongly upwards and retest it
We have a bounce from the lower limit of the descending channel, this support is at a price of 0.2600
We have a downtrend on the RSI indicator that is about to break and retest, which supports the rise
We have a trend to stabilize above the moving average 100
Entry price 0.2604
First target 0.2677
Second target 0.2736
Third target 0.2824

EDUUSDT 4DEDU ~ 4D
#EDU If you still have a Conviction on this coin,. This is a very good support block for now. buy gradually with a minimum target of 20%

EDUUSDT Analysis: Key Demand ZoneThe blue box in EDUUSDT marks a high-value demand zone , making it a strong candidate for potential entry points.
Key Highlights:
Blue Box Significance: This zone is carefully identified using CDV, liquidity heatmaps, volume profiles, and volume footprints , ensuring precision and reliability.
Risk Management: The general market conditions are still volatile. It's essential to confirm entries with upward market structure breaks on lower time frames.
Patience Pays Off: Waiting for a meaningful reaction within the blue box could lead to better opportunities.
Learn My Techniques: Want to master tools like CDV, liquidity heatmaps, volume profiles, and volume footprints to identify accurate zones? DM me, and I'll teach you step by step!
Support and Motivate: If you find this analysis valuable, please boost and comment. Your encouragement inspires me to share more insights!
If you think this analysis helps you, please don't forget to boost and comment on this. These motivate me to share more insights with you!
I keep my charts clean and simple because I believe clarity leads to better decisions.
My approach is built on years of experience and a solid track record. I don’t claim to know it all, but I’m confident in my ability to spot high-probability setups.
If you would like to learn how to use the heatmap, cumulative volume delta and volume footprint techniques that I use below to determine very accurate demand regions, you can send me a private message. I help anyone who wants it completely free of charge.
My Previous Analysis (the list is long but I think it's kinda good : )
🎯 ZENUSDT.P: Patience & Profitability | %230 Reaction from the Sniper Entry
🐶 DOGEUSDT.P: Next Move
🎨 RENDERUSDT.P: Opportunity of the Month
💎 ETHUSDT.P: Where to Retrace
🟢 BNBUSDT.P: Potential Surge
📊 BTC Dominance: Reaction Zone
🌊 WAVESUSDT.P: Demand Zone Potential
🟣 UNIUSDT.P: Long-Term Trade
🔵 XRPUSDT.P: Entry Zones
🔗 LINKUSDT.P: Follow The River
📈 BTCUSDT.P: Two Key Demand Zones
🟩 POLUSDT: Bullish Momentum
🌟 PENDLEUSDT.P: Where Opportunity Meets Precision
🔥 BTCUSDT.P: Liquidation of Highly Leveraged Longs
🌊 SOLUSDT.P: SOL's Dip - Your Opportunity
🐸 1000PEPEUSDT.P: Prime Bounce Zone Unlocked
🚀 ETHUSDT.P: Set to Explode - Don't Miss This Game Changer
🤖 IQUSDT: Smart Plan
⚡️ PONDUSDT: A Trade Not Taken Is Better Than a Losing One
💼 STMXUSDT: 2 Buying Areas
🐢 TURBOUSDT: Buy Zones and Buyer Presence
🌍 ICPUSDT.P: Massive Upside Potential | Check the Trade Update For Seeing Results
🟠 IDEXUSDT: Spot Buy Area | %26 Profit if You Trade with MSB
📌 USUALUSDT: Buyers Are Active + %70 Profit in Total
🌟 FORTHUSDT: Sniper Entry +%26 Reaction
🐳 QKCUSDT: Sniper Entry +%57 Reaction
📊 BTC.D: Retest of Key Area Highly Likely
I stopped adding to the list because it's kinda tiring to add 5-10 charts in every move but you can check my profile and see that it goes on..

#EDU/USDT#EDU
The price is moving in a descending channel on a 30-minute frame and is expected to continue upwards
We have a trend to stabilize above the moving average 100 again
We have a descending trend on the RSI indicator that supports the rise by breaking it upwards
We have a support area at the lower limit of the channel at a price of 0.6288
Entry price 0.6288
First target 0.6700
Second target 0.7000
Third target 0.7415

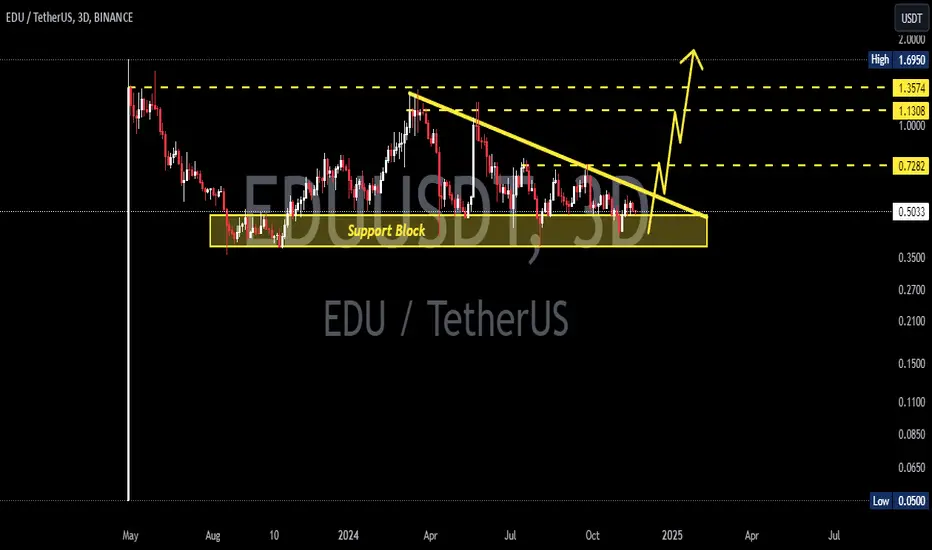
EDUUSDT 3DEDU ~ 3D
#EDU retest this support block,. if you still have Conviction on this coin,. Buy in stages from here. With a short term target of at least 20%+
#EDU/USDT#EDU
The price is moving in an ascending channel on the 1-day frame and is sticking to it very well
We have a bounce from a major support area in green at 0.4750
We have a downtrend on the RSI indicator that was broken upwards which supports the upside
We have a trend to stabilize above the 100 moving average which supports the upside
Entry price 0.5000
First target 0.6085
Second target 0.6638
Third target 0.7444

EDUUSDTEDU ~ 2D
#EDU Maintaining this demand zone,. It looks like the Bulls will start to take control of the here.
We expect an increase of at least 20%+.

Edu/Usdt Is Strong The EDU/USDT pair has confirmed an upside breakout after a temporary fakeout to the downside, indicating potential bullish momentum. A projected 60-120% price surge may occur in the coming days. Keep a close watch on this development, but remember this is not financial advice—conduct your research (DYOR).
