EGLD Buy/Long Signal (4H)It appears that a diametric pattern has formed on the 4-hour timeframe, and we are currently in the late stages of wave G.
The green zone is a good area for the completion of wave G, or at least the completion of part of wave G.
The entry zone and targets have been marked on the chart.
A daily candle close below the invalidation level would invalidate this analysis.
For risk management, please don't forget stop loss and capital management
When we reach the first target, save some profit and then change the stop to entry
Comment if you have any questions
Thank You
EGLD

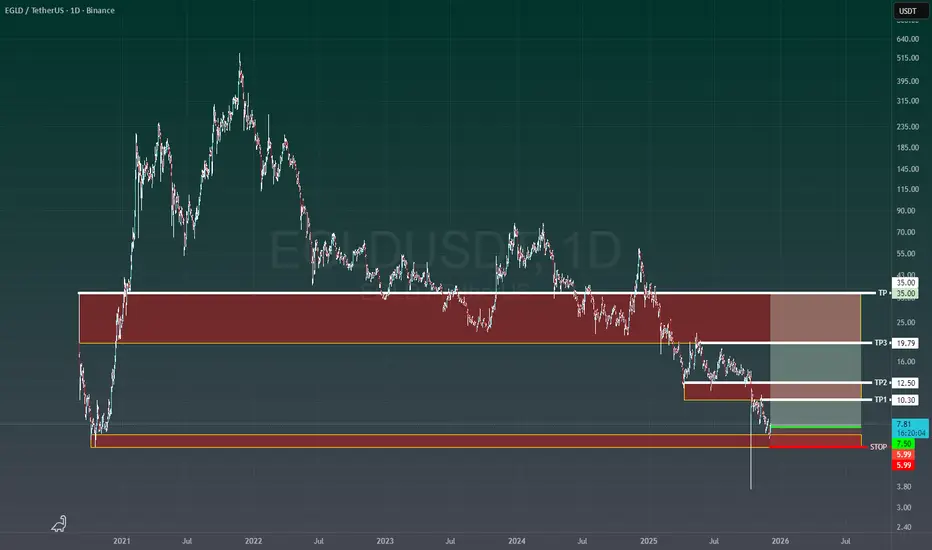
#EGLD Deep Value Zone with High Convexity SetupChart Context:
• Pair: EGLD/USDT
• Timeframe: 1D
• Exchange: Binance
• Structure: Multi-year downtrend, now testing historical demand zone.
Analysis:
EGLD has completed a full cycle from its 2021 peak (> $500) into a prolonged structural decline. Price recently swept deep liquidity at $5–$6 , signaling capitulation and absorption. This zone aligns with historical demand and offers asymmetric risk/reward for tactical longs.
Key Levels:
• Entry: $7.50
• STOP: $5.99 (below capitulation wick)
• TP1: $10.30
• TP2: $12.50
• TP3: $19.79
• TP4: $35.00
Risk/Reward Profile (Entry $7.50):
• Risk: $1.51
• TP1: Reward $2.80 → 1.85R
• TP2: Reward $5.00 → 3.31R
• TP3: Reward $12.29 → 8.14R
• TP4: Reward $27.50 → 18.21R
• Blended R (25% scale-out each TP): ~7.88R
Execution Plan:
• Initial STOP: $5.99
• Scale-out:
– TP1: 10%
– TP2: 20%
– TP3: 30%
– TP4: 40%
• Trail:
– Move to break-even after TP1
– Structure-based trailing after TP2
– ATR trail after TP3
Market Maker Perspective:
• Liquidity sweep into $5 zone suggests inventory accumulation.
• Path of least resistance: fill inefficiencies toward $10–$12, then target buyside liquidity near $20+.
• Macro trend remains bearish; this is a counter-trend play , not a confirmed reversal until $15+ is reclaimed.
Risk Disclaimer:
This is not financial advice . Crypto assets are highly volatile. Manage risk strictly and size positions conservatively.
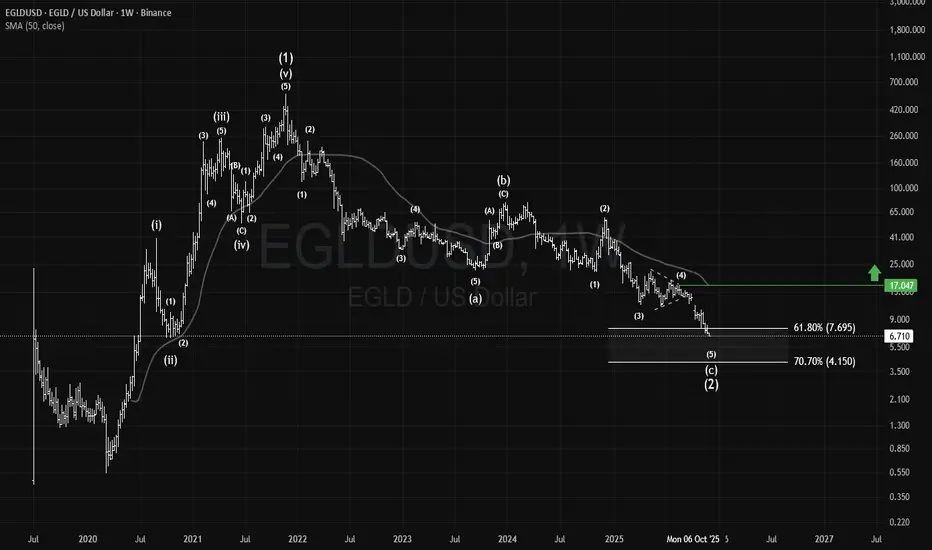
EGLD: Bullish Historical Pattern#EGLD has potentially formed a historical 1-2 bullish pattern after 4 years of correction and sideways decline. It has now entered a premium long-term buying zone based on Fibonacci retracement levels.
Passing above $17.05 would confirm a bullish reversal.
#MultiversX
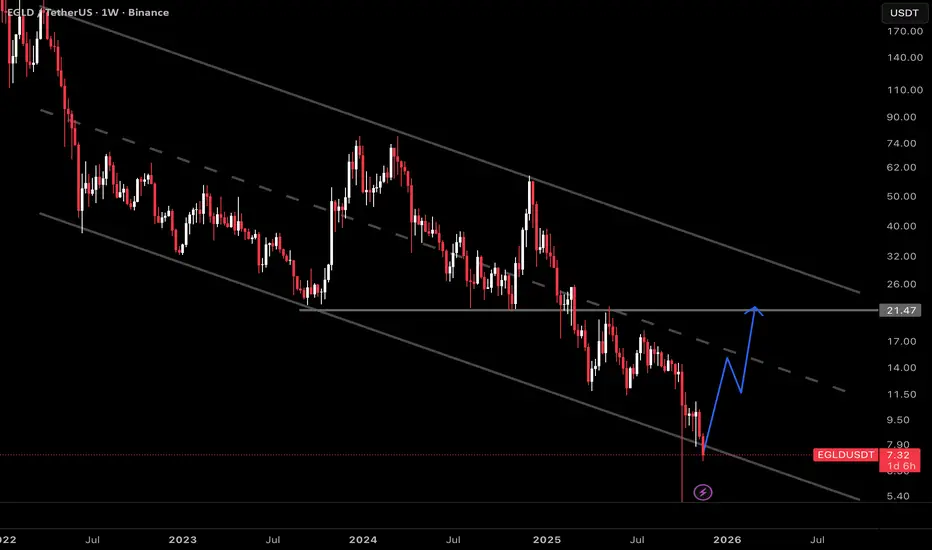
EGLD Descending ChannelThe price action for EGLD is in a well-defined descending channel since early 2022, mapping out lower highs and lower lows as the asset retraced from its previous bull market peak.
Whenever EGLD reached the lower part of its descending channel, price has historically tended to reverse upward, offering short-lived relief rallies.
This setup remains highly speculative and should be approached with caution. The downtrend has repeatedly disappointed, with many previous bounces failing to deliver sustained upside or meaningful trend changes. For this reason, any trades initiated at the channel lows are best sized conservatively, allocate only a small portion of capital.
The $21 level represents a significant resistance for EGLD, if price approaches $21 during a reversal, taking profit will be a good idea.
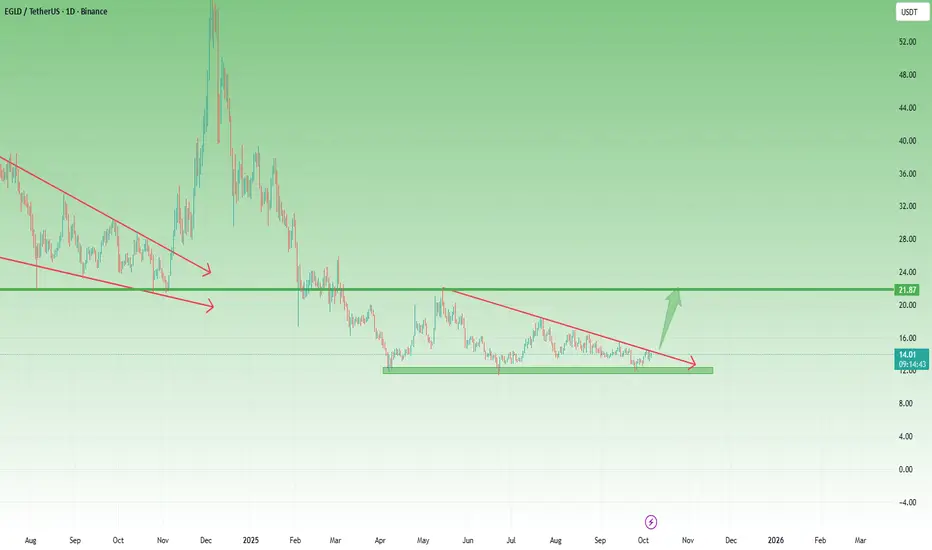
EGLD – Third Touch at $12 Support Could Ignite a Major ReversalEGLD has been on my radar for quite some time...
After forming a major low in April and rallying back toward the $22 zone, the coin pulled back again — effectively confirming that level as strong support.
By the end of September, price revisited the $12 area for the third time, and once again buyers stepped in decisively, triggering a solid rebound. Now, EGLD trades around $14, sitting just below a falling trendline that has capped upside momentum for months.
________________________________________
Technical Outlook
• Support: $12 (triple-tested, major demand zone)
• Resistance: Falling trendline around $14–15
• Soft target: $22 (key resistance and prior reversal area)
________________________________________
My Trading View
Given the strength of this repeated support and the contracting structure, I believe this trendline resistance is likely to break soon. If momentum follows through, EGLD could accelerate sharply to the upside, mirroring past explosive moves.
The setup remains constructive — buying dips above $12 could offer a strong risk–reward opportunity heading into the next leg higher.
EGLDUSDT UPDATE#EGLD
UPDATE
EGLD Technical Setup
Pattern: Bullish falling wedge pattern
Current Price: $27.60
Target Price: $43.20
Target % Gain: 56.52%
CRYPTOCAP:EGLD is breaking out of a falling wedge pattern on the 1D timeframe. Current price is $27.60 with a target near $43.20, showing about 56% potential upside. The breakout confirms bullish momentum, suggesting possible continuation if volume sustains. Always use proper risk management.
Time Frame: 1D
Risk Management Tip: Always use proper risk management.

EGLD has formed a bullish double bottom📊 CRYPTOCAP:EGLD Market Update
CRYPTOCAP:EGLD has formed a bullish double bottom 📈
👉 If it breaks out the red resistance zone 🔴, the first target will be the green line level 🎯

EGLD/USDT — Descending Triangle at a Critical Demand Zone🔎 Overview
The EGLD/USDT (1D, Binance) chart is currently forming a classic descending triangle pattern:
Lower Highs are pressing price downward along the yellow trendline.
A strong horizontal demand zone at 11.40 – 13.50 USDT has been repeatedly tested as support.
Price is compressing toward the apex of the triangle → as the range tightens, the likelihood of a strong breakout or breakdown increases significantly.
---
🧩 Technical Pattern Details
Descending Triangle → historically leans bearish, but can flip bullish if the breakout occurs with strong volume.
Volume has been contracting, a typical sign of market indecision before a large move.
Support Zone 11.40 – 13.50 → key demand area; losing this level may trigger a strong sell-off.
Dynamic Resistance: the descending yellow trendline remains the critical barrier for bulls.
---
📊 Bullish Scenario
Confirmation: Daily close above the descending trendline with strong volume.
Upside Targets:
First hurdle: 16.29 USDT
Next: 18.20 → 20.85 USDT
Mid-term if momentum expands: 33.48 – 38.67 USDT
Reasoning: A breakout above a descending triangle often sparks a short-covering rally, leading to fast gains.
---
📉 Bearish Scenario
Confirmation: Daily close below 11.40 USDT.
Downside Targets:
Immediate: 11.00 – 10.50 USDT
Extension: 9.60 USDT (next major low on chart).
Reasoning: Breaking a multi-tested demand zone confirms sellers’ dominance, likely triggering a continuation of the downtrend.
---
🎯 Strategy & Risk Management
Conservative Approach: Wait for confirmation (breakout/breakdown) + retest → safer entries.
Aggressive Approach: Long near the demand zone with tight stop-loss below 11.40 (higher risk due to bearish bias of the pattern).
Stop Loss: Below demand zone for longs, above broken support (retest) for shorts.
Risk/Reward: Minimum 1:2 R:R ratio to keep trades profitable over time.
---
🚀 Conclusion
EGLD/USDT is at a make-or-break level.
A breakout above the trendline could fuel a rally toward 18–20 USDT.
A breakdown below 11.40 USDT opens the door to 9.60 USDT or lower.
The market is compressing, and the next decisive daily close with volume will likely set the direction. This is a high-watch setup.
#EGLD #EGLDUSDT #Elrond #CryptoAnalysis #TechnicalAnalysis #ChartPattern #DescendingTriangle #SupportResistanc #CryptoTrading #BullishScenario #BearishScenario

EGLDUSDT - Great for long positionsIt’s forming a Cup and Handle pattern on the 4H timeframe.
The neckline corresponds to the 0.618 Fibonacci level.
Once it breaks and closes above it, your target will be 20% from here. It’s a good buying opportunity now, but don’t use high leverage.
Best regards:
Ceciliones🎯

EGLDMultiversX
Egld usdt Daily analysis
Risk rewards ratio >2.2 👈👌
Pattern = two bottoms
First target =21.3$

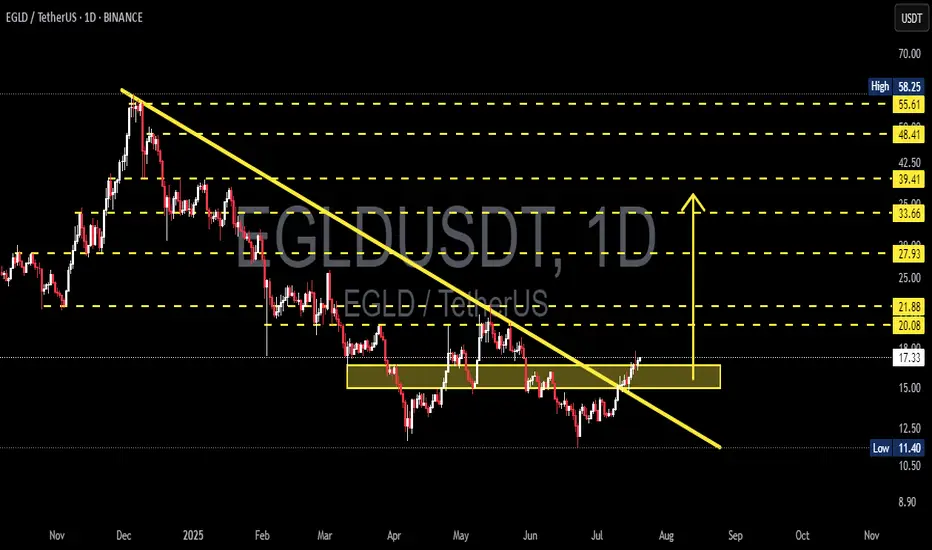
EGLD Breaks Key Downtrend – Is This the Beginning?📊 Detailed Technical Analysis (Daily Timeframe):
🔍 1. Market Structure & Chart Pattern
Major Downtrend Line Breakout – Reversal Signal:
After being stuck under a persistent downtrend for nearly 9 months, EGLD has officially broken out of the descending trendline, signaling a potential shift from distribution to expansion phase. This breakout is significant and could mark the beginning of a new bullish trend.
Double Bottom + Accumulation Range:
Price action shows a clear double bottom formation within the $13.00–$16.50 range, which acted as a strong accumulation zone. This horizontal structure suggests buyers have been silently accumulating before triggering this breakout.
Resistance Turned Support (RBS):
The breakout is now being retested around the $17 level. If EGLD holds this area, it would confirm a support flip, which is a classic bullish signal. Holding above this zone would give bulls full control over the next moves.
🟢 2. Bullish Scenario (Base Case):
If the breakout sustains with increasing momentum:
✅ Short-Term Targets:
$20.08 and $21.88 – minor historical resistance levels.
✅ Mid-Term Targets:
$27.93 and $33.66 – key levels aligning with measured move targets and Fibonacci retracements.
✅ Long-Term Targets:
$39.41, $48.41, up to $55.61–$58.25 – previous key highs and psychological zones.
💡 If EGLD successfully retests and holds above $17.00, it presents a strong opportunity for trend-following entries with favorable risk-reward.
🔴 3. Bearish Scenario (Alternative Case):
If this breakout fails (false breakout scenario):
⚠️ Price could fall back into the previous accumulation range between $13.00–$15.50.
A breakdown below that range could drag EGLD further down toward $11.40, or even $10.00 – a crucial long-term support zone.
Lack of volume or weak bullish confirmation would be early signs of a failed breakout.
🧠 4. Sentiment & Broader Context:
🌐 This breakout comes at a time when altcoin capital rotation is starting to emerge as BTC dominance cools off.
🚀 EGLD, as a smart contract platform, historically performs well during altseason waves and ecosystem narratives.
✅ Final Thoughts:
> EGLD has printed a significant breakout from long-term bearish control. With accumulation completed and momentum building, this may be the beginning of a bullish cycle. However, staying above the $17 level is the key validation to confirm this trend reversal.
#EGLD #EGLDUSDT #CryptoBreakout #AltcoinSeason #TrendReversal #CryptoAnalysis #TechnicalAnalysis #BullishSetup #DoubleBottom
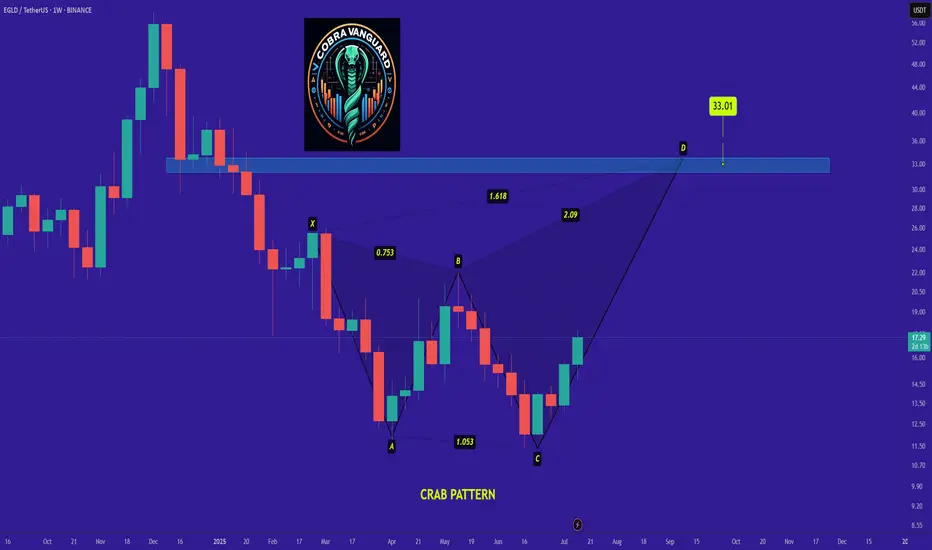
EGLD is bullish now & many Traders don't see it !!!Be careful with EGLD !!!
we can hope that the price will act like a Crab pattern and the price will grow well.
I expect that the price will grow very quickly...
Stay Awesome , CobraVanguard.
Most Will Get Trapped on EGLD’s Next Move Don’t Be One of ThemYello Paradisers, did you catch the EGLD breakout or are you still waiting for confirmation that’s already gone? While most traders are sleeping on this setup, it has just completed one of the cleanest breakout-and-retest patterns we’ve seen in weeks, and what comes next could leave many trapped on the wrong side.
💎#EGLDUSDT recently broke through its descending resistance with strength and has now retested that same level, which is acting as solid support in the $14.30–$15.00 range. This successful flip of resistance into support is a textbook bullish signal, and it’s holding beautifully indicating strong buyer presence and increasing the probability of continued upside.
💎If this support holds firm, #EGLD is eyeing a move toward the $18.00–$18.25 region, where moderate resistance is expected. A break above this could open the path toward the $19.90–$20.40 zone, a significant resistance level that may shape the next macro structure on this chart.
But it’s not all upside. If EGLD fails to hold the $13.00 level and especially the key invalidation point at $11.85 this entire bullish setup breaks down, and sellers will likely take control. The bullish momentum would collapse fast, and the door would open to much deeper downside levels.
MyCryptoParadise
iFeel the success🌴

BOBER - you don't need itWhy BOBER Could Perform in Autumn 2025 Bullrun
Meme Coin Hype: Bullruns favor meme coins with strong branding. BOBER’s capybara meme and MultiversX’s low fees make it accessible for retail investors seeking high returns.
Micro-Cap Potential: With a ~$6.8M market cap, BOBER has significant room for growth, appealing to speculative investors chasing 10x-100x gains in a bullrun.
MultiversX Ecosystem: MultiversX’s scalability and growing DeFi/NFT adoption could elevate BOBER, especially if the chain gains broader traction in 2025.
NFT and Gaming Catalysts: Successful NFT utility or a “Bober Land” game launch by Autumn 2025 could drive demand, particularly if the NFT/gaming market rebounds.
BOBER - 10.000x that nobody wantsWhy BOBER Could Perform in Autumn 2025 Bullrun
Meme Coin Hype: Bullruns favor meme coins with strong branding. BOBER’s meme and MultiversX’s low fees make it accessible for retail investors seeking high returns.
Micro-Cap Potential: With a ~$1.5M market cap, BOBER has significant room for growth, appealing to speculative investors chasing 100x-10000x gains in a bullrun.
MultiversX Ecosystem: MultiversX’s scalability and growing DeFi/NFT adoption could elevate BOBER, especially if the chain gains broader traction in 2025.
NFT and Gaming Catalysts: Successful NFT utility or a “Bober Land” game launch by Autumn 2025 could drive demand, particularly if the NFT/gaming market rebounds.

EGLD Analysisno need to say something , chart is speaking it self .Remember Ride the wave of the trend and let it guide you.
Best regards CobraVanguard.💚

EGLDUSDT 1D AnalysisEGLD ~ 1D Analysis
#EGLD Buy back gradually from here if you still have confidence in this coin with a short term target of at least 15%+ from here.

Bullish outlook for MultiversX (EGLD) | Eyes 40% to 100% surgeBullish outlook for MultiversX base token, egold (EGLD)
Since April 25, CRYPTOCAP:EGLD has been trading above a key trend indicator — closing 27 days above the S/R 1D50EMA, with a 6-day deviance below that line.
The 50-day exponential moving average has played a significant role for the token, indicating short- and mid-term trends and market sentiment for egold and the MultiversX chain.
This current behavior signals strength and a rising positive sentiment. I wouldn't be surprise with a sudden run to each of the previous touching points: $25.5 and $37, making 40% to 100% from the current $18.2.
Despite the targets, trading and closing all these days above the 1D50EMA marks a significant trend shift after nearly 5 months trading below this average (bearish), followed by a massive negative sentiment in the MvX ecosystem.
Things are changing in a great timing with the Andromeda upgrade activation — the biggest release for MultiversX since the mainnet launch around five years ago.

#EGLD/USDT#EGLD
The price is moving within a descending channel on the 1-hour frame, adhering well to it, and is heading for a strong breakout and retest.
We are seeing a rebound from the lower boundary of the descending channel, which is support at 16.80.
We have a downtrend on the RSI indicator that is about to be broken and retested, supporting the upward trend.
We are looking for stability above the 100 moving average.
Entry price: 17.32
First target: 17.65
Second target: 18.55
Third target: 19.45

#EGLD/USDT#EGLD
The price is moving within a descending channel on the 1-hour frame and is expected to continue upward.
We have a trend to stabilize above the 100 moving average once again.
We have a downtrend on the RSI indicator that supports the upward move with a breakout.
We have a support area at the lower boundary of the channel at 17.19.
Entry price: 17.82
First target: 18.26
Second target: 18.76
Third target: 19.40

MultiversX, Crypto, Stock Market, The World & Soul PsychologyThis is MultiversX in the transition period, between bear and bull market.
I don't know if you already know what I've been saying and sharing about the transition years, 2023 and 2024. Here I have the linear chart which clearly shows the difference between a bull market vs a sideways market.
After the bottom in mid-2022 all the action has been mostly neutral, sideways. There has been some bullish waves but this is nothing compared to bull market type of action. The only reason why the waves from 2023 and 2024 looks big in my other charts is because of the log. scale. When you use linear, you can see the difference.
Late 2024 we saw some bullish action. Mid-2025 is nothing like 2022, 2023 or 2024, it will be like 2021. It will be crazy.
Now, as to the chart, the candles will extend and become really big like on the left side. So all projections will be invalidated and all the charts will become distorted.
All the action from 2023 and 2024 will become almost invisible and everything will trade at new All-Time Highs. This is what you need to prepare for.
Even with a 20%, 30% rise, this is nothing, we are still at the bottom. New All-Time Highs all across (allow for the usual variations of course).
Those pairs that didn't produce a very strong correction have limited potential for growth.
Those pairs that removed 100% of all gains from previous cycles can do huge growth.
All Cryptocurrency tradings pairs have huge potential in this year 2025 and possibly beyond.
Now, we are in the bull market year but this isn't all. There will be bullish waves and bearish waves all the years, endless opportunities. Another strong bull market in 2029, 2033 and so on. It goes on and on and on. For hundreds of years.
The stock market is already hundred of years old.
The English people and the Jews used to trade with papers more than a hundreds years ago. It evolved into what we have today.
The Cryptocurrency market is only starting now and is here to stay.
The markets will evolve but nothing will be lost, we will have the usual commodities, forex (currencies), metals, stocks and Crypto. And all the other stuff that I am not familiar with, the derivatives, bonds and other type of junk.
You are a human being. You have the living spirit within you and to read this you are using a technological device, your choice is Crypto. The rest is old.
Money evolves, the world evolves, we don't fight change, we adapt and grow.
The most important ability in this reality is adaption. The market has never stop changing, nothing is permanent other than your Soul.
Namaste.

EGLD's situation+ Target PredictionThe EGLDUSDT is in a Bullish phase by a Falling Wedge Pattern.
-A falling wedge indicates the potential for price to reach to $23.
Note if the Wedge Pattern is broken downwards with the strength of Bearish candles , this analysis of ours will be failed.
Give me some energy !!
✨We spend hours finding potential opportunities and writing useful ideas, we would be happy if you support us.
Best regards CobraVanguard.💚
_ _ _ _ __ _ _ _ _ _ _ _ _ _ _ _ _ _ _ _ _ _ _ _ _ _ _ _ _ _ _ _
✅Thank you, and for more ideas, hit ❤️Like❤️ and 🌟Follow🌟!
⚠️Things can change...
The markets are always changing and even with all these signals, the market changes tend to be strong and fast!!

EGLD is ready to hit $30 (Short Squeeze)CRYPTOCAP:EGLD just hit its weekly demand zone and is showing a good reaction its about time it goes to $30.
