LCSW Price near 25.5 within an inverted triangle.Breakout confirmation may open the path toward 48LE.
Egx

BONY is currently trading around 3.84.The price is showing early signs of recovery after consolidation.
If momentum continues, a move toward the 6.20 area could be possible.
Risk management is advised.

NEDA: Bounce from Support + Attempt to Break the DowntrendPrice holding support 2.30–2.40. Now trying to break the downtrend line.

SWDY | Entry 76 → Target 93Swing trade idea based on price structure. Entry around 76.0 with an upside target at 93.0. Trade idea for short- to medium-term move.

RAYA : A potential investmentWeekly chart, the stock EGX:RAYA is drawing an ascending broadening pattern.
Direction: long term uptrend
There is a resistance zone between levels 3.55 and 3.74
Crossing up this zone, the price will target 5.00
Another tough resistance is the pivot line (around 4.10 - 4.20 : moving up)
Further long-term targets: 5.75 , 5.90
Stop loss: 3.20
Techn. indicators:
MACD: Positive
RSI: Minor correction

ODIN to target 3.4 after crossing 2.3Weekly chart,
for long term investment under the condition the stock closed above 2.30 for 2 weeks.
MACD is positive,
while RSI is showing over-bought - so, a minor correction is probable before the stock overcomes the resistance zone at 2.25 - 2.30
After crossing 2.30, the next resistance levels will be 2.60 - 2.65 , then 3.00 and 3.40
A new buy is after crossing, or at present value around 2.18 - 2.24 with near Stop Loss (2.16)
NOTE:
--- Be cautious with this stock, protect your profit as the price goes up.

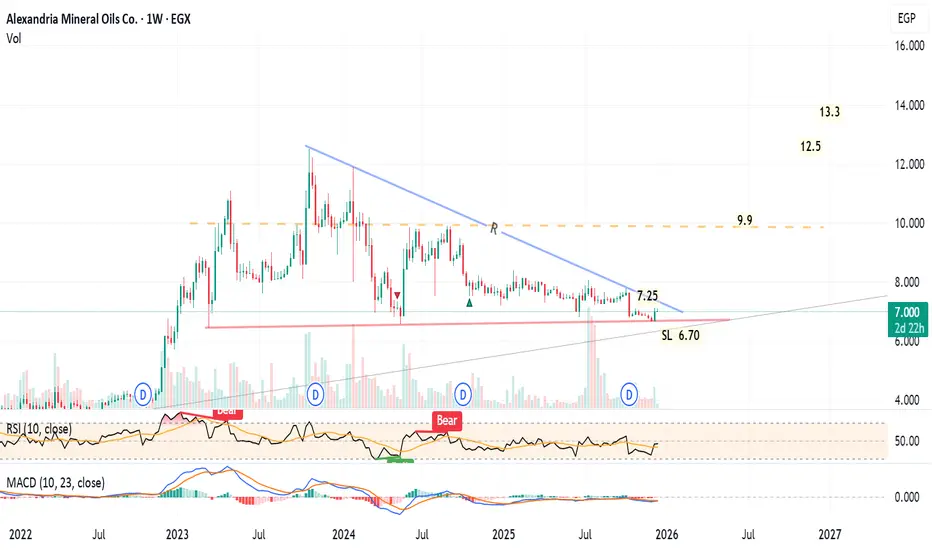
AMOC - Conditional 9.9 and 13.3 with cautiousWeekly chart,
I can see a descending triangle pattern. The technical indicators: RSI is neutral, MACD is under 0 line. So, new entry should be after closing above 7.25 with high volume for 2 weeks.
The medium and long term targets will be 9.9 then 13.3 passing through some resistance levels including 11.9 and 12.5
Stop loss is 6.70, and raise the profit protection level as the price goes up.
MBEG to target 3.62 after crossing resistanceDaily chart, the stock EGX:MBEG is drawing a technical pattern, and is expected to test the upper blue line, at 3.06. After crossing this level, the next target will be 3.62
Note- a stop loss (SL) level should be raised while getting upwards. Currently, SL at 2.65
RSI is positive, while MACD is still not confirming a new entry. So, watch out the profit protection / SL level.

EGX30 performance summary for October: Weak market breadth withOctober Market Performance Summary: Weak Market Breadth with Strong Liquidity Concentration
#TechnicalAnalysis #EgyptianExchange #EGX30
A deep technical dive into the market's internal data for October reveals a clear divergence between the overall market performance and the movement of concentrated liquidity. Here are the details:
Overall Market Sentiment: Mixed with a bearish bias. The number of declining stocks exceeds the number of advancing stocks, yet the bearish momentum is weak, and liquidity is selectively concentrated.
Detailed Analysis
Market Breadth
Breadth Statistics:
Advancing Stocks: 11
Declining Stocks: 19
Interpretation: The market breadth is negative, indicating that the majority of the index's stocks declined during October. This reflects a general weakness in performance.
Despite the higher number of declining stocks, the bearish momentum is very weak, and there is no acceleration in selling pressure, which signals a neutral short-term outlook.
Most Influential Stocks on the Index:
Positive Impact: COMI (+0.11%), ORAS (+0.11%)
Negative Impact: EAST (-0.22%), BTFH (-0.15%)
Interpretation: The index's movement is primarily driven by specific leading stocks. We note that the negative impact of the top losers is stronger than the positive impact of the top gainers, which explains the index's tendency towards weakness despite the rise of some strong stocks.
Stocks with the Highest Trading Value:
Top Stocks by Trading Value: COMI (15.5%), ETEL (10.62%), HRHO (10.6%)
Interpretation: Trading value is highly concentrated in a few leading stocks. These three stocks alone accounted for more than a third of the total market trading value, indicating selective investor interest.
Liquidity Flows:
Major Inflows (In Δ):
ORAS: +2.36B
JUFO: +774.94M
Interpretation: There is a massive and targeted inflow of buying liquidity into ORAS in particular, indicating strong and specific interest in this stock, contrary to the general market trend.
Major Outflows (Out ∇):
PHDC: -2.005B
ORHD: -829.02M
Interpretation: Conversely, other stocks like PHDC are experiencing significant liquidity outflows, reflecting strong selling pressure or concentrated profit-taking activities.
Conclusion and Takeaways
The market's performance in October reveals a "split market" phenomenon. While the general breadth (advancing vs. declining stocks) shows clear weakness, we find that smart money is flowing strongly and selectively into specific stocks (e.g., ORAS) and out of others (e.g., PHDC).
This implies that the movement is not indiscriminate selling but rather a process of repositioning and rotating liquidity between sectors and stocks. The stability of the momentum indicator near the zero line supports the idea that the market is in a wait-and-see mode rather than an accelerated decline.
For the Investor: It is crucial to monitor these concentrated flows as they are often an early indicator of the stocks and sectors that may lead the market's future movement.
Recap Egypt has bullish indicatorsDaily chart,
I expect the price EGX:REAC will continue to form a triangle chart pattern.
Technical indicators RSI and MACD are positive, and showing a bullish movement - i.e. A soon breakout
However, I think after a rally of 7 consecutive green candlesticks, a minor correction should happen to test the support line S.
Then, a rebound to test the upper resistance line R. The breakout can be around 8.50 - 5.45
After crossing R (and stabilizing for 2 days with high volume), the target will be 10.90 passing through a resistance level at 9.35
Stop loss below 8.40 should be considered.
2nd Scenario : Direct crossing up, no correction, and the target will be 11.25
Raise the stop loss / profit protection level as the price goes up.

KRDI Egypt is expected to target 0.750 after crossing 0.608Daily chart,
The stock EGX:KRDI is rebounding to enter the rising channel. Once above the rising trend line (around 0.607), the target will be 0.750 to 0.760 passing through resistance level at 0.658
Technical indicators:
RSI: positive
MACD: About to cross up the signal line
Entry (buy) can be made now at 0.590 - 0.597, and consider a stop loss below 0.580
Safer to enter above 0.608 after the breakout (crossing up) confirmation.

Misr Cement Qena should target 29.5 then 36.0 and 38.0Daily chart,
the stock EGX:MCQE has formed a triangle chart pattern, and the target is 36.0 then 38.0
29.5 and 32.9 are resistance levels.
Technical indicator MACD is positive and crossed its signal line.
RSI is showing a probability to have a minor correction before resuming the bullish movement.
Closing below 26.5 - 26.0 for 2 days should be a stop loss level on the daily time frame.
Note : New buy entry after 28.8 (2 days close) or around the support zone 26.5 - 26.0

TAQA Arabia Egypt - To target 13.2 after crossing ResistanceDaily chart,
the stock EGX:TAQA is trading in a rising channel, the price reached the support and is supposed to rebound upwards to target the Resistance line R at around 13.25
Consider the new entry Buy above 12.25 (2 days close) for more safety, or buy in parts down to 12.0
Stop loss below 12.00 (for 2 days) should be considered.
Note:
Closing above the Resistance line R for 2 days, the next target will be 14.3 passing through resistance level at 13.5

Dice Egypt to be monitored for a new entry - Good opportunity!Daily chart, the stock EGX:DSCW broke the lower trend-line of the rising wedge pattern. So, technically this bearish movement should test the pattern target 2.15
However, there are near relatively strong support cushion at 2.45 - 2.42, then a support level at 2.24
A new entry (buy) can be made after 2 days close above 2.51 with high volume, to target 2.75 to 2.80 (then 3.05)
Stop loss below 2.40 should be considered.

Arab Moltaka Egypt can be an investment to 4.90Weekly chart, EGX:AMIA
The price crossed up a major resistance line R, and is testing it.
In case of trading above 3.06 with high volume for 2 weeks, the target will be 4.90 passing through strong resistance 3.57 (last highest High), then a psychological barrier 4.00
Stop loss below 2.65
Technical indicators:
RSI is on a bullish trend, at 62
MACD is positive

KRDI Egypt is expected to target 0.65 then 0.75Daily chart,
the stock EGX:KRDI has been trading above a rising trend line since Oct 2024. I see the price will rebounce from the current level 0.600 to test the resistance line R1.
After crossing R1 line at around 0.650 - 0.658, the next target will be R2 (around 0.750 - 0.760).
Technical indicators: RSI and MACD still need confirmation for a new entry (buy)
Note: A Resistance level at 0.670
Consider Stop Loss below 0.600 (closing)

NEDA Egypt should target 3.65 then 4.25Daily chart,
the stock EGX:NEDA formed a pennant chart pattern and is forming another smaller pattern.
I am expecting some minor correction and consolidation around 3.10
Then, a bullish movement towards the resistance line R, at around 3.64 - 3.67
Stabilizing for 2 days above 3.70, will push the price to the next target 4.25
Note the resistance levels at 3.27, 3.44 , 3.56
(Closing below 3.10 for 2 days should be considered a near stop loss level)

EMFD Egypt should be targeting 9.001-hour chart
The stock, fell from 9.50 to 7.62, and rebounded to 8.60, then it is under minor correction in the bullish direction.
A new entry Buy will be after closing above 8.40 for 2 hours, the target will be 8.70 then 9.00
Also, buying in parts from 8.30 to 8.24 is OK with a higher risk and higher profit.
Consider a stop loss level below 8.23

COMI Egypt can exceed 104 in 6 monthsWeekly chart,
The stock EGX:COMI has formed a symmetrical triangle chart pattern, and crossed the Resistance line R.
One more week above R, to confirm, the target will be 104.3 - passing through several resistance levels as shown on the chart.
A new entry (buy) can be made immediately before confirmation with higher risk, and consider a stop loss below 76.0
Technical indicators RSI and MACD are positive.
NOTE: Keep a near Profit Protection/ Stop Loss level.

RAYA Egypt may go bullish towards 5.30 !Weekly chart,
I see a pre-formation of a widening rising wedge pattern, and the stock EGX:RAYA is preparing to go on a bullish movement towards the upper line R
There is a very strong resistance level at 3.00, then resistance levels at 3.60 and 3.74
(At each resistance level, be careful with your profits!)
The technical confirmation is closing 2 weeks above 2.45 for a new entry (buy)
Long Term Targets 4.00, 4.30, 4.50, 5.00, 5.30
Note: Stop Loss should be considered below 2.30 - 2.27

ICID Egypt - A bullish long-term patternWeekly chart,
The stock EGX:ICID is trading inside a symmetrical triangle pattern between Support and Resistance lines (S and R)
The technical indicator RSI can be seen as drawing the same pattern (waiting for crossing up the R RSI line as a confirmation).
MACD is crossing up its signal line.. However, it is still technically negative.
So, I can expect a new bullish movement towards the Resistance line (at around 4.45)
Crossing up the R line and trading above it for 3 weeks - with high volume, the long term target will be 7.45
NOTE: Consider a near profit protection / stop loss level for this stock, as it is volatile and impulsive!

MM Group Egypt - Quick trading between S & R lines 1-hour chart,
the stock EGX:MTIE is trading in a rising wedge. While this is a bearish chart pattern, we can trade between the support and resistance lines (7.60 - 8.00) for the next few weeks - or until breaking either boundaries.
In case of:
closing 3 hours below line S, the target will be 7.10
closing 3 hours above line R, the target will be 8.66
A near stop loss level should be considered.

Arabian Cement has a potential to 24 then 25.61-hour chart,
the stock EGX:ARCC is trading in a channel, between support level at 22.4 and resistance level at 24.0
The technical indicators RSI, Stochastic are signalling a positive direction towards the upper line R.
Closing above 24.0 for 3 hours with high volume, the next target (TP - Take Profit) will be 25.6
(Fibonacci extension to 26.6)
Consider a stop loss below 22.2
