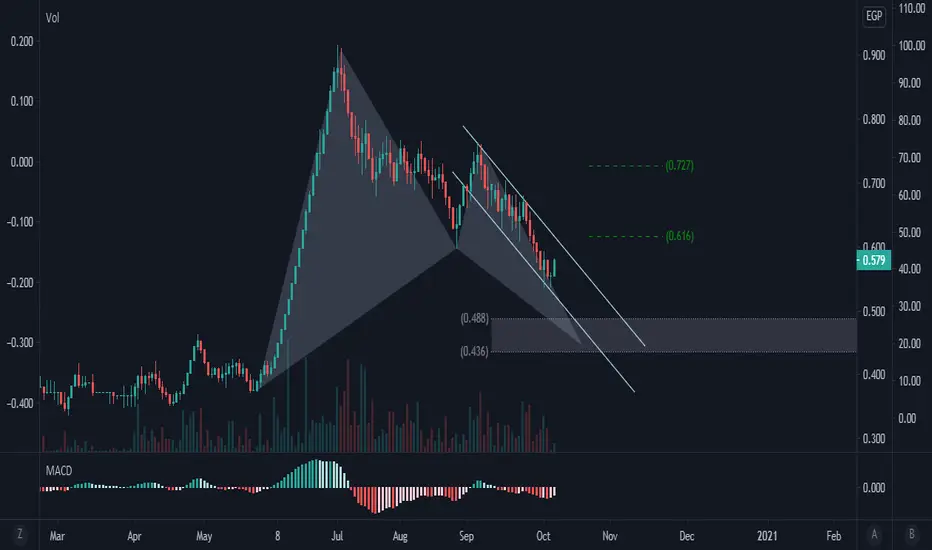
AIFI.CA / EGYPT Technical Analysis 07/08/2021AIFI is working on a newly formed uptrend and formed a trending channel , it is seen clearly by consequent higher highs and also higher lows , trending AIFI is also seen by nice cross over by 7&14 EMA , this stock is working for a first target of 0.496 L.E
support level is 0.299 and first resistance level is at 0.346 then 0.39
Stop Loss level can be at 0.305
Have a nice trending AIFI
EGX30

Way to go!! Hello dears
Today I would like to share my idea with you about EGX30 .. weekly timeframe
What I am searching for right now are three:
1. Strong candlestick with a high volume that will assure me that bulls come again
2. Breaking the descending price channel
3. Breaking the supply area
By achieving the past three conditions we will see 13000 and 16000 as a next targets
Let's see what will happen in the next few weeks .. thanks for reading ❤️

COMI | CIB | EGX30 | june 17 , 2021update of the previous technical analysis #Commercial_International_Bank #Egyptian_Exchange!

comi | CIB | egyptCommercial International Bank | Egypt | Technical analysis
A symmetrical triangle is observed on the weekly chart.
Calls for further decline
Note that the pattern is inside the big megaphone pattern !!
The target of the symmetric triangle is 52,000
And the support of megaphone pattern @ 49,000-48,000

EGX 30 toward 9700, then bounce upEGX 30 still under pressure sold, this paves the road toward 9700, if this level resist, it may bounce up again, else may see 9500
waiting to reach 9700 level is highly recommended, accordingly we could put our entering plan

Trade technical Plan for FWRY stock This is my view on the trade plan for FWRY stock.
the stock is in a strong uptrend and it shows strong potential to continue this strong uptrend.

MY trade idea for ISMA stockStock ISMA is showing a strong reversal pattern and can be traded as shown.
my idea is to enter at the break of the pattern "which it did on 22th of April" and my stop is below 5.5.
The initial target is at 7.2 (around 22% price move) and then exit and wait for the next pullback.

CIB harmonic pattern- Type 2 return correctionExpecting a type 2 return to the levels of 52 to setup for Type 2 target

chart show how TMGH is identical with EGX 30 index the idea showing regardless TMGH is financially strong, its stock shall follow the market index


Idea to buy in FWRYA Thought of a buy trade
Support shows a good opportunity to buy
SL/TP based on previous point

Next major move in 2021Next major move for HRHO is long TP1 TP2 TP3 TP4 and SL On chart good luck everyone


-1EGX30@15.2K OPEN SHORT (15.2K-11.0K) PL: +4.2K(+28%)Short position is still open from March 2019.
EGX symbols are pretty interesting to study, the lack of HFT firms is probably the main reason for the perfect alignment with the symbol's fundamental health.
The mega industrial boom generated massive investors interest during the past 4-5 years, followed by the COVID crises, EGX suffered major damage however, our short position was already open at Mar 2019 on an acute divergence of all differential oscillators, targets were set to 11K-9K, however, recent events made things a little bit more interesting.
Price should hover over the 10K mark for a while, we expect another leg down (9K-7K) before any move upwards, hopefully we don't see a new minimum.
It makes me always wonder weather fundamentals draw the charts, or do charts actually predict fundamentals..
Happy Trading!


$EGX30 a threat to break the uptrend$EGX30 a threat to break the uptrend that was created 17 years ago.
EGX30 is the major index of Egypt stock exchange which showed uptrend from 2002
two major technical sign for downside Head and two shoulders


EGX30 - Egyptian Stock Market - weekly chartA negative Elliot wave scenario for EGX30 under 11000 may go down to 7800 as a first target then down to 6000 but above 11000 will cancel this scenario
Sell in May and go away

EGX30 target 7000depending on- monthly trend line for EGX30 and Fibonacci retracement, expected to see EGX30 test 7000 and then bounce.
as now EGX 30 RSI14 oversold while still, the market does not have enough confidence to buy.
