EIGENUSDT — On the Edge of Major Reversal from Accumulation ZoneEIGEN currently stands at the edge of a cliff — right above its major accumulation zone between 0.76–0.66, an area that has acted as a strong demand base since March 2025.
This is a decisive moment: will we witness a macro reversal formation or a continuation of the downtrend?
After a steady decline since October, price has returned to the same demand zone where smart money previously absorbed heavy sell pressure.
The long lower wick seen here suggests a liquidity sweep, a classic signal of accumulation before a potential bullish reversal.
Structurally, the market is still in a short-term downtrend — but the combination of oversold conditions and strong horizontal support makes this zone extremely important for a possible rebound.
---
Bullish Scenario
If the 0.76–0.66 zone successfully absorbs selling pressure again and a bullish rejection candle forms with notable volume,
then EIGEN could initiate a multi-stage rebound toward:
Target 1: 1.03
Target 2: 1.42
Target 3: 1.60–1.95
Extended target: 2.40
A decisive 2D candle close above 0.85–0.90 would serve as a strong confirmation of bullish strength and potential trend reversal.
---
Bearish Scenario
If price breaks and closes below 0.66,
A lower low structure will form, confirming continuation of the downtrend.
The next potential support lies around 0.526, aligning with a previous swing low.
Any failed retest of 0.66 as resistance after breakdown could trigger another leg lower.
---
Pattern & Market Structure
This chart highlights a broad accumulation range at the base of the trend — potentially the early stage of a Wyckoff accumulation phase.
The yellow zone may act as the spring point, where liquidity is flushed before a major markup.
However, if sellers maintain dominance, this same zone could transform into a redistribution area before further decline.
---
Strategy & Risk Management
Conservative entry: Wait for a confirmed bullish candle closing above 0.76–0.80.
Aggressive entry: Gradually scale in between 0.70–0.75 with a stop below 0.64.
Take profit levels: Align with resistance zones (1.03, 1.42, 1.60+).
Breakdown play: Wait for a 2D close below 0.66 and short on retest failure.
Risk control: Keep total risk per trade under 1–2% of capital.
---
Core Narrative
EIGEN is now at a make-or-break zone.
This is the last stronghold for buyers — and possibly a golden opportunity for traders waiting for a clear directional bias.
A bullish reversal here could ignite a multi-week rally, attracting attention across the market.
But a decisive breakdown below the range could mark the start of a capitulation phase toward deeper lows.
---
Conclusion
The 0.76–0.66 zone represents the heartbeat of EIGEN’s current market cycle.
As long as price holds above it, the probability of a strong reversal remains alive — offering a compelling reward-to-risk setup.
But if the level collapses, traders should prepare for a potential slide toward 0.52 or even lower.
---
#EIGEN #EIGENUSDT #Crypto #Altcoins #TechnicalAnalysis #PriceAction #SupportResistance #SwingTrading #SmartMoney #Wyckoff #LiquiditySweep #ReversalZone #CryptoAnalysis #MarketStructure
Eigen

EIGEN/USDT — The Final Defense: Bulls Hold the Last Demand Zone?EIGEN is once again approaching a critical demand zone around 0.95 – 1.10, a level that has repeatedly acted as the market’s turning point throughout this cycle.
This zone isn’t just a technical level — it’s the final line of defense separating a potential accumulation phase from a deeper breakdown.
After rallying toward 2.0 in early October, sellers regained control, printing a clear sequence of lower highs and pushing price back down into the same historical demand area.
Each touch of this yellow block has sparked aggressive buy reactions, suggesting there are still strong buyers defending this region.
---
Bullish Scenario (Bounce & Reversal)
The bullish outlook remains valid as long as price holds above 1.00 – 1.10.
A clear bullish engulfing candle or a strong rejection wick in this demand zone could confirm a reversal setup.
If confirmed:
Entry: Above 1.20 – 1.25 (confirmation breakout).
Targets:
Target 1 → 1.42 (first key resistance).
Target 2 → 1.60 (mid-range supply zone).
Target 3 → 1.97 – 2.00 (major structural target).
Stop-loss: Below 0.94 – 0.95 (bullish invalidation).
A daily close above 1.60 would confirm a structure shift and re-establish medium-term bullish momentum.
---
Bearish Scenario (Breakdown & Continuation)
If the demand zone fails to hold and price closes below 0.95, sellers could regain full momentum, opening the door for a continuation move toward 0.75 – 0.80.
Bearish confirmation signals include:
A decisive daily close below the yellow zone.
Failed retest around 1.00 – 1.10 (support turning into resistance).
Rising sell volume confirming downward pressure.
Such conditions would likely trigger a bearish continuation pattern, as the liquidity beneath this zone remains largely untested.
---
Pattern & Structure Analysis
Range Accumulation Zone: The 0.95 – 1.10 area has repeatedly acted as a multi-tested demand base for accumulation.
Lower High Formation: Sellers remain dominant since the October peak.
Liquidity Wick Trap: The deep lower wick indicates stop-hunting behavior, often preceding strong reversals or momentum shifts.
Horizontal Resistance Ladder: Step-by-step resistance levels at 1.42, 1.59, and 1.97 will act as key checkpoints for any bullish recovery.
---
Conclusion
EIGEN is standing at a critical battlefield between continued accumulation and a deeper breakdown.
Traders should wait for clear confirmation at this demand zone before committing to any major position.
A daily close above 1.25 reopens the path to bullish recovery,
while a breakdown below 0.95 could accelerate the next bearish leg toward 0.75 or lower.
The upcoming reaction from this zone will likely define EIGEN’s next multi-week trend direction.
---
#EIGEN #EIGENUSDT #Crypto #Altcoin #TechnicalAnalysis #PriceAction #SupportResistance #MarketStructure #SwingTrading #CryptoAnalysis #ChartUpdate

Is Bull Trap ComingWhen people see big red candle they say bull season is lie. when they see big green candle they say bull season is coming. These are the times that you should play for the opposite direction. One last rise and people will think again it is a bull season and will be FOMO
Picture* This comment is belong to me I wrote it about 1 week ago. Thing I mention about fake upwards movement is this. I believe we made good profits from EIGEN we cathed very good profit ratio and this stop is nothing for me now. I will risk it

EigenLayer Daily view| DeFi’s Ethereum Restaking Power💀 Hey , how's it going ? Come over here — Satoshi got something for you !
⏰ We’re analyzing EIGEN on the 1-Day timeframe , this coin ranks 132 on CoinMarketCap. It’s a restaking project on the Ethereum network, highly valued and reputable in the DeFi space, and backed by well-known Ethereum developers .
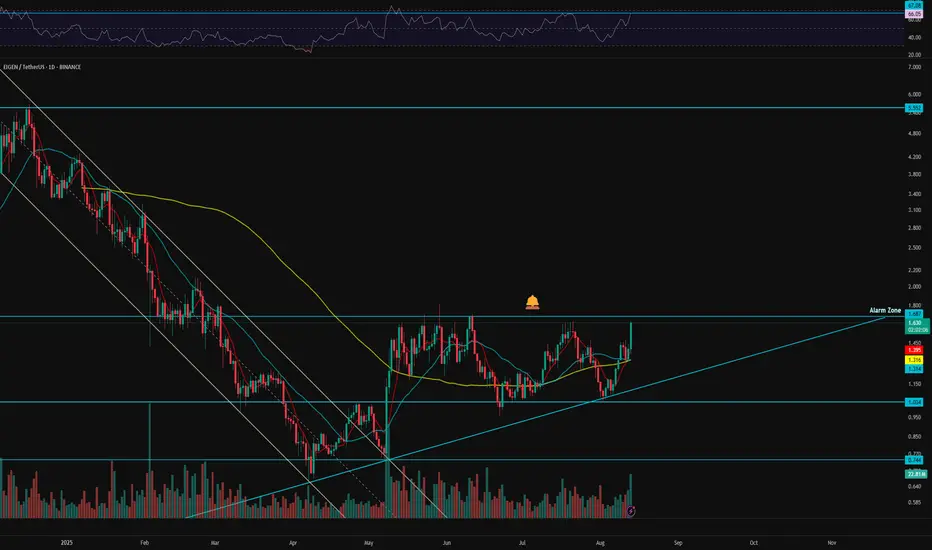
👀 After breaking out of a strong descending channel, this coin moved toward its resistance zone at 1.687 within just three days under strong buying pressure. It was then rejected from this level and formed a bottom at 1.034. This bottom is close to a drawn trendline, and the latest touch of this trendline triggered many buy orders, bringing in significant buying momentum. The key zone for entering a trade is the resistance area that has seen roughly five reactions, each time resulting in rejection. If this daily box breaks, the coin could move to higher price levels.
👑 The 7-day moving average has crossed above both the 25-day and 99-day moving averages, indicating strong buyer power and upward momentum. Moving averages are often used for martingale strategies and as setup confirmations.
⚙️ On the RSI, the key resistance lies around 67.08. A breakout above this level increases the chance of entering the overbought zone, though the major strong resistance is at 70.
🕯 Both trading volume and transaction count are rising, and usually, for coins considered “Ethereum ecosystem projects,” volumes can spike sharply when Ethereum dominance falls.
🔔 We’ve set an alert zone at the 1.687 resistance level. When the price reaches this zone, you can watch the price action and, with confirmation, consider entering a trade.
🖥 Summary : If EigenLayer breaks the 1.687 zone, it could reach much higher price levels. Since it offers a restaking product to the crypto community, it has the potential for strong price surges, as most of its past pumps have happened within just a few candles—even one candle. Don’t forget to set your alert at 1.687 .
❤️ Disclaimer : This analysis is purely based on my personal opinion and I only trade if the stated triggers are activated .
EIGEN Long TryEIGEN acting like it still wants to 1.98 it recovered very quickly unlike the market.
1.98 is a far target MM maybe left it for the next rally's liqudity I am going to give it a try

EIGEN is testing the blue support level📊 $EIGEN Market Update
$EIGEN is testing the blue support level 🔵
Possibility of a breakdown — if it breaks out to the downside with confirmation, there’s a short setup with the first target at the green line level 🎯📉

EIGENUSDT Forming Bullish WaveEIGENUSDT is showing a bullish wave pattern, a strong technical setup that often signals the continuation of an upward trend. This structure reflects market strength, with buyers stepping in consistently to maintain momentum. If the current price action holds, EIGENUSDT has the potential to deliver impressive gains in the range of 70% to 80%+, making it an attractive setup for traders looking for medium- to high-return opportunities.
The volume is healthy, supporting the bullish outlook. Sustained good volume is critical as it validates the trend and provides the liquidity needed for significant upward moves. With market participants showing increased interest in EIGENUSDT, the chances of a strong follow-through rally are much higher, especially as technical indicators align with broader bullish sentiment.
Investor attention around this project is steadily rising, reflecting growing confidence in its fundamentals and technical position. As bullish wave patterns typically unfold in phases, EIGENUSDT may be entering the next leg of its move, where momentum could accelerate sharply. If buying pressure continues to build, the breakout could offer traders a favorable risk-to-reward setup.
✅ Show your support by hitting the like button and
✅ Leaving a comment below! (What is You opinion about this Coin)
Your feedback and engagement keep me inspired to share more insightful market analysis with you!

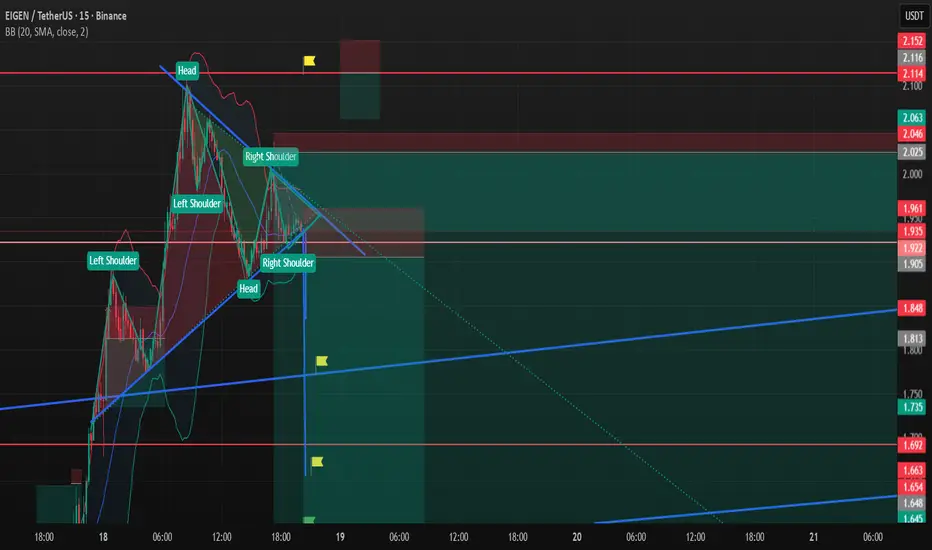
Eigen Short SetupI couldnt publish targets for the last idea it was in rush here I am for the second chart of the same position and also I added a new short position you can follow if you couldnt catch
There is both bullish and bearish head and shoulder formation I assume bearish version will work
Always manage your own risks this is not a investment advise I am not responsible neither your loss nor profit.
Targets
TP1 Blue trendline
TP2 1.658
TP3 1.590
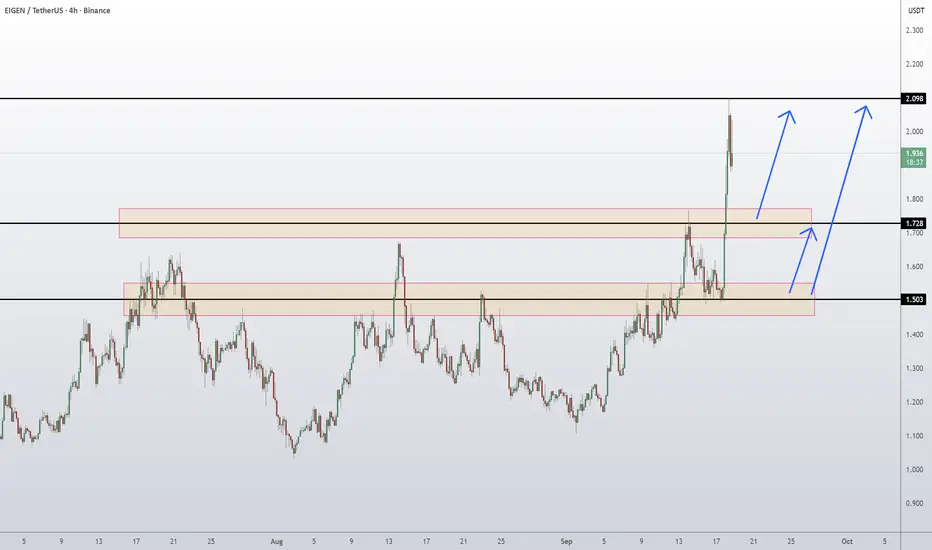
EigenLayer EIGEN Token Price Prediction and Technical AnalysisEIGEN/USDT has broken out strongly, surging from the 1.503 demand base and blasting through the 1.728 resistance zone, extending toward the 2.00 area before stalling. This breakout shows strong bullish momentum, and as long as price holds above 1.728, continuation toward the 2.098 resistance looks likely. A retest of 1.728 could provide a healthy entry, while a deeper correction back into the 1.503 demand zone would still keep the bullish structure intact.
📈 Key Levels:
Buy trigger: Retest/hold above 1.728 support
Buy zone: 1.503 – 1.728 region
Target 1: 2.00 psychological zone
Target 2: 2.098 resistance
Invalidation: Daily close below 1.503 (would weaken breakout structure)
👉 Follow me for More Real Time Opportunities.
Share your Thoughts if you have any?
Eigenlayer EIGEN price analysisLooking at the OKX:EIGENUSDT chart, we can see that the growth amplitude is “choking” and trading volumes are decreasing.
Therefore, at the current price, we would not risk buying #EIGEN
But at $0.90, it's safer! Or at $1.80-1.90, but only after the price breaks through and consolidates above the trend line.
#Eigenlayer is based on the #Ethereum ecosystem and has “come alive” following the price of CRYPTOCAP:ETH
_____________________
Did you like our analysis? Leave a comment, like, and follow to get more

#EIGENUSDT#EIGEN
The price is moving within a descending channel on the 1-hour frame, adhering well to it, and is heading for a strong breakout and retest.
We have a bearish trend on the RSI indicator that is about to be broken and retested, which supports the upward breakout.
There is a major support area in green at 1.46, representing a strong support point.
We are heading for consolidation above the 100 moving average.
Entry price: 1.55
First target: 1.61
Second target: 1.67
Third target: 1.74
Don't forget a simple matter: capital management.
When you reach the first target, save some money and then change your stop-loss order to an entry order.
For inquiries, please leave a comment.
Thank you.

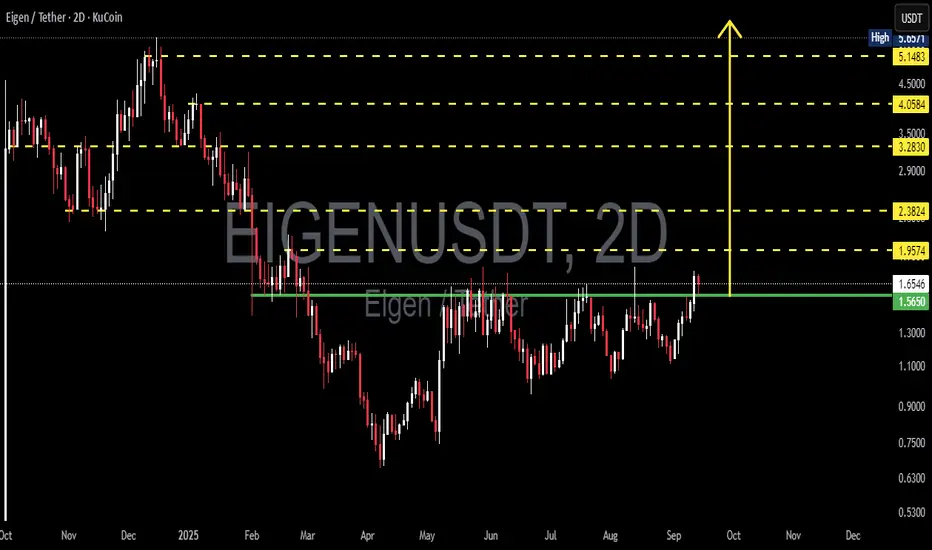
EIGEN/USDT — Critical Breakout: Start of a Major Reversal?🔎 Full Narrative Analysis
EIGEN/USDT is currently at a very decisive moment. After a long downtrend from late 2024 into early 2025, the price formed a solid bottom around 0.60–0.70 in April. Since then, the market has been showing signs of accumulation, building a sequence of consistent higher lows.
The 1.56–1.66 zone has acted as a major resistance for nearly 5 months. This level has been tested multiple times but never convincingly broken — until now. Recently, the price managed to break above this historical barrier, suggesting the first signs of a potential trend reversal.
However, the breakout is not fully confirmed yet. The recent wick rejection from 1.95 shows that sellers are still defending that area. This puts EIGEN at a crossroads: will this be the beginning of a new bullish trend, or a false breakout leading back into the old range?
---
📌 Technical Pattern
Inverse Head & Shoulders (iH&S) setup
Head at 0.63 (April low)
Neckline at 1.56
If confirmed, the measured target sits around 2.50
Range Breakout: Price has finally escaped the May–August consolidation range. Retesting 1.56–1.66 as support will be key confirmation.
---
🚀 Bullish Scenario
1. Price holds above 1.56–1.66 and flips it into strong support.
2. A decisive breakout above 1.95–2.00 confirms continuation of the bullish leg.
3. Upside targets:
2.38 (intermediate resistance)
2.50 (iH&S measured move)
3.28 (next psychological resistance)
If momentum across the crypto market strengthens, possible extension to 4.05–5.14.
---
⚠️ Bearish Scenario
1. Failure to hold above 1.56 would turn this breakout into a false breakout / bull trap.
2. In this case, downside pressure may drag price back toward 1.10–0.90, and possibly even retest the lows near 0.60–0.70.
3. This would prolong the consolidation phase before any real reversal.
---
🎯 Trading Plan (for swing traders)
Aggressive entry: around 1.65 with stop loss below 1.35.
Conservative entry: wait for a clean retest of 1.56–1.66 or a confirmed breakout above 1.95.
Take profit levels: 1.95 → 2.38 → 2.50 → 3.28+.
Use trailing stop to lock in profits as price progresses to higher levels.
---
📝 Conclusion
EIGEN is at a make-or-break stage: will the accumulation phase since April finally result in a rally towards 2.5+ and beyond, or will the market reject this breakout and push price back into its previous range?
The 1.56–1.66 zone is the battlefield. As long as price holds above it, the mid-term outlook remains bullish. But if rejected, be prepared for a deeper pullback.
---
#EIGEN #EIGENUSDT #CryptoAnalysis #Altcoin #Breakout #InverseHeadAndShoulders #SwingTrading #TechnicalAnalysis #CryptoSetup
EIGENUSDT Chart Signals Huge Upside!EIGEN has been consolidating in an ascending triangle pattern for several months, with rising lows meeting a flat horizontal resistance zone. This structure typically signals strong bullish pressure building up over time, as buyers consistently step in at higher levels.
Currently, the price is testing the upper resistance trendline around $1.65–$1.70. A breakout and daily close above this zone could confirm the start of a major bullish leg, with the potential to push prices significantly higher. The volume profile also shows a large gap above this area, which means price could move quickly once resistance is cleared.
Key Points
- Ascending triangle formation visible on the daily chart
- Strong resistance around $1.65 – $1.70
-Breakout above resistance could trigger strong momentum
- Volume profile suggests less supply above current levels
Trade Setup
- Entry: On breakout and daily close above $1.70
- Stop-loss: ~$1.10
Targets: 50%-200%
Cheers
Hexa

EIGEN Breakout Confirmation, Eyes on 2.20+$EIGEN has broken above a key resistance zone, signaling a shift in momentum. The breakout comes after weeks of consolidation with strong support holding at the ascending trendline.
Trade Setup
Entry: Around current breakout levels
Stop Loss: Below 1.33 (trendline support)
Targets:
TP1: 2.20
TP2: 2.86
TP3: 3.78
TP4: 5.27
As long as price holds above the reclaimed zone, the structure favors bulls with upside targets in play.
DYOR, NFA
#PEACE

Short Setup EIGEN My former analysis about eigen failed. actually ı dont strongly believe price will git my entry but anyway if it hit it will be a good short place

EIGEN SHORT TERM be careful for trigger if it not triggered do not enter cause here is a bit critical under that line we may see a bearis movement Above white support eigen still chance to rise but my main target feels like a bit far so you may want to close some at tp 1
Always manage your own risks this is not a investment advise I am not responsible neither your loss nor profit.

BROAD PICTURE OF EIGENHı guys how are u? I assume that you are good after the last rally analysis of EIGEN.
I made this chart not for direction but for possibilities. Green support line is a only assurance of me, under that line it is very hard to take risk for bull season. I believe green direction arrows will work and we will see a huge movements after red resistance zone. for now take care.
I shared this post not because it is a well staged setup but motivation for myself.
So always manage your own risks, My charts are not investment advise

RALLY IS COMING!!!EIGEN will give you at least %25 in this month LOOK AT THE CHART AT THE BELOW one last liquidation and market will blast
I will go for this with lax stop loss if there will be strong bullish candle I thinl it wont be a manipulation. If not there will be a huge loss for me and I accept that
Always manage your own risk do not take this as a investment idea
YOU MAY NOT WANT TO WAIT TILL THE PRICE EXACTLY HIT YOUR ENTRY ORDER WATCH THE CHART.

Possible Second Entry For Those Who TP Or MissI hope you didnt miss the %16 profit, I warned you.ıf this entry fail I will wait my main support which is labelled as green.White line at the below is a strong support if eigen stay below it, rally is cancelled.
Always manage your own risks this is not a investment advise I am not responsible neither your loss nor profit.

EIGENUSDT Forming Bullish WaveEIGENUSDT is developing a bullish wave pattern, a strong continuation setup that often signals the next stage of upward momentum in trending markets. The formation indicates that buyers are gradually taking control, pushing the market into a more favorable position for a significant rally. With price action aligning with this bullish structure, expectations point toward a potential 70% to 80%+ gain once the breakout phase is confirmed.
Volume activity remains healthy, which is a critical element in validating this pattern. Sustained buying pressure reflects genuine interest from market participants, suggesting that the breakout could carry strong momentum. If this volume trend continues, EIGENUSDT may accelerate quickly, offering traders and investors a high-probability opportunity for sizable returns.
Market sentiment is also turning increasingly positive toward EIGENUSDT, as more investors recognize the coin’s potential for growth. The bullish wave setup combined with rising demand indicates that traders are positioning themselves early to benefit from the expected move. This growing attention further boosts liquidity and market stability, which helps support a more sustainable uptrend.
Overall, EIGENUSDT is presenting a technically strong case for a bullish continuation. With its bullish wave pattern, supportive volume, and expanding investor interest, the coin is poised for a potentially powerful breakout. Traders should keep a close eye on price action around key resistance levels, as a confirmed breakout could unlock significant upside potential.
✅ Show your support by hitting the like button and
✅ Leaving a comment below! (What is You opinion about this Coin)
Your feedback and engagement keep me inspired to share more insightful market analysis with you!

EIGEN Analysis (8H)The price seems to be in the corrective wave B, likely in the final corrective sub-wave of the larger wave B. From the green zone | which is a flip zone overlapping with the trendline | we expect a rejection to the upside, initiating wave C.
We are looking for buying opportunities around the green zone.
The targets are marked on the chart.
A daily candle closing below the invalidation level would nullify this analysis.
For risk management, please don't forget stop loss and capital management
When we reach the first target, save some profit and then change the stop to entry
Comment if you have any questions
Thank You

I am still bullish on EIGEN I am still bullish on EIGEN market just need some break I will go for this
I think it is B or C quality setup as well the RR is not seeming good so I will manage my margin in the account of this
I shared this post not because it is a well staged setup but motivation for myself.
So always manage your own risks, My charts are not investment advise

Memorized Trauma Pattern By BayırKurdu03.08.2025 Eigen chart at he below that day I quit early from that coin and blamed myself. So now it may be a chance to fix it I will give it a shot. I think it worth to risk some money after taking a good profit from the former analysis
