ELI LILLY The key 18-month pivot that will decide the trend.Eli Lilly (LLY) has been consolidating since late November 2025 and that's partly thanks to holding its 974.00 Support. That Support was previously a Resistance that was formed after the mid-August 2024 High. Essentially it is a Pivot trend-line that turned from a Resistance to a Support.
As long as it holds, and naturally the 1D MA100 (red trend-line) that sits directly below it, the stock should complete another +38.68% Bullish Leg at least, targeting $1350.
If the stock closes a 1W candle below the Pivot and the 1D MA100, we expect another -36% decline (like late 2024 - 2025), targeting the 1W MA200 (orange trend-line) at $726.50.
It has to be noted that a 1W RSI Lower Highs Bearish Divergence weighs the price more towards the downside.
---
** Please LIKE 👍, FOLLOW ✅, SHARE 🙌 and COMMENT ✍ if you enjoy this idea! Also share your ideas and charts in the comments section below! This is best way to keep it relevant, support us, keep the content here free and allow the idea to reach as many people as possible. **
---
💸💸💸💸💸💸
👇 👇 👇 👇 👇 👇
Elilillysignals

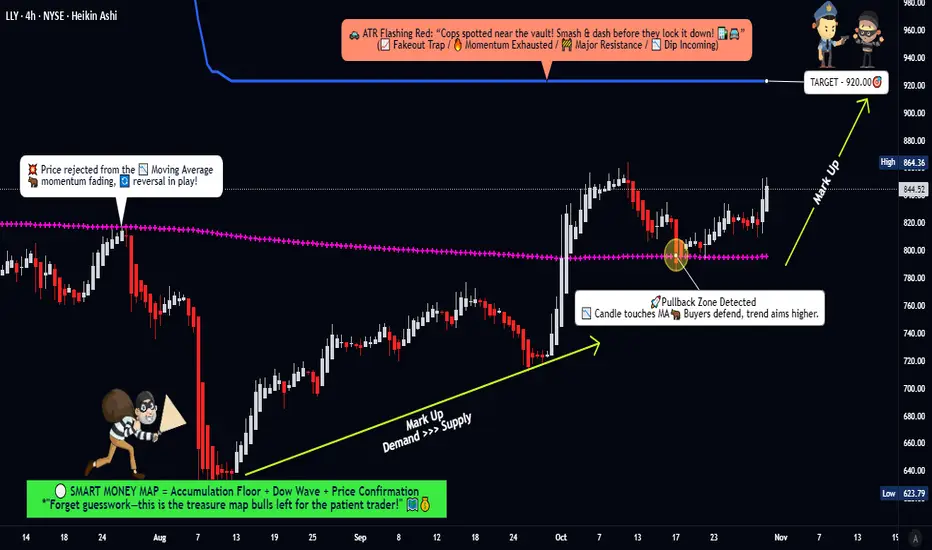
LLY Market Blueprint – From Pullback Base to Profit Zone🎯 LLY Stock Market Heist Plan 🏦💰 | Swing Trade Setup
📊 Asset Overview
Eli Lilly and Company (LLY) - NYSE
Pharmaceutical Giant | Market Cap Leader
🔍 The Setup: What We're Seeing
The chart is screaming opportunity! 🚨 LLY is showing classic bullish pullback behavior with strong accumulation zone activity. We've got:
✅ Accumulation Zone Pressure - Big money is quietly loading up
✅ Weighted Moving Average Breakout & Retest - Technical confirmation ✓
✅ Bullish Momentum Building - The spring is coiling for the next leg up
🎯 The Thief's Game Plan
Entry Strategy: The Layered Approach 🪜
You've got two options here, fellow thieves:
Option 1: Simple Entry
→ Any current price level works if you're confident in the setup
Option 2: The Thief's Layered Entry 🧠
This is where we get tactical. Use multiple limit orders to ladder into the position:
Layer 1: $780
Layer 2: $800
Layer 3: $820
Layer 4: $840
You can add more layers based on your capital and risk tolerance. This approach averages your entry and reduces timing risk.
🛑 Risk Management: The Escape Hatch
Stop Loss: $760
⚠️ Important Note: This is MY stop loss level based on my risk tolerance and analysis. You are the captain of your own ship! Set your SL based on YOUR risk appetite. Make money, take money - but do it at your own risk. 🎲
💰 Target: The Vault 🏦
Take Profit: $920
Here's the situation: The ATR line is sitting at $920 acting like a police barricade 🚔. This is a strong resistance zone where:
Overbought conditions likely
Potential trap zone for late entries
Natural profit-taking area
🎯 My Advice: When you reach the vault, grab the cash and RUN! Don't get greedy.
⚠️ Another Important Note: This is MY target. You make your own rules. Scale out, hold longer, take profits earlier - whatever fits YOUR trading plan. This is your heist, not mine! 💼
📈 Related Pairs to Watch
Keep these on your radar for correlation and broader market context:
Healthcare/Pharma Sector:
NYSE:JNJ (Johnson & Johnson) - Healthcare bellwether, moves often correlate
NYSE:UNH (UnitedHealth Group) - Health sector leader, shows sector strength
NYSE:PFE (Pfizer) - Direct pharma competitor, industry sentiment gauge
NYSE:ABBV (AbbVie) - Biopharmaceutical peer, similar market dynamics
Market Context:
AMEX:SPY (S&P 500 ETF) - Overall market direction matters
AMEX:XLV (Health Care Select Sector SPDR) - Sector health indicator
Key Correlation Points:
LLY often leads pharma sector during strong diabetes/obesity drug cycles
Watch NYSE:JNJ for defensive rotation signals
AMEX:SPY correlation increases during risk-on markets
AMEX:XLV breakouts often precede individual pharma stock runs
🎭 The Thief's Philosophy
This setup combines patience (layered entries), discipline (clear stop loss), and calculated risk-taking (defined target). We're not gambling - we're executing a well-planned heist with multiple contingencies.
The market is the vault. The chart is the blueprint. Your risk management is your getaway car. 🚗💨
Remember: The best thieves know when to strike AND when to walk away. Don't fall in love with a position. Take your profits and live to steal another day! 😎
✨ If you find value in my analysis, a 👍 and 🚀 boost is much appreciated — it helps me share more setups with the community!
#LLY #EliLilly #SwingTrading #StockMarket #TechnicalAnalysis #NYSE #PharmaStocks #BullishSetup #TradingStrategy #ThiefStyle #LayeredEntry #RiskManagement #PriceAction #MovingAverage #AccumulationZone #HealthcareStocks #TradingIdeas #StockTrading #ChartAnalysis #MarketHeist
Eli Lilly Hits $1 Trillion Milestone on GLP-1 BoomEli Lilly & Co. (NYSE: NYSE:LLY ) briefly crossed the $1 trillion market-cap threshold, becoming the first health-care company in history to reach the valuation. Shares traded around $1,059 as demand for its GLP-1 weight-loss and diabetes drugs exploded, driving extraordinary revenue growth and solidifying its global leadership.
Historic Breakthrough for Health-Care
Eli Lilly’s rise into the trillion-dollar tier places it beside mega-caps typically dominated by technology firms. Its 36% year-to-date surge has been powered by transformative changes in global health trends, particularly the widespread adoption of GLP-1 therapies. Investors see Lilly as the clear frontrunner in a market undergoing rapid medical, cultural, and financial shifts.
Mounjaro and Zepbound Drive Massive Revenue
Third-quarter earnings highlighted unprecedented growth:
Mounjaro: $6.52B revenue (+109% YoY)
Zepbound: $3.59B revenue (+184% YoY)
These drugs are expanding faster than nearly any product in pharmaceutical history. Analysts expect continued momentum as insurance adoption widens, regulatory approvals expand, and Lilly prepares to launch oral GLP-1 versions—an innovation that could reshape accessibility.
Legacy of Innovation
Founded in 1876, Eli Lilly has delivered breakthroughs for a century—from insulin to Prozac to early polio vaccines. But its modern dominance began in 2022 when tirzepatide (Mounjaro) gained approval, offering dual-hormone therapy that reshaped diabetes and weight-loss treatment. Zepbound extended that dominance into obesity care, capturing global demand at scale.
Rivals such as Novo Nordisk and Pfizer are accelerating efforts, with the obesity-drug market expected to exceed $150 billion by the 2030s. Still, Lilly maintains the strongest growth trajectory.
Technical Outlook
LLY trades at all-time highs after breaking above the $969 resistance zone. Price action remains firmly bullish, targeting psychological levels at $1,100 and $1,200. Any retracement should find support at $969, keeping the broader uptrend intact.

ELI LILLY to soon start a correction towards $700.Eli Lilly (LLY) has made new All Time Highs (ATH) this month, extending the impressive rally since the August Low near the 1W MA200 (orange trend-line).
The multi-year trend remains bullish within a Fibonacci Channel Up but practically the stock hasn't gotten out of its range since the July 2024 High, breaking in August below even its 1W MA100 (green trend-line).
This prolonged sideways trading resembles the July 2015 - July 2018 3-year consolidation phase, which broke upwards only after a 2nd test of the 1W MA200. Even the 1M RSI patterns between the two sequences are similar. Based on this (1M RSI), which is about to break above its MA for the first time since July 2024, we are in similar levels as February 2017.
As a result, we expect LLY to start a rather smooth correction towards its 1W MA200 again, targeting $700, where the next long-term buy opportunity may potentially emerge.
---
** Please LIKE 👍, FOLLOW ✅, SHARE 🙌 and COMMENT ✍ if you enjoy this idea! Also share your ideas and charts in the comments section below! This is best way to keep it relevant, support us, keep the content here free and allow the idea to reach as many people as possible. **
---
💸💸💸💸💸💸
👇 👇 👇 👇 👇 👇

LLY Is Overbought ---$615 Put Play**💊 LLY WEEKLY TRADE IDEA — BEARISH PRESSURE BUILDING**
📉 **Sentiment:** Strong bearish lean (70% confidence) — low RSI, high volume distribution.
📊 **Institutional Flow:** 1.7x weekly volume, puts stacking near key strikes.
⚠ **Risk:** Gamma risk + oversold → expect high volatility.
**🛠 Setup:**
* **Direction:** PUT (Short bias)
* **Strike:** \$615
* **Expiry:** 2025-08-15
* **Entry:** \$2.20 – \$2.40
* **PT:** \$3.30 (50-100% gain target)
* **SL:** \$1.20 (\~40-50% loss cap)
📌 **Why?**
* Daily RSI \~20, Weekly RSI \~33 → both falling
* Institutional selling pattern confirmed
* Bearish volume + neutral C/P ratio tilt
💡 *Timing is key — oversold = possible dead-cat bounce before breakdown to \$605 support.*

ELI LILLY Is starting its next big rally.Eli Lilly (LLY) is about to test its 1W MA50 (blue trend-line) following a rebound just below the 1W MA100 (green trend-line). The latter, has been the ultimate market Support since May 2018 (last time it broke below it).
The overall correction since the July 15 2024 High seems like a Bull Flag pattern, no different than all the others after 2018 which only served as healthy rebalancing of an overbought price action.
Based on he 1W RSI in particular and the Bullish Divergence it displayed, the current Bull Flag resembles more the March - October 2019 pattern. Both that and the next one reached their 2.0 Fibonacci extensions.
As a result, our long-term Target on LLY is just below the 2.0 Fib at $1300.
-------------------------------------------------------------------------------
** Please LIKE 👍, FOLLOW ✅, SHARE 🙌 and COMMENT ✍ if you enjoy this idea! Also share your ideas and charts in the comments section below! This is best way to keep it relevant, support us, keep the content here free and allow the idea to reach as many people as possible. **
-------------------------------------------------------------------------------
💸💸💸💸💸💸
👇 👇 👇 👇 👇 👇

ELI LILLY ahead of a 1D Golden Cross targeting $1225Last time we looked at Eli Lilly (LLY) 3 months ago (November 21 2024, see chart below), we've identified the bottom of its 5-year Channel Up and issued a strong long-term buy signal:
Now we are upgrading our Target as the price action turned out to be very similar to the 2nd half of 2020, at the end of which the company witnessed strong growth.
As you can see both 2020 and 2024 patterns have been correction phases in the form of Channel Downs. Even their 1D RSI sequences are similar. A 1D Death Cross paved the way for the bottom soon after and a 1D Golden Cross (Jan 11 2021) confirmed the start of a new phase of growth.
The price is now above the 1D MA200 (orange trend-line) and if it continues to replicate 2021, then we expect this to be a Bullish Leg that will target the 1.786 Fibonacci extension. Our long-term Target now goes from $1135 to $1225.
-------------------------------------------------------------------------------
** Please LIKE 👍, FOLLOW ✅, SHARE 🙌 and COMMENT ✍ if you enjoy this idea! Also share your ideas and charts in the comments section below! This is best way to keep it relevant, support us, keep the content here free and allow the idea to reach as many people as possible. **
-------------------------------------------------------------------------------
💸💸💸💸💸💸
👇 👇 👇 👇 👇 👇

ELI LILLY has at least +50% upside from here.Eli Lilly (LLY) has been trading within a 5-year Channel Up and last week closed below its 1W MA50 (blue trend-line) for the first time since the week of March 06 2023. Despite the bearish pressure of this Bearish Leg since July 15 2024, that last 1W MA50 closing was the previous Higher Low at the bottom of the Channel Up.
The 1W RSI is on a similar level (just below 40.00) with all previous 4 major bottoms and the common characteristic of all was that the stock broke below the 1W MA50 but managed to keep clear and hold the 1W MA100 (green trend-line), practically the most important Support level of the market.
If you want a confirmed buy entry, you might want to wait for yet another Bullish Cross on the 1W MACD (as it happened on all previous bottoms), otherwise this buy opportunity is good to go for at least +58% from the bottom (minimum rise among those 4 Bullish Legs). Our Target is $1135.
-------------------------------------------------------------------------------
** Please LIKE 👍, FOLLOW ✅, SHARE 🙌 and COMMENT ✍ if you enjoy this idea! Also share your ideas and charts in the comments section below! This is best way to keep it relevant, support us, keep the content here free and allow the idea to reach as many people as possible. **
-------------------------------------------------------------------------------
💸💸💸💸💸💸
👇 👇 👇 👇 👇 👇

Eli Lilly's Zepbound: A Game-Changer for Obesity Treatment?In a groundbreaking move that could redefine the landscape of obesity treatment, Eli Lilly has slashed the price of its weight loss drug, Zepbound, by half. But is this simply a strategic business decision, or is it a beacon of hope for millions struggling with obesity? Join us as we delve into the implications of this bold move and explore the potential impact on the future of weight management.
Imagine a world where obesity is no longer a daunting, insurmountable challenge. A world where effective, affordable treatments are accessible to all who need them. Eli Lilly's recent announcement of a significant price reduction for Zepbound brings us closer to that reality.
By making this groundbreaking decision, Eli Lilly has not only demonstrated its commitment to patient access but has also sent a powerful message to the broader healthcare industry. This move has the potential to disrupt the status quo, challenging the outdated policies and practices that have hindered progress in obesity treatment.
As we explore the implications of Eli Lilly's decision, we must consider the broader context of the obesity epidemic. For decades, obesity has been stigmatized and overlooked as a serious medical condition. Many individuals struggling with weight loss have faced limited treatment options and significant financial burdens.
Eli Lilly's move to lower the price of Zepbound could be a game-changer in this regard. By making the drug more affordable, the company is empowering patients to take control of their health and pursue a healthier lifestyle. This could lead to a significant increase in the number of people seeking treatment for obesity, ultimately improving public health outcomes.
However, it is important to note that this is just one step in a larger journey. While Eli Lilly's decision is undoubtedly a positive development, more needs to be done to address the systemic issues that contribute to the obesity epidemic. Policymakers, healthcare providers, and communities must work together to create a supportive environment that promotes healthy eating, physical activity, and access to affordable, effective treatments.
In conclusion, Eli Lilly's announcement of a price reduction for Zepbound represents a significant milestone in the fight against obesity. By making this drug more accessible, the company is not only helping individuals achieve their weight loss goals but also challenging the broader healthcare system to prioritize obesity treatment.

ELI LILLY Recovered all losses from its High! What's next?Eli Lilly and Company (LLY) posted a miraculous bullish reversal in the past 2 weeks, recovering yesterday all of the losses of the brutal correction since its July 15 All Time High. Having rebounded on its 1D MA200 (orange trend-line) while the 1D RSI touched the 30.00 oversold barrier for the first time since February 28 2023, we can claim that LLY's Channel Up now sets eyes for its next Higher High.
This pattern is best illustrated with the use of the Fibonacci Channel levels. After initially holding the 1.0 Fib as Resistance, the 'ceiling' is now the 1.5 Fib extension, basically has been since September 12 2023.
The interesting parameter of this pattern is that every approximately +35.00 to +40.00% rise, the price pulls back or turns sideways (red arc pattern) until it eventually hits the 1D MA50 (blue trend-line).
As the stock completes a +35% rise from the bottom, a little above the 1000 mark, we expect it to turn sideways at best. The target after that is $1200, exactly on the 1.0 Fibonacci level, which is still a modest one, considering that the ceiling is now the 1.5 Fib extension, as discussed above.
-------------------------------------------------------------------------------
** Please LIKE 👍, FOLLOW ✅, SHARE 🙌 and COMMENT ✍ if you enjoy this idea! Also share your ideas and charts in the comments section below! This is best way to keep it relevant, support us, keep the content here free and allow the idea to reach as many people as possible. **
-------------------------------------------------------------------------------
💸💸💸💸💸💸
👇 👇 👇 👇 👇 👇

ELI LILLY Entering consolidation phase. Wait for the buy signal.Last time we looked at Eli Lilly (LLY) was on March 18 (see chart below) and we got the most out of it as we entered after a 1D MA50 correction and got the most optimal value:
Our original target was $1050 calculated according to the % rise of each previous Bullish Leg (+45%) of the +1 year Channel Up but now it appears that the stock won't hit that level during this Leg as we are entering the bottom phase of the Sine Wave.
As you can see on the chart (now on the 1W time-frame), this is where LLY typically pulls-back and consolidates (red Rectangle) until the next Bullish Leg begins near the 1D MA100 (red trend-line).
As a result, we are closing our bottom buy position and turn neutral on LLY until we approach the 1D MA100 again, starting mid-August.
-------------------------------------------------------------------------------
** Please LIKE 👍, FOLLOW ✅, SHARE 🙌 and COMMENT ✍ if you enjoy this idea! Also share your ideas and charts in the comments section below! This is best way to keep it relevant, support us, keep the content here free and allow the idea to reach as many people as possible. **
-------------------------------------------------------------------------------
💸💸💸💸💸💸
👇 👇 👇 👇 👇 👇

ELI LILLY Going to $1050 but after a 1D MA50 correction.Eli Lilly (LLY) has basically turned sideways since the February 16 High. The dominant pattern is a Channel Up since the March 07 2023 Low and can be divided into 3 Bullish Waves that delivered rallies between +45% and +52%. Every time the price hit the 1D MA50 (blue trend-line), it was a buy opportunity.
The 1D RSI in particular has a Buy Zone, which coincided with all those dip buy opportunities within the Channel Up. As a result, since the stock has already completed a +45% rise from the October 31 2023 Low, we do expect a pull-back to start soon towards the RSI Buy Zone, but only after it rises a little again and forms a Lower High on the RSI, which would be consistent with the previous top formation on the Channel Up.
In any case, at any point the RSI hits its Buy Zone, we will position ourselves with a long and aim for a new +45% rise. Rough target from the current projection is $1050. Notice how efficiently the peak and bottom formations are caught by the Sine Waves. A very symmetric pattern for the long-term indeed.
-------------------------------------------------------------------------------
** Please LIKE 👍, FOLLOW ✅, SHARE 🙌 and COMMENT ✍ if you enjoy this idea! Also share your ideas and charts in the comments section below! This is best way to keep it relevant, support us, keep the content here free and allow the idea to reach as many people as possible. **
-------------------------------------------------------------------------------
💸💸💸💸💸💸
👇 👇 👇 👇 👇 👇

ELI LILLY Is a -20% correction possible?Eli Lilly (LLY) gave us the best possible buy entry at the bottom of the Channel Up last time we gave a call on it (December 14 2023, see chart below) and not hit our $705.00 Target but also aggressively broke above the pattern:
In order to grasp the magnitude of that move, this time we zoom out on the 1W time-frame where we see the long-term pattern since LLY's parabolic move started, in mid 2018 following 3 years of consolidation. The pattern that emerged since is a 6-year logarithmic Channel Up, which since 2023 has gone extremely parabolic.
The key characteristic on this long-term price action is the unique pattern that the 1W MACD forms, a Bearish Cross followed by a Bullish Cross. Four such occurrences since 2018 have caused the stock to form a Higher High top at a minimum 2 weeks and maximum 10 weeks after the Bullish Cross. Currently we are on the 3rd week since the latest 1W MACD Bullish Cross and if it extends to 10 weeks, we can technically expect the new top by April 08 2024.
However, the 1st red 1W candle following the Bullish Cross on those 4 past occurrences has always been the top, or near it. Given the fact that LLY is so close to the top of the 6-year Channel Up, we can expect that a correction will start soon. The minimum correction has been -17.44% and the maximum -23.23% (2 occasions out of the 4). Also before a new long-term rally started, the price hit the 1W MA50 (blue trend-line). Long-term investors can wait for such a contact before buying again heavily Eli Lilly for a new 12-month run.
-------------------------------------------------------------------------------
** Please LIKE 👍, FOLLOW ✅, SHARE 🙌 and COMMENT ✍ if you enjoy this idea! Also share your ideas and charts in the comments section below! This is best way to keep it relevant, support us, keep the content here free and allow the idea to reach as many people as possible. **
-------------------------------------------------------------------------------
💸💸💸💸💸💸
👇 👇 👇 👇 👇 👇

Eli Lilly Breaks New Ground With Weight Loss Drug Offering Eli Lilly - NYSE:LLY
Earnings
Rep: $2.49 ✅ Exp: $2.29 - 8.45% HIGHER
Revenue
Rep: $9.35b ✅ Exp: $8.94b - 4.55% HIGHER
Company Summary
Eli Lilly is the worlds 9th largest company by market cap at $670b and they have reported positive earnings and revenue both coming in higher than expected for Q4 2023. The pharmaceutical giant booked fourth-quarter revenue of $9.35 billion, up 28% from the same period a year ago. A massive result that is reflected in the chart and pre-market surge in price per a share from €706 - €740 👀
Eli develop and manufacture a series of medications with their top drugs being for diabetes and cancer.
The diabetes drug Trulicity generated more than $7.4 billion in revenue for Eli Lilly in 2022 accounting for more than one-quarter of the company's top line, which totaled $28.5 billion. Meanwhile for 2023, Trulicity, reported $1.67 billion in revenue. That’s down 14% from the same period a year go however remains a large revenue generator.
Mounjaro booked $2.21 billion in sales for the fourth quarter and remains one of the companies core diabetes products.
The Q4 2023 results are the first to include sales of Eli Lilly’s new weight loss drug Zepbound, which won FDA approval in early Nov 2023. Zepbound resulted in $175.8 million in sales for Q4. Analysts are expecting a minimum of $1 billion in sales for the 2024 period and some are claiming that Zepbound could become the biggest drug of all time. Do you feel that AI style narrative euphoria building here?
Now more importantly, Lets check out this chart
The Chart
The chart here really caught my attention, its one of thee strongest long term charts I have come across and it keeps making higher double bottoms off higher moving averages.
The OBV is increasing still and the support line might be a good line to watch got an entry bounce or a break down (exit) - a trigger level.
PUKA

ELI LILLY targeting $705.00 if the 1D MA100 holds.Eli Lilly (LLY) has been on an incredible run ever since our March 01 buy signal (see chart below) that even broke above Channel Up:
We have been strong supporters of the company's fundamentals and those are translated into strong technical bullish patters, offering solid buy opportunities. Another such opportunity exists now as the price is trading around the 1D MA50 (blue trend-line) near the bottom of the 2023 Channel Up.
As long as the 1D MA100 (green trend-line), which is exactly on the Channel's bottom, holds, we remain bullish, targeting the 2.382 Fibonacci extension (similar to the May 22 High) at $705.00. If the 1D MA100 breaks though, we will take the loss and sell instead targeting the 1D MA200 (orange trend-line) at $500.00 where a stronger buy opportunity exists.
-------------------------------------------------------------------------------
** Please LIKE 👍, FOLLOW ✅, SHARE 🙌 and COMMENT ✍ if you enjoy this idea! Also share your ideas and charts in the comments section below! This is best way to keep it relevant, support us, keep the content here free and allow the idea to reach as many people as possible. **
-------------------------------------------------------------------------------
💸💸💸💸💸💸
👇 👇 👇 👇 👇 👇

ELI LILLY Our gem on the verge of making a paradigm shift.Eli Lilly and Company (LLY) has long been one of our best investments a real gem that even withstood and was practically unaffected by the 2022 inflation crisis. For long we have been using the Fibonacci Channel to display LLY's parabolic nature having broken above the 2.0 Fibonacci extension last May.
This time the price reversed much quicker than technically expected and is attempting again to break the top (Higher Lows trend-line) of the Channel Up that started in 2020. If it closes above it, then we wil target the 3.0 Fibonacci Channel extension at $700. If it gets rejected and stays within the Channel Up, we will sell and target the recent Support at $520.
Note that a break above this 3-year Channel Up may constitute a paradigm shift as the stock has never hit a new upper Fibonacci level that quickly (remember it broke above the 2.0 Fib just 5 months ago). This can transcend LLY into an even more aggressive bullish nature that we can't yet quantify.
-------------------------------------------------------------------------------
** Please LIKE 👍, FOLLOW ✅, SHARE 🙌 and COMMENT ✍ if you enjoy this idea! Also share your ideas and charts in the comments section below! This is best way to keep it relevant, support us, keep the content here free and allow the idea to reach as many people as possible. **
-------------------------------------------------------------------------------
💸💸💸💸💸💸
👇 👇 👇 👇 👇 👇

ELI LILLY Hit the top of the 4-year Channel. Relief sell-off?Earlier this year we gave a strong buy signal on Eli Lilly and Company (LLY) on March 01 (see chart below) where we called for the most optimal buy entry exactly at the bottom of the bullish pattern:
The price has now hit (last week) the top of the 4 year logarithmic Channel Up, highly overbought with the RSI on the 1W time-frame reaching 84.30, breaking above the August 16 2021 High. As last week's 1W candle closed in red (the first after 5 straight bullish weeks) this is considered so far a Higher Highs rejection and calls for an early sell signals towards the end of October, targeting the 1D MA100 (red trend-line) at $500.00, where the stock will start turning into a buy opportunity again (assuming the RSI is below 55.00).
-------------------------------------------------------------------------------
** Please LIKE 👍, FOLLOW ✅, SHARE 🙌 and COMMENT ✍ if you enjoy this idea! Also share your ideas and charts in the comments section below! **
-------------------------------------------------------------------------------
💸💸💸💸💸💸
👇 👇 👇 👇 👇 👇

ELI LILLY Approaching the top of the Channel. Sell opportunity.Last time we looked at Eli Lilly and Company (LLY) was on March 01 (see chart below) where we called for the most optimal buy entry exactly at the bottom of the bullish pattern:
The price is now approaching the top of the 3 year logarithmic Channel Up, highly overbought with the RSI on the 1W time-frame at 80.00. This gradually calls for a sell towards the end of August, targeting the 1D MA100 (red trend-line) at $480.00, where the stock will turn into a buy opportunity again.
-------------------------------------------------------------------------------
** Please LIKE 👍, FOLLOW ✅, SHARE 🙌 and COMMENT ✍ if you enjoy this idea! Also share your ideas and charts in the comments section below! **
-------------------------------------------------------------------------------
💸💸💸💸💸💸
👇 👇 👇 👇 👇 👇

LLY Eli Lilly Options Ahead of EarningsAnalyzing the options chain and the chart patterns of LLY Eli Lilly prior to the earnings report this week,
I would consider purchasing the 450usd strike price Calls with
an expiration date of 2023-8-11,
for a premium of approximately $11.70.
If these options prove to be profitable prior to the earnings release, I would sell at least half of them.
Looking forward to read your opinion about it.

ELI LILLY on the best buy opportunity of the year!Eli Lilly and Company (LLY) has been trading within a Channel Up pattern since the October 30 2020 low exactly on the 1W MA100 (red trend-line). As the 1D RSI turned oversold below the 30.00 barrier, while the price touched the bottom (Higher Lows trend-line) of the Channel Up, it has filled all conditions for the most optimal buy level of the year. There have been another three similar oversold events, each on one year since 2020.
Once the price breaks above the 1D MA200 (orange trend-line) again, which you can use as confirmation and take the buy after it, we'll set a target at $390.00 on a 4 month horizon.
-------------------------------------------------------------------------------
** Please LIKE 👍, FOLLOW ✅, SHARE 🙌 and COMMENT ✍ if you enjoy this idea! Also share your ideas and charts in the comments section below! **
-------------------------------------------------------------------------------
💸💸💸💸💸💸
👇 👇 👇 👇 👇 👇
