TSLA Catalysts Ranking | Q1 2026 Update | by ProjectSyndicateTSLA: Updated Outlook Jan 2026 — Catalyst Memo
Updated Catalyst Scorecard Ranked by Impact
1 🤖 Autonomous and Robotaxi Execution — 9.4
2 🧱 Energy AI and Optimus Optionality — 9.0
3 🏭 EV Demand and Geographic Mix — 7.8
4 🧮 Battery Cost and Margin Levers — 7.6
5 🗃️ Affordable Model and Next Gen Platform — 7.4
6 ⛓️ Competition and Global Share — 6.7
7 🧭 Macro Trade and Policy — 6.6
8 📉 Rates and Credit Conditions — 6.1
9 🧾 US EV Incentives and Pull Forward — 5.2
10 🧪 Commodities and Inputs — 5.1
11 🛡️ Safety Regulatory and Governance Risk — 8.2 risk flag
________________________________________
Primary Catalyst Stack Updated Scores
🤖 1 Autonomous and Robotaxi Execution — 9.4 out of 10 up
• What changed: Market reporting indicates robotaxi operations in Austin have progressed toward a less supervised operating format, strengthening the commercialization timeline signal.
• Key upside path: Expansion to additional geographies, measurable safety performance, and a clearer unit economics narrative.
• Primary risk: Regulatory intervention, operating restrictions, or a high profile incident that forces program throttling.
• Why higher: This is the clearest pathway to a structural multiple reset and remains the dominant driver of incremental investor positioning.
________________________________________
🧱 2 Energy AI and Optimus Optionality — 9.0 out of 10 up
• What changed: Energy storage deployments remain the most consistently constructive datapoint with rising investor focus on backlog visibility and margin trajectory.
• Key upside path: Sustained deployments growth plus improving profitability, positioning Energy as a second earnings engine rather than a cyclical adjunct.
• Primary risk: Supply chain constraints, project timing volatility, margin normalization if pricing tightens.
• Why higher: Energy plus AI infrastructure adjacency continues to expand the non auto terminal value narrative.
________________________________________
🏭 3 EV Demand and Geographic Mix — 7.8 out of 10 down
• What changed: Deliveries momentum has moderated versus prior year comps, with mix and regional pricing pressure remaining central to earnings power.
• Key upside path: Stabilization in core regions through product refresh cadence, financing support, and disciplined pricing.
• Primary risk: Extended price competition in China and Europe, weaker affordability, inventory driven discounting.
________________________________________
🧮 4 Battery Cost and Margin Levers — 7.6 out of 10 down
• What changed: Margin sensitivity remains elevated given pricing actions, mix shift, and fixed cost absorption.
• Key upside path: Lower bill of materials, manufacturing efficiencies, software attach, and Energy margin expansion.
• Primary risk: Further auto gross margin compression or inability to offset pricing with cost improvements.
________________________________________
🗃️ 5 Affordable Model and Next Gen Platform — 7.4 out of 10 flat
• What changed: The market continues to discount timing uncertainty. Without a defined ramp window, this remains a medium term catalyst rather than a near term driver.
• Key upside path: Clear launch timeline plus credible capacity plan that expands the addressable market.
• Primary risk: Execution delay, demand cannibalization, margin tradeoffs.
________________________________________
🧾 6 US EV Incentives and Pull Forward Dynamics — 5.2 out of 10 down
• What changed: Incentive support is structurally less constructive into 2026, increasing reliance on pricing, financing, and product cadence to drive volume.
• Key upside path: Stronger than expected natural demand, creative financing solutions, improved affordability.
• Primary risk: Air pocket in demand as incentive effects roll off.
________________________________________
📉 7 Rates and Credit Conditions — 6.1 out of 10 flat
• What changed: Financing conditions remain a meaningful second order driver for payment sensitive buyers.
• Key upside path: Easier financing plus improved consumer confidence.
• Primary risk: Sticky rates or tighter underwriting standards.
________________________________________
🧭 8 Macro Trade and Policy — 6.6 out of 10 up
• What changed: Policy remains a swing factor affecting both demand and cost corridors, with tariff and regulatory narratives capable of repricing risk quickly.
• Key upside path: Stable policy environment with limited new frictions.
• Primary risk: Adverse trade moves, tightening regulatory posture, or geopolitical disruptions.
________________________________________
⛓️ 9 Competition and Global Share — 6.7 out of 10 flat
• What changed: Competitive intensity remains high, particularly where local OEMs can compress price points.
• Key upside path: Product refresh leadership plus software differentiation.
• Primary risk: Sustained price war and commoditization pressure.
________________________________________
🛡️ 10 Safety Regulatory and Governance Risk — 8.2 out of 10 risk flag up
• What changed: Autonomy scrutiny remains an active overhang that can change the timeline overnight.
• Key downside path: Restrictions, remedies, reporting burdens, or reputational hits that slow adoption.
• Why elevated: This is the primary left tail against the autonomy bull case.
________________________________________
🧪 11 Commodities and Inputs — 5.1 out of 10 flat
• What changed: Input costs matter, but are not the gating item relative to demand, pricing, and autonomy timelines.
• Key upside path: Lower raw materials supporting margin.
• Primary risk: Sudden spikes that compress profitability.
________________________________________
________________________________________
Analyst positioning and targets
Street posture remains broadly balanced with dispersion widening between autonomy bulls and auto fundamental bears. Into the next earnings cycle, revisions risk is skewed toward fundamentals while multiple sensitivity remains skewed toward autonomy milestones and regulatory developments.
________________________________________
Headlines and tape drivers
• 🤖 Robotaxi commercialization signaling has strengthened
• 🧱 Energy deployments remain a key positive differentiator
• 🛡️ Regulatory scrutiny remains the principal headline risk
• 🧾 Incentive fade increases reliance on pricing and financing levers
________________________________________
Levels and structure
• 🧊 Support zones 405 to 415 then 380 to 395 then 330 to 350
• 🪨 Resistance zones 450 then 475 to 510 then 600
________________________________________
Next 60 to 90 days watch list
1 🤖 Robotaxi expansion pace, operating design, and safety metrics
2 🛡️ Regulatory milestones and any mandated remedies
3 🧱 Energy profitability commentary and backlog visibility
4 🏭 Pricing actions and demand elasticity post incentive fade
ELON

Is Tesla Evolving from Automaker to an AI Superpower?The fourth quarter of 2025 marked the definitive end of Tesla’s era as a traditional car manufacturer. The company has officially shed its automotive skin to emerge as a "Physical AI" powerhouse. This pivot is not mere marketing; it is a fundamental restructuring of capital and industrial strategy.
The Financial Paradox of Q4 2025
Tesla’s Q4 2025 earnings revealed a striking contradiction that defied traditional valuation models. Total sales fell 3.1% year-over-year to $24.9 billion, missing Wall Street expectations. In a conventional growth model, such top-line contraction often triggers a sell-off.
Yet, the market rewarded Tesla’s efficiency narrative. Earnings per share (EPS) hit $0.50, beating forecasts by over 11%. Gross margins surged to 20.1%, their highest level in two years. Investors now prioritize automation's unseen potential over tangible vehicle delivery metrics.
Executing the Legacy: The Death of S and X
In a "burn the ships" strategic move, Tesla will cease Model S and Model X production by Q2 2026. These flagship vehicles defined the brand but now occupy valuable floor space at the Fremont factory. Tesla is clearing the deck to prioritize mass-producing humanoid robots.
Management aims for one million Optimus units annually. The logic is brutal: robots address a larger labor market than luxury sedans. While this alienates early adopters, Tesla is trading 50,000 human customers for a million profitable machines.
Optimus: A "Death Punch" to Global Industry
The Optimus program represents an aggressive challenge to Chinese manufacturing dominance. China’s leverage relies on labor arbitrage, which a $20,000 robot effectively destroys. American factories using Optimus can run 24/7 without benefits or breaks.
However, the "death punch" faces a significant geopolitical bottleneck. China has restricted exports of rare earth magnets essential for robotic actuators. Without neodymium and dysprosium, the 2026 production timeline remains at risk. Tesla is now scrambling for export licenses while redesigning motors to bypass this blockade.
Technology Breakthroughs: 4680 and Silicon Anodes
Tesla’s 4680 battery cell has finally emerged from "yield hell". A December 2025 patent revealed a breakthrough in dry electrode production using silicon composite anodes. Silicon stores more lithium than graphite, significantly boosting energy density.
This innovation is critical for the physical AI fleet. Robots require high energy density to perform tasks for eight-hour shifts. Furthermore, the "tabless" design facilitates 15-minute charging, which is vital for high-utilization Robotaxi operations.
T he AI Infrastructure Pivot: From Dojo to AI6
Tesla has effectively disbanded its custom "Dojo" supercomputer project. The D1 chip proved a capital-intensive dead end. Instead, Tesla is pivoting to the "AI6" chip, manufactured by Samsung.
This new architecture unifies the software stack across cars, robots, and training clusters. By leveraging Samsung’s supply chain, Tesla avoids the capacity constraints of TSMC. The focus has shifted from custom training hardware to massive edge-case inference power.
The Robotaxi Economy and Autonomous "Hives"
The "Cybercab" rollout in 2026 aims to turn vehicles into cash-generating assets. Tesla estimates an operating cost of ~$0.20 per mile, creating a massive profit spread over traditional ride-sharing.
To solve the cleaning bottleneck, Tesla patented a "Self-Cleaning Apparatus" using UV light and sanitization vapor. Automated "hives" will use robot hands to remove debris and wipe surfaces. This integrated ecosystem creates a moat that competitors like Uber cannot easily replicate.
Militarization and the "STING" Cybertruck
Tesla is diversifying into defense through a partnership with Archimedes Defense. The "STING" package adds military-grade armor and a multi-fuel generator to the Cybertruck. This transforms the vehicle into an Armored Personnel Carrier capable of silent watch missions.
The US Air Force is already testing Cybertrucks for structural integrity and weapons integration. While this militarization may alienate eco-conscious buyers, it opens lucrative, recession-proof government contracts.
Risk Management: Cybersecurity and Insurance
Tesla’s greatest existential threat is a fleet-wide hack. With Robotaxis lacking steering wheels, the traditional "hardware disconnect" for brakes is gone. Tesla is implementing a Vehicle Security Operations Center (vSOC) to monitor for anomalies.
Simultaneously, Tesla Insurance is maturing, with a loss ratio improved to 92.5%. As Full Self-Driving (FSD) reduces accidents, these margins will likely widen. Tesla’s real-time data allows it to price risk more accurately than traditional insurers using demographics.

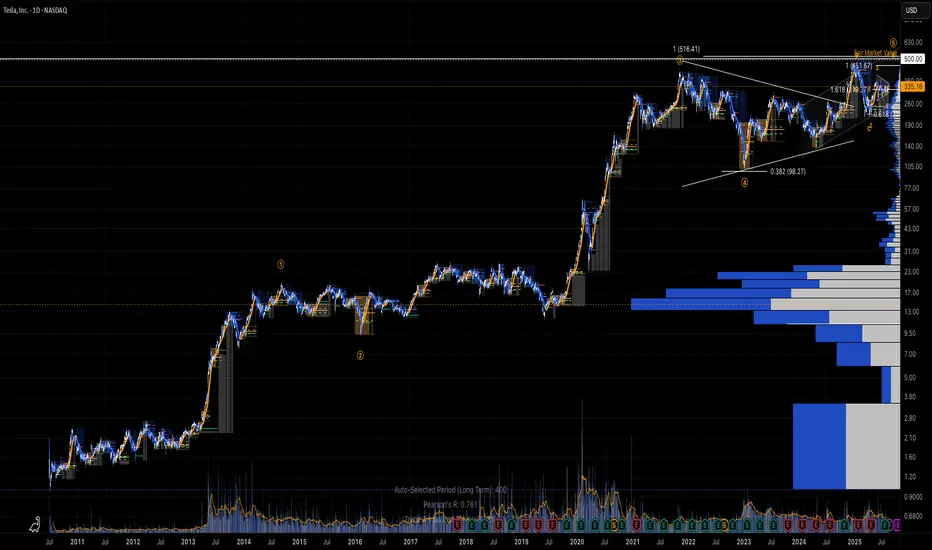
My upside targets for TESLAWe are finishing the 'handle' phase of a year-long setup of the Cup and handle.
All this taking place above the Brimline of the large cup and handle pattern.
We already identified The head and shoulders drop from 2021
The #HVF that took us to Target at $490 in December 2024.
We advised not to be sucked in to the doom and gloom.
during peak #Swastikar outrage and dealership vandalism.
If #TSLA clears $500 with volume, we aren't just looking at a new high—we are looking at a structural re-rating of this company.
🚀 Target 1: $503 (Short-Term Breakout)
The Logic: A high-volume break above the $490 resistance (post-robotaxi pop zone) would confirm the "handle" breakout.
Why it hits: Bullish momentum from year-end delivery updates and the Dovish Fed tone are currently providing the necessary liquidity.
🎯 Target 2: $600 (The "Ives" Consensus)
Widely considered the "mid-term" bull target for 2026, popularized by Wedbush analyst Dan Ives.
The Logic: This targets a roughly 100% gain from the projected 2026 lows.
The Catalyst: This hinges on the successful production start of the Cybercab in April 2026 and the initial commercialisation of the Optimus robot.
🏆 Target 3: $800 - $1,200 (The "AI Chapter" Re-Rating)
This target assumes Tesla is valued as an AI/Robotics powerhouse rather than a car company.
The Logic: Bullish algorithmic projections from sources like StockScan place #TSLA at $1,213 by the end of 2026 if Full Self-Driving (FSD) reaches mass adoption.
The Catalyst: Reaching a $2 Trillion to $3 Trillion market cap as the "AI Chapter" finally takes hold in the company's revenue mix.
🌌 Target 4: $2,000+ (The "ARK" Moonshot)
This is the long-term "blue-sky" target for 2027–2030, most famously championed by Cathie Wood's ARK Invest.
The Logic: Based on a $2,600 per share model, this target assumes the Robotaxi network reaches total global dominance.
The Catalyst: Tesla’s energy storage and software services segments must grow to become the dominant share of revenue, requiring net income to jump from ~$5 billion to $50 billion by 2030.
All these stages are backed by the projected moves of the #HVF @TheCryptoSniper and the two Cup and handle patterns.

Stop Overcomplicating Trading: The Consistency Blueprint No One Stop Overcomplicating Trading: The Consistency Blueprint Nobody Wants to Talk About
Two decades in the market have taught me a very real truth:
Profit isn’t about being the smartest or catching the breakout. It’s about showing up for yourself every week; especially when motivation disappears and the trades get hard.
I’ve been at this 20 years; through bull runs, ugly drawdowns, burnout, and those quiet Sunday reviews where nothing made sense. The only thing that’s kept me in the game and steadily profitable? Building ultra-simple consistency habits that actually fit my life.
Let me give it to you straight: here’s how to move the needle, no matter where you are:
Forget perfection. Track what REALLY matters.
For most, it’s not a magic strategy—often it’s reviewing trades, keeping promises to yourself, and taking care of your brain and sleep before the next setup.
Pick 2-3 metrics and make them sacred:
For me, it’s weekly trade review, a “focus” score for my setups, and legit sleep tracking. I only look at these, period.
Make review time non-negotiable:
I set aside 20 min a week, never skipped. It’s my reset button after wins and losses.
Write out quick wins & lessons—immediately after they happen.
Let the good trades teach you, but also let the ugly ones humble you and anchor your next week.
Adapt your process to real life:
Swing trading while working? Happens. Family? Kids? You can STILL win long-term—just make the review and tracking match your schedule, not some internet hustle template.
Build the feedback loop
When you slip, note it fast and tweak (don’t obsess). When you nail it, reward yourself—not with risk, but acknowledgment.
How do you know it works? Because it’s kept me in profit while teaching hundreds of traders to turn routines into actual results.
If you’re battling for consistency DM me “Tools” or drop it in the comments. I’ll send my simple routines that changed the game for me and dozens of traders.
Let’s build consistency that lasts and celebrate small wins relentlessly.
If I can help, I will.
TSLA Catalysts Ranking: Q1 2026 Outlook PT 600 USD________________________________________
TSLA: Updated Outlook (Nov-2025)
Here's an updated/revised outlook for TSLA including all the primary
catalyst ranking and analyst ratings and overview of latest developments
this was updated for Q1 2026 with all the viable market data.
________________________________________
🤖 1) Autonomous & Robotaxi Execution — 9.2/10 (↑)
• What changed: Tesla’s invite-only Austin robotaxi pilot kept running through the summer; Tesla also says it launched a Bay Area ride-hailing service using Robotaxi tech (Q3 deck). FSD v14 (Supervised) began rolling out in Oct with broader model upgrades; Tesla claims billions of supervised miles and AI training capacity lifted to ~81k H100-equivalents.
• Offsetting risk: NHTSA opened a fresh probe (Oct-2025) into ~2.9M Teslas over traffic-safety violations when using FSD; investigation cites 58 reports incl. crashes/injuries.
• Why the bump: Real pilots in two metros + visible AI scale-up keep autonomy the center of the bull case—even with elevated regulatory risk.
________________________________________
🌍 2) EV Demand & Geographic Mix — 8.6/10 (↘ )
• What changed: Q3-25 delivered record vehicles and record energy storage deployments, with record revenue and near-record free cash flow. Still, we’re past the U.S. tax-credit pull-forward and China/Europe pricing remains competitive.
• Read-through: Momentum into Q4 looks better than 1H-25, but regional price discipline and mix will matter.
________________________________________
💸 3) U.S. EV Tax Credits & Incentives — 6.0/10 (↘)
• What changed: Federal new/used EV credits ended for vehicles acquired after Sept 30, 2025 under OBBB. Buyers can still qualify if a binding contract + payment was made by 9/30 and the car is placed in service later (“time-of-sale” reporting). This creates a limited after-deadline tail into late ’25/early ’26 but the program has sunset for new acquisitions.
• Implication: Pull-forward demand helped Q3; near-term becomes tougher without the credit.
________________________________________
📉 4) Rates & Credit Conditions — 6.5/10 (↔)
• Rate-cut expectations have eased financing costs M/M, but absolute affordability still binds EV uptake. (Macro-sensitive; no single decisive print.)
________________________________________
🎯 5) Affordable Model / Next-Gen Platform — 8.0/10 (↔)
• Q3 deck emphasized Model 3/Y “Standard” variants to expand entry price points; true next-gen remains staged, with execution risk.
________________________________________
🔋 6) Battery Cost & Margin Levers — 8.3/10 (↑)
• What changed: Q3 total GAAP GM improved vs 1H; energy revenue +44% YoY; free cash flow ~$4.0B. Scale/learning and supply-chain localization called out.
________________________________________
⚡ 7) Energy, AI & Optimus Optionality — 8.7/10 (↑)
• Record storage deployments, Megapack 3 / Megablock unveiled; expanding AI inference/training and a U.S. semi-conductor deal noted. This is the clearest re-rating vector beyond autos.
________________________________________
🛡️ 8) Safety, Regulatory & Governance Risk — 7.5/10 (risk) (↑ risk)
• New NHTSA probe into FSD reporting/behavior escalates headline risk; audit scrutiny persists. Interpret higher score here as more material risk to multiple.
________________________________________
🚩 9) Competition & Global Share — 6.2/10 (↔)
• Competitive intensity in China/EU remains high; Q3 execution improved but pricing power still contested.
________________________________________
🌐 10) Macro & Trade/Policy — 6.5/10 (↑)
• Policy shifts (e.g., OBBB tax-credit sunset; tariff/trade uncertainty) remain a swing factor for cost & demand corridors.
________________________________________
✅ 11) Commodities/Inputs — 5.5/10 (↔)
• Mixed moves across lithium/nickel; no single driver eclipses execution/AI narrative near term.
________________________________________
Updated Catalyst Scorecard (ranked by impact)
1. Autonomous & Robotaxi Execution — 9.2
2. Energy, AI & Optimus Optionality — 8.7
3. EV Demand & Geographic Mix — 8.6
4. Battery Cost & Margin Levers — 8.3
5. Affordable Model / Next-Gen — 8.0
6. U.S. EV Incentives — 6.0
7. Rates & Credit — 6.5
8. Macro/Trade — 6.5
9. Competition/Share — 6.2
10. Safety/Reg/Gov Risk — 7.5 (risk flag)
11. Commodities — 5.5
(Key Q3 facts from Tesla’s deck; probe/tax-credit items from NHTSA/IRS reporting.)
________________________________________
📊 Analyst Rankings & Price Targets
• Street consensus (near-term 12-mo): ~$391 average target; consensus rating: Hold across ~46 firms.
• Bull camp: Wedbush (Dan Ives) $600 PT (reiterated Nov-5; Street-high; thesis = embodied-AI/robotics optionality + robotaxi). Benchmark $475 Buy (post-Q3).
• Cautious/negative: UBS $247 Sell (raised from $215 but still bearish on deliveries/margins).
• Tape-check from Tesla: Q3-25 revenue $28.1B, non-GAAP EPS $0.50, record FCF, record deliveries & storage. (EPS miss vs some expectations; revenue beat.)
________________________________________
🔍 Headlines that moved the needle
• NHTSA opens new FSD probe (scope ~2.9M vehicles).
• FSD v14 (Supervised) broad rollout; AI capacity to ~81k H100-eq; Bay Area robotaxi ride-hailing noted (Q3 deck).
• OBBB EV tax credits sunset 9/30/25; binding-contract/time-of-sale guidance enables limited post-deadline claims.
• Q3 print: record deliveries, record energy storage, record FCF; EPS light vs some models but narrative shifts to AI/energy.
________________________________________
🧭 Technicals: Levels & Structure (weekly focus)
Primary structure: since late-2022, TSLA’s traded inside a contracting wedge, with noteworthy compression into 2H-2025—typical of late-stage accumulation before a decisive break. Momentum divergences are improving on weekly frames even as price consolidates.
________________________________________
Key levels (spot-agnostic):
• Support: $360–$370 (prior breakdown area/weekly shelf); $330–$345 (multi-touch base/pivot); $310–$320 (cycle risk zone).
• Resistance: $405–$420 (range top & supply), $450–$475 (post-robotaxi pop zone / analyst PT cluster), $500 (psych), then $600–$650 (LT measured target band).
• Roadmap Expect one more downside probe into $310–$320 in Q1-2026 to complete the wedge, then trend break and resume bull leg toward $600/$650 over the subsequent cycle (≈ ~100% off the projected low).
• Risk markers: sustained weekly closes < $305 would postpone the “final low” timing and force a re-mark to the 200-week MA cluster; weekly closes > $475 accelerate the upside timing toward the $500/$600 handles.
________________________________________
Cases unchanged framework
• Bull: Robotaxi expands to more metros, regulators settle into a supervised-AV regime, energy/AI scale continues; market re-rates to $475–$600 (Benchmark/Wedbush anchors).
• Base: Solid execution across autos + energy, FCF stays healthy, autonomy rolls out cautiously under oversight; stock tracks Street $350–$400 band.
• Bear: Delivery softness post-credit-sunset, tougher pricing in China/EU, or adverse NHTSA actions; retest of $300–$330 zone before trend resolution.
________________________________________
What to watch next (60–90 days)
1. NHTSA probe path and any software/recall remedies.
2. Robotaxi geographic expansion cadence and any shift from safety-monitor to remote-assist ops.
3. Energy bookings & Megapack 3/Megablock ramp against utility RFP calendars.
4. Delivery run-rate post-credit sunset and mix of Standard trims.
________________________________________

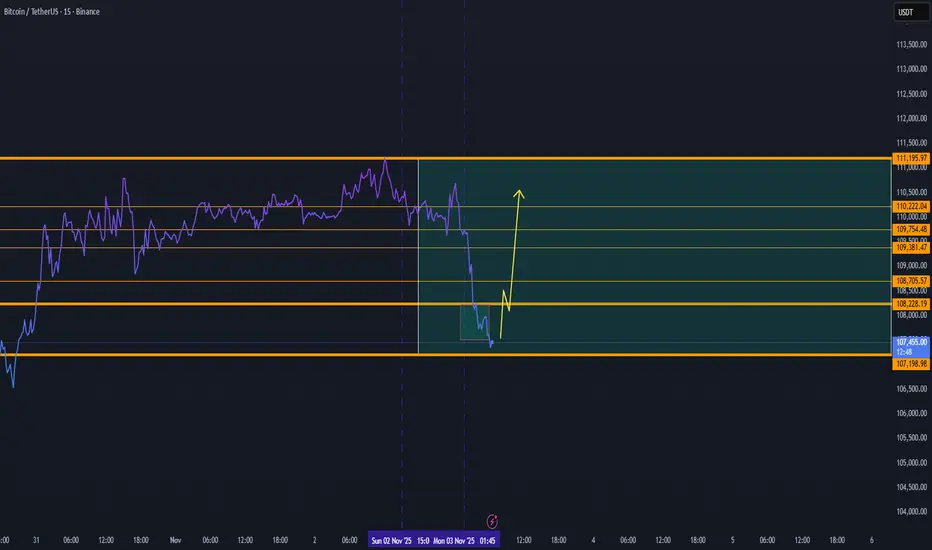
BTC Reversal Momentum — Targeting 110K+ Zone ( DAY VIEW)Bitcoin is showing early signs of a potential short-term reversal after consolidating near the 107K–108K support area. The chart structure indicates a possible recovery wave that could push BTC back toward the 110K+ resistance range in the coming sessions.
Here’s the current structure breakdown:
🟢 Support Zone: 107K remains the key pivot base — holding this area keeps the potential for an upside bounce intact.
📈 Reversal Projection: If momentum builds from the current range, BTC could retest resistance levels at 109.3K → 110.2K → 110.7K.
⚠️ Invalidation: A breakdown below 107K would delay this upward move and reintroduce downside pressure.
Outlook:
Bitcoin is currently stabilizing after a local dip, with buying volume gradually returning. The next impulsive move could drive price action toward 110K+, potentially marking the start of a new short-term uptrend if confirmed by higher lows.
🕒 Summary: As long as BTC maintains structure above 107K, a recovery toward 110K+ remains a strong daily scenario.
Depending on our study BTC can enter a new cycle to 143K in 2025
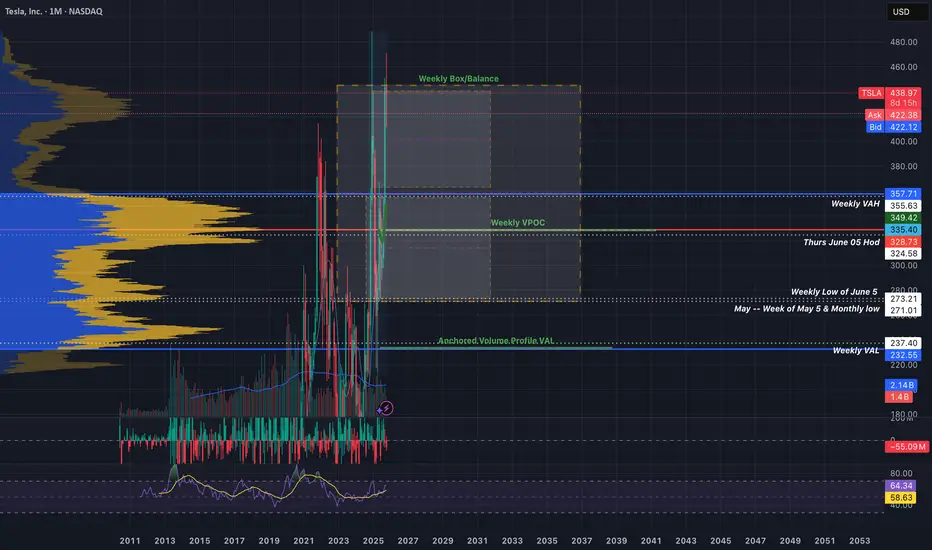
Tsla - Box is Box?I have what seems like a thousand tesla charts now...and they are all telling me tesla needs to have a seat soon.
Tesla has been consolidating on the daily timeframe for quite a while now.
What happens if we continue to see presistent failures at the top of box or a look above and fail on the weekly? I'd put my money on a return to value.
At some point, tesla should revert back to the mean and I will be there waiting to LEAP at the opportunity(get it?).
I would love tesla around the weekly volume point of control around $245 area (this may shift as the days go by). If tesla retests the weekly value area high around $314 and is rejected then we may take a trip down to VPOC town.
Granted, for any of this to happen, we would need technicals to cooperate, meaning a LAAF of box and failure to hold the midpoint($384ish), as well as a turn in sentiment.
This could happen this fall or next march, who knows, but I'll be there when it does.
~The Villain
Ferrari RACE Technicals Led Entry With 100% Upside in 2026
RACE is in a measured correction after its July 2025 ATH (~$517). A repeat of prior ~35% corrections (2018/19; 2022) implies a symmetry target near ~$336 (35% off $516), creating a high-quality “buy the pullback” setup for smart investors willing to scale in before fundamentals re-assert. With the current price around ~$400, a full 35% retrace would complete near the low-$330s; prior cycles then delivered outsized recoveries. We view the $330–$360 zone as a strategic accumulation area for 100%+ multi-year upside potential, with a 2026 bull target >$700 assuming backlog support, margin resilience, and successful new product execution. ATH/price data cross-checked from market sources.
________________________________________
Executive Summary
• Thesis: Ferrari remains the purest “luxury-automotive as luxury-goods” equity: scarce supply, sold-out order book into 2026, rising personalization, and a carefully staged electrification roadmap supported by the new Maranello e-building. Even with macro or tariff noise, Ferrari’s brand, pricing power, and capital discipline underpin premium multiples.
• Why now: The stock’s technical correction is doing the valuation work for you. Into weakness, we favor staged entries ahead of 2026 catalysts EV debut & deliveries; new model cadence; ongoing buybacks.
• Key risks we underwrite: macro wealth shocks; execution on first BEV; regulatory/tariff volatility; FX EUR/USD; and luxury demand rotation. Offsetting: backlog visibility, personalization mix, and buybacks.
________________________________________
Ferrari (RACE) Catalyst Scorecard and 2026 Outlook
1) 🏎 New Model Launches & Portfolio — 9/10
Fresh models e.g., Roma Spider, 296 family, 12Cilindri plus track-focused/limited series sustain mix and ASPs. Purosangue remains capacity-constrained by design ≤~20% of shipments, supporting scarcity. Notes: media and management have repeatedly referenced Purosangue caps and order pauses. Rumor watch: the market expects additional halo launches into 2026; specifics beyond official IR should be treated as provisional.
2) 🔌 EV & Hybrid Transition — 9/10
Ferrari’s e-building went live in 2024 to manufacture ICE, hybrid, and the first BEV, enabling in-house e-axles/battery work and flexible capacity. Management reiterated an EV unveiling in October 2025 with sales beginning 2026; external reporting often cites incremental capacity of ~6,000 units management hasn’t fixed a public number. Strategy: electrify without diluting brand character.
3) 💰 Pricing Power & Personalization — 9/10
Personalizations are a structurally expanding, high-margin revenue stream—running ~~20% of revenues by 2025 commentary—while ultra-limited models e.g., Daytona SP3, 499P Modificata add mix tailwinds. Ferrari consistently emphasizes “quality of revenues over volume.”
4) 🌍 Global Demand & Wealth Resilience — 8/10
Order visibility remains exceptional, with management and financial press citing books effectively filled into 2026 even amid tariffs and China softness; U.S./EU/Middle East wealth pools anchor demand. Hybrids already approach half of deliveries, de-risking compliance.
5) 📈 Order Backlog & Supply Discipline — 8/10
Production is deliberately capped; Purosangue constrained to protect exclusivity. Backlog sold-out deep into 2026 reduces cyclicality and protects margins through mix and scarcity.
6) 💵 Shareholder Returns & Capital Allocation — 7.5/10
Ferrari is methodically executing a multi-year €2bn buyback through 2026 alongside dividends, while maintaining heavy R&D and capex for electrification and new platforms. Recent IR updates confirm ongoing tranches.
7) ⚖ Tariffs & Trade — 7/10
The 2025 U.S.–EU deal reduced tariff pressure versus prior peaks, a modest tailwind to margins and pricing optics for EU autos; Ferrari has shown ability to pass costs to clientele.
8) 🏆 Brand & Competitive Moat — 9/10
Ferrari’s moat resembles top luxury houses more than automakers: waiting lists, repeat/collector buyers, F1 halo, and unrivaled pricing power. This underpins luxury-goods-like multiples and high returns. (Multiple third-party and IR references.)
9) ⚔ Competition & Luxury Peers — 6/10
Peers Lamborghini, McLaren, Rimac, etc. lack Ferrari’s breadth/brand equity. Luxury EV entrants pose incremental risk, but Ferrari’s pacing plus customer loyalty mitigate. General industry assessment; monitor EV launches from peers.
10) 📉 Macro & Economic Cycle — 6/10
Ferrari isn’t immune to wealth drawdowns; however, backlog and personalization provide buffers. Management has historically protected price/mix by flexing volumes if needed.
________________________________________
2026 Outlook What Must Go Right
• EV milestone: Successful first-BEV launch & deliveries with waitlists experience parity with hybrids; no brand dilution.
• Mix strength: Purosangue/12Cilindri/hyper/limited series maintain ASPs and margins; personalization share inches higher.
• Financial delivery: Hitting or beating upgraded plan markers into 2026 after Ferrari indicated it is tracking ahead on profitability versus the original 2026 targets.
• Capital returns: Continued cadence on the €2bn buyback; dividend growth within FCF discipline.
________________________________________
Valuation Snapshot
• Quality context: Ferrari’s 2024 print and IR commentary emphasize expanding mix/personalization and ahead-of-plan profitability into 2025/26. Refer to FY24 results + CMD updates.
• Peer framing: Treat RACE as luxury Hermès-like scarcity rather than auto OEM. This justifies premium EV/EBITDA and P/E vs mass OEMs, provided growth/margins hold.
• Multiple work: On pullbacks to the mid-$300s, implied 2026E EV/EBITDA compresses to attractive territory vs luxury comps assuming consensus-style growth/margins investors should plug house estimates.
________________________________________
Scenarios & Targets
• Bull ($700–$750) — Successful BEV introduction, backlog conversion, personalization >20% of sales, steady buybacks, and benign macro.
• Base ($580–$620) — Order book carries revenues; margins hold with disciplined volumes; EV ramps without profit drag.
• Bear ($350–$400) — Wealth shock or EV stumble; cancellations rise, mix weakens; tariff/FX pressure re-rates the multiple. Risk case consistent with technical $330s correction.
________________________________________
Entry & Risk Management Plan
• Where to buy: Scale in $360–$380; add aggressively $330–$360 35% measured-move zone.
• Sizing: For a diversified HNWI book, a core 1.5–3.0% NAV position, with room to add +100–150 bps on capitulation into the $330s.
• Stops/hedges: Soft stop on a decisive weekly break <$320; hedge via short auto-luxury basket or long USD if EUR strength risks translation.
• Time horizon: 18–30 months through 2026 catalysts.
________________________________________
Near-Term Catalyst Timetable rolling 12–18 months
• Oct 2025–1H 2026: First Ferrari BEV unveil → initial deliveries watch order intake, waitlist depth, option take-rate, margin commentary.
• Ongoing 2025–26: Buyback tranches; monitor IR posts for pace/size.
• Quarterlies/Capital Markets updates 2025–26: Mix/personalization trajectory; backlog commentary; Purosangue allocation discipline.

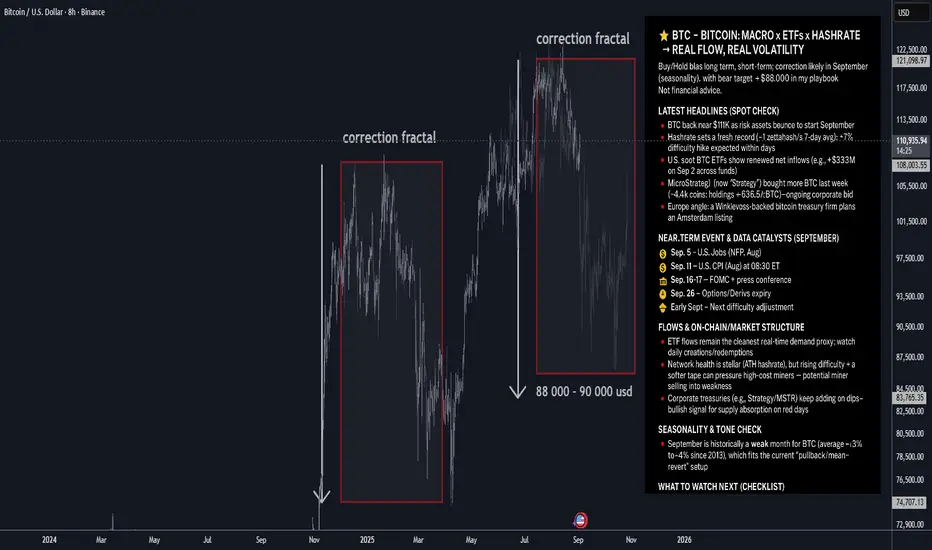
BTC — Bitcoin: Macro x ETFs x Hashrate → Real Flow, Real Volatil⭐️ BTC — Bitcoin: Macro x ETFs x Hashrate → Real Flow, Real Volatility
Buy/Hold bias long term; short-term: correction likely in September (seasonality), with bear target ≈ $88,000 in my playbook.
🔥 Latest headlines (spot check)
🔸BTC back near $111K as risk assets bounce to start September.
🔸Hashrate sets a fresh record (~1 zettahash/s 7-day avg); a >7% difficulty hike is expected within days. Network is the strongest ever, but miner margins tighten.
🔸U.S. spot BTC ETFs show renewed net inflows (e.g., +$333M on Sep 2 across funds). Flows remain a key daily demand gauge.
🔸MicroStrategy (now “Strategy”) bought more BTC last week (~4,4k coins; holdings ≈ 636.5k BTC)—ongoing corporate bid.
🔸Europe angle: a Winklevoss-backed bitcoin treasury firm plans an Amsterdam listing, signaling appetite for listed BTC exposure in the EU.
🗓 Near-term event & data catalysts (September)
🔸Fri, Sep 5 — U.S. Jobs (NFP, Aug) at 08:30 ET. Labor softness would bolster rate-cut odds and risk appetite; a beat could do the opposite.
🔸Wed, Sep 11 — U.S. CPI (Aug) at 08:30 ET. Inflation surprise drives real-rate expectations → BTC beta.
🔸Tue–Wed, Sep 16–17 — FOMC + press conference. Policy path & dot plot = macro volatility for BTC.
Fri, Sep 26 — Options/Derivs expiry:
• Deribit monthly BTC options expire 08:00 UTC (last Friday rule).
• CME Bitcoin monthly options settle Sep 26 as well.
These expiries often amplify gamma flows and spot-vol.
Early Sept — Next difficulty adjustment likely >7% up (tightens miner economics short-term).
Medium-dated overhang
Mt. Gox creditor deadline: Oct 31, 2025. Any schedule/details update could swing “supply overhang” narratives.
📈 Flows & on-chain/market structure
🔸ETF flows remain the cleanest real-time demand proxy; watch daily creations/redemptions. 🔸Sustained positives tend to align with spot strength; outsized outflows can weigh on price.
🔸Network health is stellar (ATH hashrate), but rising difficulty + a softer tape can pressure high-cost miners → potential miner selling into weakness.
🔸Corporate treasuries (e.g., Strategy/MSTR) keep adding on dips—bullish signal for supply absorption on red days.
🧠 Seasonality & tone check
September is historically a weak month for BTC (average ~−3% to −4% since 2013), which fits the current “pullback/mean-revert” setup.
📣 Social/flow buzz (signals, not noise)
🔸ETF flow posts (Farside, Bloomberg desks) are getting traction again—watch after U.S. close for prints.
🔸Saylor/Strategy buying headlines keep the “corporate bid” narrative front-and-center.
🧭 Levels & plan (author’s framework)
🔸Bias: Long-term constructive; near-term: correction mode likely extends through September (seasonality + event risk).
🔸Bear target: $88,000 (where I’d expect volatility to attract responsive buyers).
🔸Invalidation for bears (tactical): A strong reclaim/close above ~$113K–$115K with improving 🔸ETF inflows would weaken the pullback thesis.
🔸Sizing: Respect macro data days (NFP/CPI/Fed) and options expiry week—expect higher realized vol.
🗺 What to watch next (checklist)
🔸Daily U.S. spot BTC ETF flows (post-close updates). Momentum if creations persist; caution on redemptions clusters.
🔸Sep 5 — NFP (Aug) 08:30 ET. Risk-on if soft; risk-off if hot.
🔸Sep 11 — CPI (Aug) 08:30 ET. Headline/core surprises steer the FOMC tone.
🔸Sep 16–17 — FOMC + presser. Watch guidance on cuts, balance sheet, and growth.
🔸Sep 26 — Deribit & CME monthly expiries. Positioning/“max pain” dynamics into that Friday.
Difficulty adjustment (early Sept). If >7% up as projected, monitor miner behavior/sell pressure.
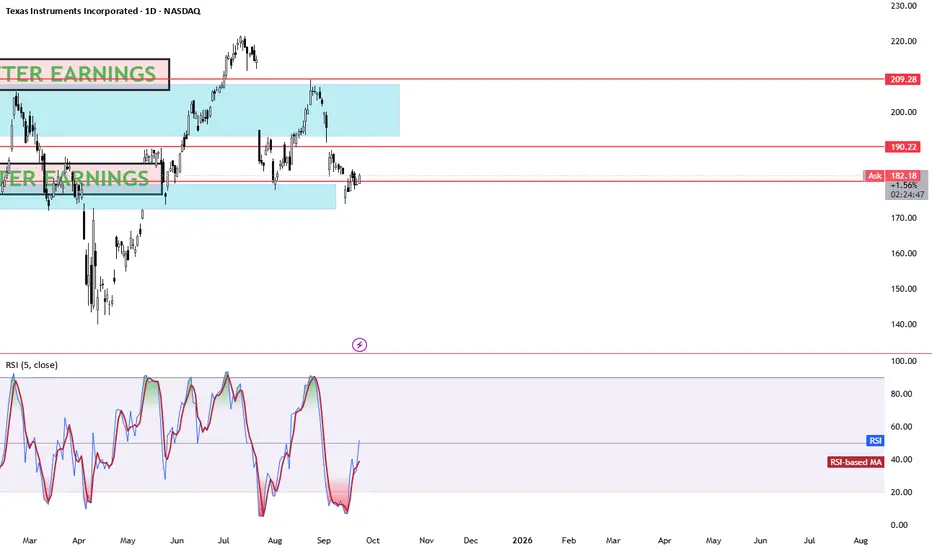
TEXAS INSTRUMENTS BACK TO 200 Why Texas Instruments (TXN) Could Rebound to $200 by 2026: Semiconductor Revival TXN's trading at ~$182 today (Sep 23, 2025), down ~20% from its $230 peak amid industrial softness and China tariffs, but with EPS surging 20%+ and analog demand roaring back, $200 (10% upside) is a slam-dunk floor by EOY 2026. Here's the bull reload:Revenue Ramp & Analog Dominance: Q2 '25 revenue +16% YoY to $4.4B, with industrial up 9% sequentially. Analysts eye $17.5B in '26 (9% YoY growth from $16B '25), fueled by 300mm wafer ramps and auto/enterprise recovery—hitting 50%+ gross margins for $200 valuation at 25x sales.
3 sources
EPS Explosion: Consensus EPS jumps to $6.44 in '26 (20% from $5.35 '25), undervalued at 28x forward P/E vs. 35x historical avg. At norm multiple, that's $226—clearing $200 easy, per WallStreetZen's $208.67 base case.
2 sources
CapEx Efficiency & Cash Flow Surge: $5B '25 spend drops to $2-5B '26 on optimized 1.2x capex/revenue, unlocking $8-12B free cash flow. Dividend hiked 4% to $1.42/share, with buybacks hedging volatility—StockScan's $248 avg '26 seals the rebound.
3 sources
Analyst Consensus Over $200: 25-51 firms avg $212-218 PT (Buy rating, high $298), with TipRanks at $212.83 on AI/data center tailwinds (13% earnings CAGR). Lows $125, but bulls dominate post-Q3 guidance.
Ferrari (RACE) Catalyst Scorecard AND 2026 OutlookFerrari (RACE) Catalyst Scorecard AND 2026 Outlook
________________________________________
1. 🏎 New Model Launches & Portfolio (9/10)
Ferrari’s 2023–26 lineup is packed with high-end launches. Recent additions include the Roma Spider, SF90 XX, 296 Challenge, and 499P Modificata. Demand for the Purosangue SUV has been overwhelming, with early orders suspended and deliveries backlogged into 2026. Coming next: the 849 Testarossa plug-in hybrid deliveries H2 2025/Q1 2026 and the F80 hybrid hypercar limited series, ~1,200 hp. These models should sustain ASP growth and keep exclusivity intact.
________________________________________
2. 🔌 EV & Hybrid Transition (9/10)
Ferrari is phasing electrification deliberately. After hybrids like the SF90 and 296, Ferrari will unveil its first fully electric car in October 2025 deliveries start 2026. A new “e-building” in Maranello is ready to expand capacity by ~6,000 units annually. Ferrari is building in-house motors and batteries while still pledging to keep V12 ICE alive as long as possible. This balance between heritage and compliance ensures both regulatory cover and customer enthusiasm.
________________________________________
3. 💰 Pricing Power & Personalization (9/10)
Ferrari’s bespoke strategy fuels unmatched pricing power. Recent results showed hundreds of millions in incremental profit from high-priced halo models Daytona SP3, 499P Modificata and personalization demand. Personalization now represents nearly one-fifth of revenues. Carefully managed price hikes on core models, combined with ultra-limited editions, cement Ferrari’s position as the most profitable automaker per unit.
________________________________________
4. 🌍 Global Demand & Wealth Resilience (8/10)
About three-quarters of Ferrari’s sales go to repeat customers, and nearly half to collectors owning multiple Ferraris. The expanding global wealthy class adds to the demand pool. Ferrari’s sales are well balanced across regions; China is only ~10%, limiting exposure to that slowdown. Wealth concentration in the U.S., Europe, and the Middle East provides resilience against macro shocks.
________________________________________
5. 📈 Order Backlog & Supply Discipline (8/10)
Ferrari’s order book is sold out through 2026/early 2027. The company deliberately caps production e.g. Purosangue SUV shipments limited to ~20% of total to preserve scarcity. This ensures pricing discipline and supports margin expansion. With supply tightly managed, Ferrari avoids the discounting and inventory overhangs that plague mass-market automakers.
________________________________________
6. 💵 Shareholder Returns & Capital Allocation (7.5/10)
Ferrari’s capital return story is strong. Annual dividends and share buybacks together exceed €750 million. The €2 billion buyback program through 2026 is ongoing. At the same time, Ferrari invests aggressively in R&D e-building, hybrid/EV systems without margin erosion. The balance between shareholder distributions and future growth spending is a key investor confidence driver.
________________________________________
7. ⚖ U.S./EU Tariffs & Trade (7/10)
A recent U.S.–EU deal cut auto tariffs, enabling Ferrari to avoid planned price hikes in the U.S. and improving margins slightly. Regulatory pressure on emissions is real, but Ferrari’s measured EV roadmap addresses compliance. Trade risks are less critical for Ferrari than for volume automakers, but favorable deals add incremental margin upside.
________________________________________
8. 🏆 Brand & Competitive Moat (9/10)
Ferrari’s brand power is unmatched. It combines scarcity, desirability, and F1 heritage to justify luxury-goods multiples more in line with Hermès than Porsche. The brand enables Ferrari to command unmatched ASPs and maintain margins north of 25%. Ferrari’s intangible moat protects it against both cyclical demand dips and competitive threats.
________________________________________
9. ⚔ Competition & Luxury Peers (6/10)
Direct competitors—Lamborghini, McLaren, Rimac—lack Ferrari’s scale, heritage, and breadth. Luxury EV entrants pose some risk, but Ferrari’s controlled rollout and customer loyalty limit the threat. Peer comparisons place Ferrari firmly alongside high-end luxury brands, not mass-market automakers, underscoring its unique positioning.
________________________________________
10. 📉 Macro & Economic Cycle (6/10)
Ferrari is somewhat insulated but not immune. A sharp global downturn or wealth destruction could dampen orders. However, its backlog, exclusivity, and personalization revenue provide cushions. Even in recessions, Ferrari can slow production and still maintain pricing power.
________________________________________
Catalyst Scorecard
Rank Catalyst Score
1 New Model Launches & Portfolio 9.0
2 EV & Hybrid Strategy 9.0
3 Pricing Power & Personalization 9.0
4 Brand & Competitive Moat 9.0
5 Global Demand & Wealth Trends 8.0
6 Order Book & Supply Discipline 8.0
7 Shareholder Returns 7.5
8 U.S./EU Tariffs & Trade 7.0
9 Competition & Luxury Peers 6.0
10 Macro & Economic Cycle 6.0
________________________________________
Valuation Scenarios
• Bull Case ($700–$750): Successful EV debut, robust demand for new models, strong margins, continued buybacks.
• Base Case ($580–$620): Order backlog supports steady revenue growth, modest EV contribution, pricing discipline.
• Bear Case ($350–$400): Macro downturn or execution missteps lead to cancellations and lower margins.

TSLA path to 550/650 USD Breakout Still Pending🔥 What specifically drives TSLA into 550–650
📦 Deliveries + mix surprise
If unit volumes beat whisper numbers and mix favors higher-trim/FSD attach, you get more gross profit per vehicle without needing price hikes. Watch the cadence of regional incentives and shipping vectors; strong NA/EU mix plus improving China utilization is the sweet spot.
🛠️ Margin stabilization → operating leverage
Gross margin base effect + opex discipline = powerful flow-through. Even a 100–150 bps lift in auto GM, coupled with energy GM expanding as Megapack scales, can push operating margin into low-mid teens. That alone recodes the multiple market is willing to pay.
🔋 Energy storage stepping out of auto’s shadow
Megapack/Powerwall growth with multi-GW backlogs turns “side business” into a credible second engine. As deployments and ASP/contract mix normalize, investors begin modeling $10–$15B annualized energy revenue with attractive GM — this is multiple-expanding because it looks more like infrastructure/software-tinted industrials than cyclical autos.
🤖 Autonomy & software monetization bridges
Two things move the needle fast: (1) clear progress toward supervised autonomy at scale (drives FSD attach + ARPU), and (2) licensing (FSD stack, charging/NACS, drive units). Even modestly credible paid-miles/seat-based models (think $50–$150/month vehicles on fleet) transform valuation frameworks.
🦾 Optimus/robotics as a real option, not sci-fi
The market doesn’t need commercial ubiquity — it needs line-of-sight to pilot deployments and unit economics where labor-substitute ROI < 3 years. A few high-credibility pilots (warehousing, simple assembly, logistics cells) can tack on optionality premium that pushes the multiple toward the top of the range.
💹 Options-market reflexivity
Flows matter. Elevated call demand near ATH turns dealers short gamma, forcing delta hedging that lifts spot, which triggers more call buying → a familiar feedback loop. On breakouts, watch open interest skew to short-dated OTM calls, and put-call ratios compressing; these magnify upside in a tight float day.
🌍 Macro & liquidity
If indices hold highs and the rate path doesn’t tighten financial conditions, growth duration gets rewarded. TSLA’s beta + story premium thrives in that regime.
________________________________________
🧠 Outside-the-box accelerants
🛰️ “Software day” packaging
A coordinated showcase that bundles FSD progress, energy software (fleet, VPP), service/insurance data, and Optimus pilots into a single capital-markets narrative could reframe TSLA as a platform. The Street responds to packaging; it compresses time-to-belief.
🤝 Third-party FSD/charging licensing headlines
A single blue-chip OEM announcing software licensing + NACS deep integration reframes the competitive landscape. The equity market pays a software multiple for recurring seats.
🏗️ Capex signaling for next-gen platform without GM hit
Announcing a modular, high-throughput manufacturing scheme (cell to structure, gigacasting tweaks, logistics compression) with proof that unit economics are accretive from ramp can flip skeptics who anchor to past ramp pain.
⚡ Grid-scale contracts + financing innovation
If Tesla pairs utility-scale storage with project-level financing (think repeatable ABS-like channels for Megapack), you de-risk cash conversion cycles and unlock a new investor constituency (infrastructure/green income). That tightens the multiple.
________________________________________
🏎️ Comparative playbook: RACE (Ferrari) & NVDA (NVIDIA)
👑 RACE — the scarcity & brand ROIC lens
Ferrari’s premium multiple rests on scarcity, orderbook visibility, and brand pricing power. TSLA doesn’t have scarcity, but it can borrow the RACE lens via (a) limited-run, ultra-high-margin trims that anchor halo pricing, (b) waitlist-like energy backlogs that create visibility, and (c) bespoke software packages that mimic “personalization” margin. In bull phases, RACE trades as a luxury compounder rather than an automaker; TSLA can earn a slice of that premium when the energy + software story dominates.
🧮 NVDA — the flywheel & supply-constrained S-curve
NVIDIA’s explosive run blended (1) clear demand > supply, (2) pricing power, (3) ecosystem lock-in. TSLA’s battery and compute stacks can echo that dynamic: limited 4680/cell supply + Megapack queues + proprietary autonomy data moat. The moment the market believes TSLA is supply-gated (not demand-gated) in energy/AI, it will award NVDA-like scarcity premia. Add toolchain stickiness (training data, fleet miles, Dojo/AI infra), and you get ecosystem multiples rather than auto multiples.
📊 What the comps teach for TSLA’s 550–650 zone
• RACE lesson: visibility + pricing power boost the quality of earnings → higher P/E durability.
• NVDA lesson: credible scarcity + platform control turbocharge EV/Sales and compress the market’s time-to-future state.
• Translation for TSLA: blend of luxury-like quality (energy contracts + premium trims) and platform scarcity (cells/AI stack) → multiple rerate into our target band.
________________________________________
🧾 Valuation outlook
🧮 Earnings path
• Units up mid-teens % Y/Y; ASP stable to slightly higher on mix; energy + software up strongly.
• Auto GM +100–150 bps; Energy GM expands on scale; opex +SMC disciplined → op margin 12–15%.
• Share count glide modest. Forward EPS ≈ $9–$11.
• Multiple: 50× (conservative growth premium) → $450–$550; 60× (software/autonomy visibility) → $540–$660.
• Why the market pays up: visible recurring high-margin lines (FSD, energy software, services) + AI/robotics optionality.
📈 EV/Sales path
• Forward revenue $130–$150B (auto + energy + software/services).
• Assign blended EV/Sales 6.5–7.5× when energy/software dominate the debate.
• Less net cash → equity value per share in $550–$650.
• Check: At 7× on $140B = $980B EV; equity ≈ $1.0–$1.1T with cash, divided by diluted shares → mid-$500s to $600s. Momentum premium and flow can extend to upper bound.
________________________________________
🧭 Technical roadmap & market-microstructure
🧱 Breakout mechanics
A decisive weekly close above prior ATH with rising volume and a low-volume retest that holds converts resistance to a springboard. Expect a “open-drive → pause → trend” sequence: day 1 impulse, 2–5 sessions of rangebuilding, then trend resumption.
🧲 Volume shelves & AWVAPs
Anchored VWAPs from the last major swing high and the post-washout low often act like magnets. Post-break, the ATH AVWAP becomes first support, then the $500 handle functions as the psychological pivot. Above there, $550/$590/$630 are classical measured-move/Fib projection waypoints; pullbacks should hold prior shelf highs.
🌀 Options & dealer positioning
On a break, short-dated OTM calls populate 1–2% ladders; dealers short gamma chase price up via delta hedging. Expect intraday ramps near strikes (pin-and-pop behavior) and Friday accelerants if sentiment is euphoric. A steepening skew with heavy call open interest is your tell that supply is thin.
________________________________________
🧨 Risks & invalidation
🚫 Failed retest below the breakout shelf (think: a fast round-trip under the $4-handle) downgrades the setup from “trend” to “blow-off.”
🧯 Margin or delivery disappointments (e.g., price-war resumption, regional softness) break the EPS/EV-Sales bridges.
🌪️ Macro shock (rates spike, liquidity drains) compresses long-duration multiples first; TSLA is high beta.
🔁 Flow reversal — if call-heavy positioning unwinds, gamma flips to a headwind and accelerates downside.
________________________________________
💼 Trading & portfolio expressions for HNWI
🎯 Core + satellite
Hold a core equity position to capture trend, add a satellite of calls for convexity. If chasing, consider call spreads (e.g., 1–3 month $500/$600 or $520/$650) to tame IV.
🛡️ Risk-managed parity
Pair equity with a protective put slightly OTM or finance it with a put spread. Alternatively, collars (write covered calls above $650 to fund downside puts) if you’re guarding a large legacy stake.
⚙️ Momentum follow-through
Use stop-ins above key levels for systematic adds, and stop-outs below retest lows to avoid round-trips. Size reduces into $590–$630 where target confluence lives; recycle risk into pullbacks.
💵 Liquidity & slippage
Scale entries around liquid times (open/closing auctions). For size, work algos to avoid prints into obvious strikes where dealers can lean.
________________________________________
🧾 Monitoring checklist
🔭 Delivery run-rate signals (regional registration proxies, shipping cadence).
🏭 Margin tells (bill of materials trends, promotions cadence, energy deployment updates).
🧠 Autonomy milestones (software releases, safety metrics, attach/ARPU hints).
🔌 Licensing/partnership beats (NACS depth, FSD/AI stack interest).
📊 Options dashboard (short-dated call OI ladders; put-call ratio shifts; gamma positioning).
🌡️ Macro regime (rates, liquidity, risk appetite).
________________________________________
✅ Bottom line
🏁 The 550–650 tape is not a fairy tale — it’s a stacked-catalyst + rerate setup where energy/software/autonomy rise in the narrative mix, margins stabilize, and options-market reflexivity does the rest. Execute the breakout playbook, respect invalidation lines, and use convex expressions to lean into upside while protecting capital.
esla (TSLA) — Breakout Playbook
🎯 Core Thesis
• Insider conviction: Musk’s ~$1B buy.
• Risk-on macro: equities at highs, liquidity supportive.
• Options reflexivity: call-heavy flows can fuel upside.
• ATH breakout (~$480–$490) = gateway to price discovery.
________________________________________
🚀 Upside Drivers to $550–$650
• Deliveries & Mix: Surprise beat + higher trim/FSD attach.
• Margins: GM stabilization + energy scaling → op margin 12–15%.
• Energy: $10–15B rev potential with infra-like multiples.
• Autonomy/Software: FSD attach, ARPU, licensing.
• Optimus/Robotics: Pilot deployments → ROI < 3 yrs adds optionality.
• Licensing Headlines: OEMs adopting NACS/FSD stack.
• Capital Markets Narrative: Packaged “software + energy + robotics” story reframes Tesla as a platform.
________________________________________
🏎️ Comparative Bull Run Lens
• Ferrari (RACE): Scarcity, orderbook, luxury multiples.
• NVIDIA (NVDA): Scarcity + ecosystem flywheel → EV/Sales premium.
• Tesla Parallel: Blend of luxury quality (energy backlogs, halo trims) + AI scarcity (cells, fleet data, Dojo).
________________________________________
📊 Valuation Bridges
• EPS Path: $9–$11 EPS × 50–60× = $450–$660.
• EV/Sales Path: $130–150B revenue × 6.5–7.5× = $550–$650.
________________________________________
📈 Technical Roadmap
• Breakout > $490 → retest holds → next legs:
o $550 / $590 / $630 / stretch $650–$690.
• Watch anchored VWAPs; ATH shelf flips to support.
• Options chase accelerates above round strikes.

CUP AND HANDLE $TSLA TO $515 MINIMUMThe cup and handle is a bullish chart pattern commonly used by traders to spot potential buying opportunities. It features a rounded "cup" formation followed by a slight downward drift forming the "handle." This pattern typically signals a continuation of an upward trend once the handle completes its consolidation phase.
ROBOTAXI BOOM
BUY NOW NASDAQ:TSLL NASDAQ:TSLA

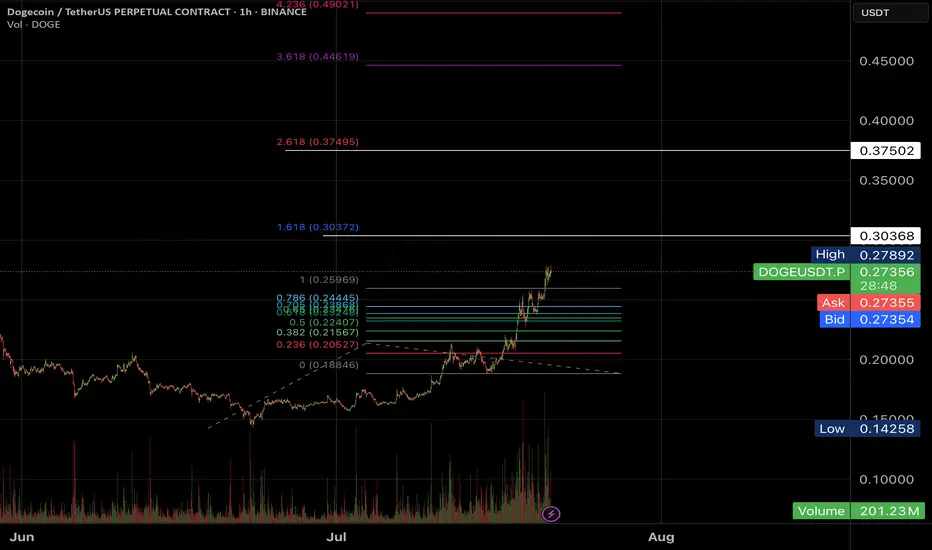
Dogecoin (DOGE) Market Update & Catalysts: Ready for 50 cents?🚀 Dogecoin (DOGE) Market Update & Catalysts
🐋 Whale Accumulation & Trading Activity
Large players (“whales”) have been steadily absorbing DOGE, fueling upward momentum. Recent market structure shows that bulls defended the $0.22 zone, while primary support and reload range sits at $0.15–$0.16 — the bottom of the accumulation range. A breakout above $0.25 could spark a run toward $0.40, especially if short positions get squeezed.
🏦 ETF Prospects & Institutional Tailwinds
Optimism is building around a potential Dogecoin Spot ETF, with growing speculation that approval could arrive in the next cycle. An ETF would open the doors for institutional capital, mirroring what happened with Bitcoin’s rally.
🔗 Expanding Utility (DogeOS & DeFi)
The development of DogeOS, which allows DOGE to interact with Ethereum DeFi ecosystems, could give the coin a major utility boost beyond its meme status. This evolution may help sustain higher valuations long-term.
📈 Technical Signals & Price Forecasts
Chart patterns are turning favorable:
Golden cross (50-day MA crossing the 200-day) shows momentum strength.
Oversold RSI signals suggest a potential reversal upward.
If support at $0.15–$0.16 holds and bulls reclaim $0.25, upside targets expand to $0.34–$0.40.
🔮 Bullish Scenarios & Analyst Sentiment
Mid-term projections highlight possible price zones:
Conservative path: $0.30–$0.33 into 2025.
Aggressive path: Retesting all-time highs near $1 if institutional demand + ETF + DeFi traction align.
🌟 Key Positive Catalysts
🔑 Catalyst 🚀 Impact
🐋 Whale absorption & accumulation Strengthens base; short squeezes possible.
🏦 Spot ETF approval potential Brings institutional demand.
📊 Technical bullish patterns Golden cross + RSI suggest uptrend.
🔗 DogeOS & DeFi integration Expands DOGE’s real-world use cases.
💬 Strong community + hype Keeps DOGE in the spotlight.
✅ Summary
Dogecoin is holding its accumulation base at $0.15–$0.16, with strong whale support and growing catalysts like ETFs and DeFi integration. If bulls can reclaim the $0.25–$0.26 zone, momentum could build toward $0.40 in the mid-term — with long-term upside scenarios eyeing $1+ if institutional and utility drivers align.

TSLA Catalysts Ranking: September 2025 update and Path ForwardHere's an updated/revised outlook for TSLA including all the primary
catalyst ranking and analyst ratings and overview of latest developments
this was updated for September 2025 with all the viable market data.
🤖1. Autonomous & Robotaxi Execution (↑ from 8.5 to 9/10)
• Why it matters: Tesla officially launched its Robotaxi service in Austin on June 22, 2025, deploying a small fleet of 10–20 invite-only Model Ys operating within a geofence and featuring human safety monitors..
• The stock rallied impressively—up 9%–11% on launch day..
• Regulatory scrutiny intensified as the NHTSA launched probes into delayed crash reporting and other safety concerns..
• Musk also touted FSD v14 as 2–3× safer than humans, with v15 aiming to be 10× safer—but cautioned debugging would take "several months.".
• Why the bump to 9/10? The real-world rollout is finally underway, drawing heavy investor focus—even amidst safety questions.
________________________________________
🌍2. EV Demand Growth & Geographic Recovery (holds at 9/10)
• Despite a 13% year over year global sales drop in H1 2025, future demand hinges on Amazon of lower priced models and tax credit extensions..
• Strong upward investor sentiment: TSLA is up 54% over the past year, despite being down ~16% YTD..
• Why still 9/10? Long-term EV momentum remains solid; a rebound may follow new launches or incentive shifts.
________________________________________
💸3. U.S. EV Tax Credits & Incentives (↑ from 6 to 7.5/10)
• The $7,500 EV tax credit—set to expire September 30—has been extended: now, buyers can qualify with a signed purchase agreement, even before delivery..
• However, expiration still looms and could dampen demand..
• Why bump to 7.5/10? The extension buys breathing room and could stabilize near-term demand.
________________________________________
📉4. Fed & Interest Rates (↑ from 5 to 6.5/10)
• On August 22, Tesla led a mega cap tech rally (up 6%+) after Fed chair hinted at possible rate cuts—lower borrowing costs may aid EV financing..
• Why improved score? Lower rates remain a key catalyst for big-ticket items like EVs.
________________________________________
🎭5. Affordable Entry-Level Model / Next-Gen Platform (holds at 8.5/10)
• Musk revealed the upcoming affordable model may resemble a Model Y and could launch slower than expected post tax credit expiration..
• The “next gen” platform—including the so called “Model 2/Q” or Cybercab—targets mid 2025 production..
• With delays likely, expectations remain high but execution risk persists.
________________________________________
🔋6. Battery Cost & Margin Improvement (holds at 8/10)
• Q2 margins improved modestly, supported by cost cuts and energy business growth..
• Yet, regulatory credits continue to decline (–51%), pressuring margins..
________________________________________
🤖7. Energy & AI Upside (new 8/10)
• Tesla is doubling down on autonomy and energy. Musk highlighted robotaxi, energy storage, and its humanoid Optimus robot, slated for early 2026..
• Wedbush’s Dan Ives sees Tesla as an “embodied AI compounder,” while William Blair estimates self driving could be worth nearly $1 trillion..
• This iterative AI and energy focus is a compelling re-rating vector.
________________________________________
📊 8. Safety, Regulatory & Governance Risk (↑ to 7/10)
• NHTSA’s probe into crash-report delays, plus ongoing FSD safety concerns, elevate tail risk..
• Musk’s political entanglements have had adverse brand impacts; while stepping back from new political initiatives helped marginally, skepticism persists..
• Added governance scrutiny and Musk’s external ventures continue to weigh on sentiment.
________________________________________
🚩9. Competition & Global Sales Slump (holds at 6.5/10)
• EV rivalry heats up, and Tesla’s European and Chinese market share slumped significantly.
• Still a notable headwind.
________________________________________
✅10. Commodities & Raw Material Costs (holds at 5.5/10)
• Volatile raw material prices continue to affect margins; hedges help but don't eliminate the risk.
________________________________________
🚀11. Macro & Trade Policies (new 6/10)
• Tariff risks and global trade instability persist. Musk has warned of “rough quarters” ahead linked to these macro risks..
• Considered separately, worth tracking but less immediate than others.
________________________________________
Updated Catalyst Scorecard
Rank Catalyst Score
1 Autonomous & Robotaxi Execution 9
2 EV Demand Growth 9
3 Affordable Entry-Level Model 8.5
4 Battery Cost & Margin Improvement 8
5 Energy & AI Upside 8
6 U.S. EV Incentives 7.5
7 Safety, Regulatory & Governance Risk 7
8 Fed & Interest Rates 6.5
9 Competition & Global Sales Slump 6.5
10 Macro & Trade Policy Risks 6
11 Commodities & Raw Material Costs 5.5
________________________________________
📊Analyst Ratings & Price Targets (Updated)
• Median 12-month price target: ~$303–$307, implying slight downside from current ~$346..
• High-end bulls: Dan Ives (Wedbush) at $500; Benchmark raised to $475..
• Cautious voices: UBS remains bearish at $215, saying robotaxi upside may be priced-in..
• Wolfe Research: warns near-term earnings estimates are too optimistic, free cash flow may remain under pressure..
________________________________________
🔍Recent Headlines You Should Know
• Robotaxi launch in Austin, promoting optimism but drawing scrutiny..
• FSD & Optimus focus, backed by bullish commentary like “embodied AI compounder.”.
• EV credit tweak buys time for deliveries and demand..
• Fed hinting at rate cuts, offering cyclical lift..
• Q2 earnings miss on EPS and revenue, but autonomy/energy pushed narrative..
________________________________________
• Bull Case: Robotaxi and AI drive restore investor confidence, pushing targets toward $475–$500.
• Base Case: Steady but cautious—watch for execution on autonomous and cost-efficiency.
• Bear Case: Renewed delivery slumps, regulatory blowback, or failed rollout could weigh toward downside support in the $300–$330 range.
Tesla, Inc. $TSLA ~ Very Concerning (Not much left)...Tesla, Inc. engages in the design, development, manufacture, and sale of electric vehicles and energy generation and storage systems. It operates through the Automotive and Energy Generation and Storage segments. The Automotive segment includes the design, development, manufacture, sale, and lease of electric vehicles as well as sales of automotive regulatory credits. The Energy Generation and Storage segment is involved in the design, manufacture, installation, sale, and lease of solar energy generation, energy storage products, and related services and sales of solar energy systems incentives. The company was founded by Jeffrey B. Straubel, Elon Reeve Musk, Martin Eberhard, and Marc Tarpenning on July 1, 2003 and is headquartered in Austin, TX.
ELON/USDT Ready for the big pumpELON/USDT Ready for the big pump
Not everyone is ready for what is happening.

TESAL HEADING TO $500+ RANGE ANALYSIS HERE Afternoon Trading Fam
So here is our in-depth look at Tesla: Currently the monthly trend is bullish giving us levels of $500 and above.
Locally though we can break this $338 top expect to see $444 and $480 getting hit next
If we need to correct and we break the lows of $319 expect to see the levels of $307 then $301 being hit
Happy Trading
Trade Smarter Live Better
Kris

TESLA ANALYSIS CAN WE HIT 380? Evening everyone
Here is the analysis on Tesla currently:
Thesis For Bullish: If we break the highs of 336 then we can hit levels of 380 or higher
Thesis for Bearish: If we break the low at 298 then a drop down to 291 then 275 makes sense
Trade Smarter Live Better
Kris/Mindbloome Exchange

Tesla High Risk of $255Tesla is Stuck under $430 ATH resistance and at high risk of falling back to $255 support.
Tesla is no longer growing and Musk is polarizing and alienating their mostly progressive leaning customer base. This stock simply makes zero sense for a 200 pe ratio.

A to 236 or B killing A to 420Tesla is one of those stocks that is heavily manipulated algorithmically. When we were in an uptrend and needed a little push, a large fractal was created that could break a previously formed structure which should have taken us to $236(A). Interestingly, a very strong symmetrical triangle has emerged, influencing this upward movement, and the final price—due to some mystical reason—seems to be $420(B). It’s also worth noting that this whole move is being influenced by another similar structure whose target is above $600. So, if we analyze everything that’s happening, a 12% drop in sales means nothing compared to what Tesla will gain from robots, restaurants, and robotaxis, which I call RRR
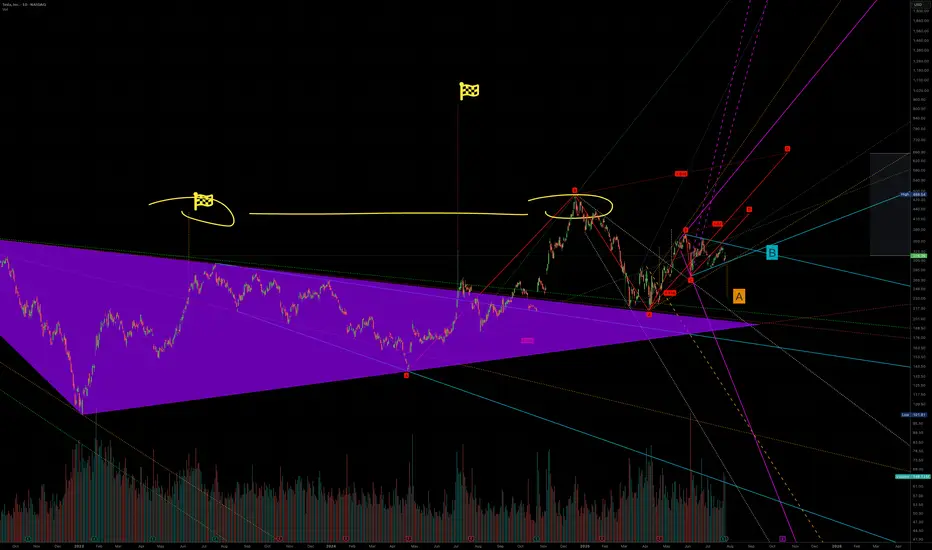
Cup & HANDLE + Mini Double Bottom: $TSLA to $610 ScenarioI maintain a bullish stance on Tesla ( NASDAQ:TSLA ), supported by a compelling combination of technical patterns and strong fundamental drivers. The current chart setup reveals a Cup and Handle formation complemented by a Mini Double Bottom, both of which are classic bullish continuation patterns. These suggest a potential breakout scenario that could drive NASDAQ:TSLA to $610 by year-end.
Technical Roadmap:
Gap Fill to $408: Anticipated earnings momentum, particularly from the Robotaxi segment, is likely to propel the stock to fill the previous gap at $408.
Consolidation at $450: Following the gap fill, I expect a consolidation phase forming a “box” around the $450 level.
Breakout to $610: A decisive breakout above $450 could trigger a strong rally toward the $610 target.
***Current Key Catalysts Supporting the Bullish Thesis:
Robotaxi Expansion: Tesla’s autonomous driving initiative is gaining traction, with Robotaxi developments expected to significantly boost revenue and margins.
India Market Entry: Tesla’s upcoming launch in India opens access to one of the world’s largest and fastest-growing EV markets.
In-House Chip Development & Dojo 2 Expansion: Continued investment in AI infrastructure and custom silicon enhances Tesla’s competitive edge in autonomy and robotics.
Tesla Diner Launch: The near-completion of Tesla’s themed diner adds to brand visibility and customer engagement.
Global EV Adoption: Tesla continues to benefit from rising EV demand across multiple international markets.
Optimus Robot Hype: Growing interest in Tesla’s humanoid robot project could unlock new revenue streams and investor enthusiasm.
Favorable Macro Trends: A declining interest rate environment supports higher valuations for growth stocks like Tesla.
Institutional Accumulation: Recent trading activity suggests that institutional investors are accumulating shares within the current range.
Grok AI Integration: The integration of Grok AI into Tesla vehicles could enhance user experience and differentiate Tesla’s infotainment ecosystem.
Investment Strategy:
I recommend initiating or increasing exposure to NASDAQ:TSLL (leveraged Tesla ETF) ahead of the upcoming earnings report. This could offer amplified returns if the bullish scenario plays out. Consider accumulating further on any dips, particularly during the consolidation phase around $450.
BUY NOW NASDAQ:TSLA NASDAQ:TSLL

Are you looking for a short in #DogeHi Padawans,
BTC.D is dropping from 66% to 60%, and as expected, ALTs are starting to pump.
I’m keeping an eye on DOGE and will look to take some quick short scalps once it reaches the target levels.
Best regards,
CryptoObi