Gold Keeps Searching for New HighsHello everyone, what are your thoughts on OANDA:XAUUSD ?
Gold continues to surprise us one move after another. As the new week opened, the precious metal recorded a historic breakout, trading near the $3,500 level amid ongoing global economic turbulence.
From a technical perspective, XAUUSD maintains a solid bullish structure, breaking past key resistance levels. The EMA 34 and 89 both confirm that there is still plenty of room for further upside. This rally not only reflects the market’s “gold hunting” sentiment but also opens major opportunities for traders who can catch the right wave.
So, how should we trade? At this sensitive stage, buyers may find it difficult to identify an ideal entry point. For sellers, no new top has yet been confirmed. That’s why it may be safer to wait for clearer signals—whether gold sets a new high or establishes fresh support. For short-term traders, make sure you set both SL and TP with a ratio of 1:1 or 1:2.
In addition, there are several news events this week and in the near future that could further impact gold’s trend. I’ll cover these in upcoming analyses, so stay tuned.
And you—what do you think about XAUUSD’s direction? Leave a like if you agree with my view, and drop a comment if you’d like to share your thoughts.
Good luck!
Ema89

Gold Surges Above Expectations, Reaches 5-Week Highs!👋Hello everyone, let’s take a look at OANDA:XAUUSD !
📍Gold continues its impressive rally, even surpassing our previous expectations and reaching the highest levels in 5 weeks. Currently, the bullish momentum is intact, trading around $3412 and surpassing the key psychological level of $3400, gaining over 300 pips from the previous session.
The recent surge in gold is largely driven by concerns over the Fed. Pressure from Trump is fueling speculation that the central bank could cut rates faster and keep them low for a longer period. The CME FedWatch tool shows that investors now expect an 87% chance of a rate cut in September, which is beneficial for gold prices.
📈From a technical perspective: Gold has broken through the $3400 level and closed clearly above the resistance, turning it into new support. The EMA 34 and 89 still favor the bulls, and our strategy will prioritize selling at the top and continuing to buy as long as support holds. The target for the strategy is $3430–3433 USD (D1 resistance).
What do you think💬? How will gold move, and what will the price be at the close today?
✍️ Leave your thoughts in the comments!

XAUUSD Shines Bright: Safe-Haven Demand Lifts GoldHello everyone, what are your thoughts on OANDA:XAUUSD ?
Yesterday, XAUUSD continued its impressive recovery, with the precious metal trading as high as 3,393 USD and still holding around 3,387 at the time of writing.
This sharp rally from near 3,350 up to almost 3,400 is largely driven by the broad sell-off in the U.S. Dollar (USD) and weaker short-term U.S. Treasury yields. These factors boosted safe-haven demand for gold as investors shifted capital into the metal.
This week, the market will focus on the upcoming U.S. Personal Consumption Expenditures (PCE) report, due on August 29. As the Fed’s preferred inflation gauge, this data will be crucial in shaping expectations for potential Fed rate cuts, which could further influence gold’s direction.
I remain optimistic on gold’s outlook, with my analysis targeting resistance at 3,400 – 3,415 and support in the 3,350 – 3,360 zone. The short-term trend still favors the upside.
What do you think about XAUUSD? Share your view!

Trading Strategy: Sell or Buy?Hello, it’s great to see you again! Let’s take a look at OANDA:XAUUSD today.
By the end of the previous session, gold continued to gain strong upward momentum, with the precious metal climbing as high as $3,399. At the time of writing, the bullish drive remains intact, with price trading around $3,385.
The gold market is witnessing safe-haven demand amid rising concerns over the independence of the U.S. Federal Reserve, following recent harsh criticism of Fed Chair Jerome Powell by President Trump.
Currently, traders and investors are eagerly awaiting the PCE Price Index, set to be released on Friday. Personally, I expect this will be positive news for gold.
Technical outlook : The bullish momentum is strong and well-supported. However, price is approaching a critical resistance level at $3,400 while forming a wedge pattern. As the wedge narrows, a breakout becomes more likely. I expect a short-term pullback before the uptrend resumes.
What do you think about XAUUSD? Share your thoughts in the comments!

BTCUSD – Bearish Trend ? Hello traders! Let’s take a closer look at BITSTAMP:BTCUSD !
Recently, we’re seeing clear signs of a potential reversal after BTCUSD formed a double top pattern, and the EMA 34 and EMA 89 have crossed each other.
Breaking the support level around the previous key zone has strengthened the bearish momentum, potentially triggering a further decline towards the next support level near 103,500 USD.
However, I’m also watching for possible reversal signals at these support levels. If BTCUSD holds above 103,500 USD and forms a higher low, we may see the bulls make a comeback.
🔴 Key Levels to Watch:
Resistance: 114,000 USD
Support: 103,500 USD
EMA Crossover: Strong Bearish Signal
Stay alert and be ready for potential market shifts! Will the bulls step in at 103,500 USD? Or will the bears continue to dominate?
Let me know your thoughts and happy trading!

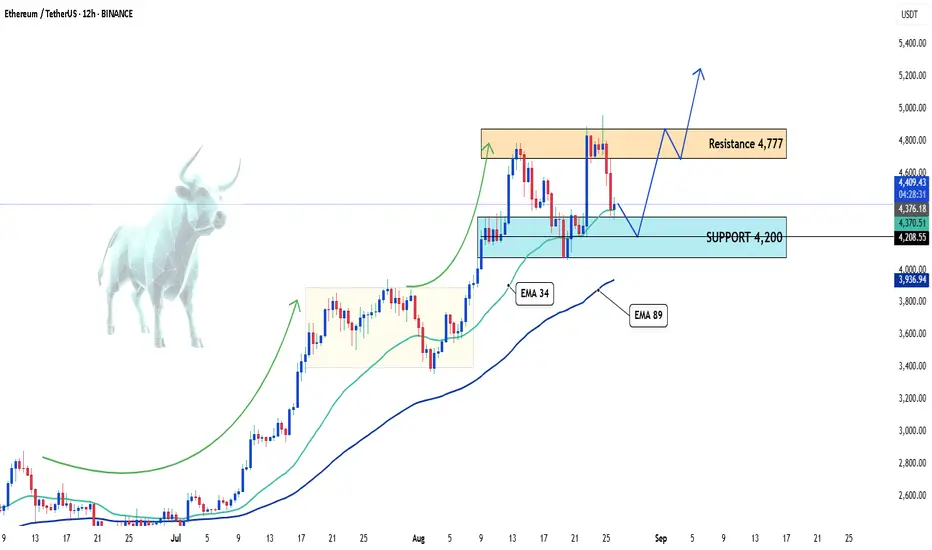
Latest Update on ETHUSDTHello, my wonderful friends! What are your thoughts on BINANCE:ETHUSDT ?
Recently, ETHUSDT has shown a strong correction after reaching a high of nearly 4,777 USD. From this point, ETH has slowed down and pulled back, but the key support level at 4,200 USD is holding up, helping the price bounce back in the short term.
We are seeing ETH trading above the EMA 34, with both EMA 34 and 89 acting as crucial dynamic support zones. If the price maintains stability above this support, the chance to push towards the 4,777 resistance level could open again.
My view is bullish. What about you? Do you think ETHUSDT will continue to break above 4,777, or will it struggle at this level? Feel free to share your thoughts!
BTCUSDT – Short-Term Opportunity?Hello everyone, glad to see you again! Let’s take a look at BINANCE:BTCUSDT .
Today, BTCUSDT is trading around 113,400 USDT, after multiple rebounds from the 112,550 USDT support zone. At the time of writing, the pair is once again testing this level. However, on the 1H timeframe, the price remains under pressure from the descending trendline and has not yet managed to break above it.
If the price continues to be rejected at the trendline, I expect a deeper move towards the 110,000 USDT zone or even lower support levels as shown on the chart.
It’s crucial to monitor how BTC reacts around the descending trendline and the key support area to identify potential opportunities.
Wishing you smooth and successful trades!

USDJPY Faces Limited Upside Amid Fed and BoJ SignalsThe FX:USDJPY pair edged higher after losing about 1% in the previous session and is now trading around 147.22. However, the upside momentum may be capped as the Japanese yen (JPY) could regain strength following hawkish comments from Bank of Japan Governor Kazuo Ueda at the Jackson Hole symposium on Saturday.
Additionally, USD/JPY may come under renewed pressure as the U.S. dollar (USD) faces challenges due to the increasing likelihood of a Fed rate cut in September, stemming from Fed Chair Jerome Powell’s dovish remarks at Jackson Hole on Friday.
From a technical perspective, USDJPY recently marked its decline with a sharp, vertical bearish candle. A retracement is currently underway, but sellers still hold the advantage as the EMA 34 and 89 have turned bearish, and the 0.5 – 0.618 Fibonacci retracement zone has yet to be broken.

Gold Declines Until the End of the SessionHello everyone, what do you think about the trend of OANDA:XAUUSD ?
Gold continues its downward trend into the close of the session, currently settling at 3,335 USD and moving near the final support zone . The precious metal remains under pressure as the US Producer Price Index (PPI) rose by 0.9% in July.
From a technical perspective, the recent news continues to act as a barrier for XAUUSD, with the price moving below both the EMA 34 and EMA 89 and being limited by the trendline.
The price wedge is pushing gold down towards lower price zones, and as mentioned, gold is now testing the final support level (in the short term). If this level continues to break, the next target for sellers could be the round level of 3,300 USD.
What do you think about the trend of XAUUSD? Leave your thoughts in the comments!

EURUSD – Eyes on the 1.177 Resistance for the Next Big MoveHello everyone, let’s talk about FX:EURUSD !
EURUSD is currently trading around 1.1660 after a steady recovery from multiple support levels, with the key support near 1.1557. The pair’s previous sharp decline started exactly at the 1.177 resistance level, making this zone a crucial reference point for traders in the coming sessions.
From a technical perspective, the market is showing short-term bullish momentum, supported by price holding above the moving averages. However, the 1.177 zone remains a strong resistance, where sellers previously regained control and triggered a significant drop.
If price climbs back into this area, it’s important to watch for potential rejection signals. A confirmed bearish reversal from 1.177 could present a great opportunity for those looking to sell.
What about you? What’s your view on EURUSD?

S&P going downHello,
I think we have a bear goingon for S&P and these trade wars are going to make matters worse... I think it is going down on the daily.
Appreciate all the likes and comments!
Best of luck!

