ENAUSDT Forming Falling WedgeENAUSDT is forming a clear falling wedge pattern, a classic bullish reversal signal that often indicates an upcoming breakout. The price has been consolidating within a narrowing range, suggesting that selling pressure is weakening while buyers are beginning to regain control. With consistent volume confirming accumulation at lower levels, the setup hints at a potential bullish breakout soon. The projected move could lead to an impressive gain of around 140% to 150% once the price breaks above the wedge resistance.
This falling wedge pattern is typically seen at the end of downtrends or corrective phases, and it represents a potential shift in market sentiment from bearish to bullish. Traders closely watching ENAUSDT are noting the strengthening momentum as it nears a breakout zone. The good trading volume adds confidence to this pattern, showing that market participants are positioning early in anticipation of a reversal.
Investors’ growing interest in ENAUSDT reflects rising confidence in the project’s long-term fundamentals and current technical strength. If the breakout confirms with sustained volume, this could mark the start of a fresh bullish leg. Traders might find this a valuable setup for medium-term gains, especially as the wedge pattern completes and buying momentum accelerates.
✅ Show your support by hitting the like button and
✅ Leaving a comment below! (What is your opinion about this Coin?)
Your feedback and engagement keep me inspired to share more insightful market analysis with you!
ENABTC

#ENA/USDT : Bullish Setup#ENA
The price is moving within an ascending channel on the 1-hour timeframe and is adhering to it well. It is poised to break out strongly and retest the channel.
We have a downtrend line on the RSI indicator that is about to break and retest, which supports the upward move.
There is a key support zone in green at 0.2346, representing a strong support point.
We have a trend of consolidation above the 100-period moving average.
Entry price: 0.2409
First target: 0.2440
Second target: 0.2520
Third target: 0.2630
Don't forget a simple money management rule:
Place your stop-loss order below the green support zone.
Once you reach the first target, save some money and then change your stop-loss order to an entry order.
For any questions, please leave a comment.
Thank you.

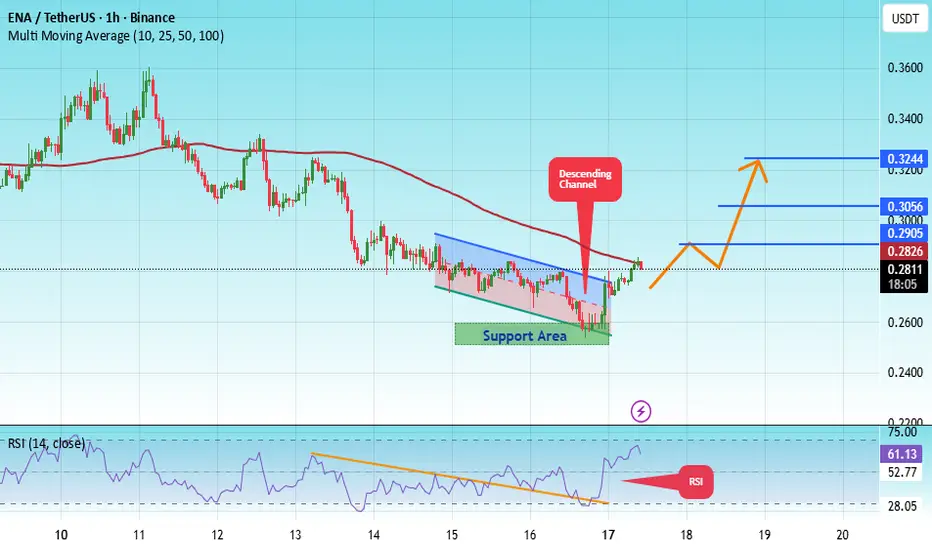
#ENA/USDT setting up for its next leg higher.#ENA
The price is moving within an ascending channel on the 1-hour timeframe and is adhering to it well. It is poised to break out strongly and retest the channel.
We have a downtrend line on the RSI indicator that is about to break and retest, which supports the upward move.
There is a key support zone in green at 0.2550, representing a strong support point.
We have a trend of consolidation above the 100-period moving average.
Entry price: 0.2800
First target: 0.2900
Second target: 0.3056
Third target: 0.3244
Don't forget a simple money management rule:
Place your stop-loss order below the green support zone.
Once you reach the first target, save some money and then change your stop-loss order to an entry order.
For any questions, please leave a comment.
Thank you.
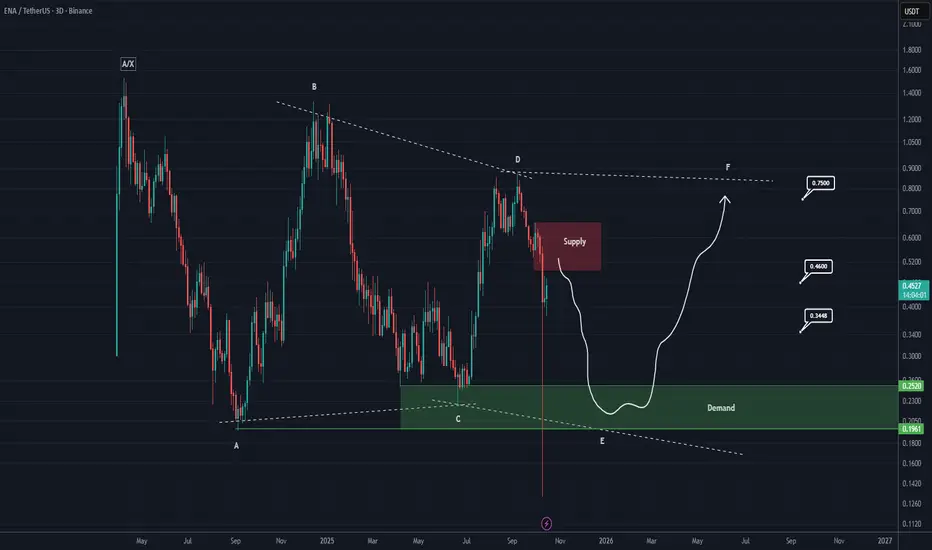
ENA Analysis (3D)It seems that ENA is forming a corrective diametric pattern, where wave E can extend from the red zone to the green zone. This means the price may experience a time–price correction lasting for several months.
The targets for the next bullish wave are marked on the chart. These targets will take time to be reached.
This is the overall outlook for ENA on the higher timeframes.
For risk management, please don't forget stop loss and capital management
When we reach the first target, save some profit and then change the stop to entry
Comment if you have any questions
Thank You
BUY AND HOLDHello friends
Given the potential and good support that this currency has and the power of buyers, now that the price has corrected, you can buy in stages with capital and risk management and move with it to the specified goals.
Note that the holding period is at least 3 months, so be patient and observe capital management.
*Trade safely with us*

ENA Looks Bearish (12H)ENA is one of the symbols that has rallied strongly and has now reached strong resistance zones. A bearish 3D formation is visible on the chart, and momentum has dropped significantly, which may indicate the start of a bearish trend for ENA.
Currently, it is near a weak support that may cause temporary pullbacks to the upside, providing opportunities to open sell/short positions. One entry can be taken on a pullback upward, and another if the price reaches the red SWAP zone.
The target can be the green box area.
A daily candle closing above the invalidation level will invalidate this outlook.
For risk management, please don't forget stop loss and capital management
When we reach the first target, save some profit and then change the stop to entry
Comment if you have any questions
Thank You

#ENA/USDT - BEARISH CORRECTION AWAITED?#ENA
The price is moving within a descending channel on the 1-hour frame, adhering well to it, and is heading for a strong breakout and retest.
We have a bearish trend on the RSI indicator that is about to be broken and retested, which supports the upward breakout.
There is a major support area in green at 6900, which represents a strong support point.
We are heading for consolidation above the 100 moving average.
Entry price: 0.7040
First target: 0.7070
Second target: 0.7150
Third target: 0.7300
Don't forget a simple matter: capital management.
When you reach the first target, save some money and then change your stop-loss order to an entry order.
For inquiries, please leave a comment.
Thank you.

ENAUSDT UPDATE#ENA
UPDATE
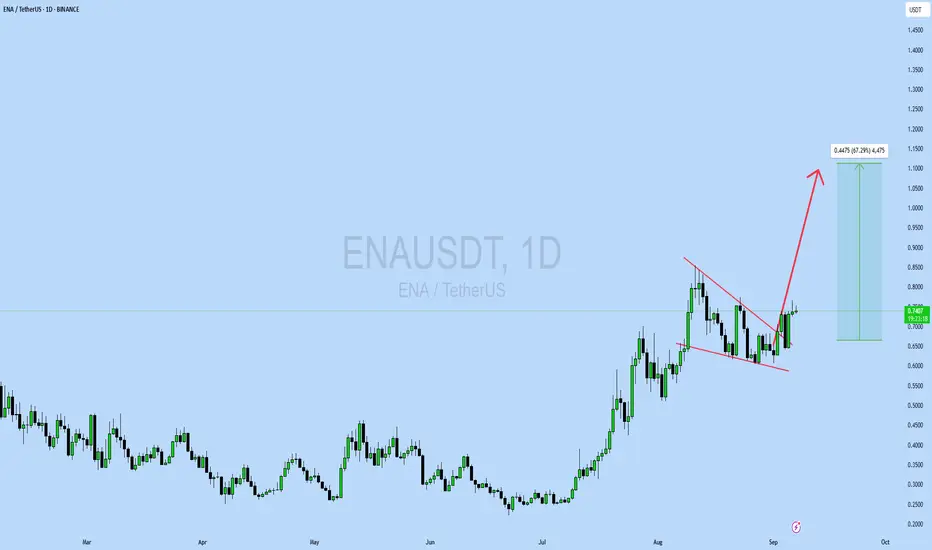
ENA Technical Setup
Pattern : Bullish Falling Wedge Pattern
Current Price: $0.7401
Target Price: $1.18
Target % Gain: 67.29%
Technical Analysis: ENA has broken out of a falling wedge on the 1D chart with bullish continuation signs. The breakout is supported by strong structure and upside momentum, pointing towards $1.18 in the coming sessions.
Time Frame: 1D
Risk Management Tip: Always use proper risk management.
ENA About to Explode or Dump? Key Levels You Can’t Ignore!Yello Paradisers — are you positioned right for the next potential explosion in #ENA, or will you get caught on the wrong side of the move like most retail traders? After a brutal grind in a descending channel, something big is brewing... and it’s coming faster than many realize. Let's dive in.
💎#ENAUSDT currently facing a key resistance at the upper boundary of the descending channel, clearly tested multiple times and respected well by the market structure. A candle close above this channel would trigger a confirmed breakout, which opens up a clean path for continued upside movement — the next major target sits at the resistance zone between 0.446 and 0.4725.
💎There’s a high-probability alternative setup unfolding as well: ENA holding the S/R level around 0.3448 and the demand zone below, which aligns perfectly with the multi-timeframe EMA support. If this area holds strong, expect another impulse move toward our resistance zone as momentum builds.
💎Price had been forming lower highs and lower lows, respecting the downtrend But recently we observed a Clear Change of Character (ChoCH) — ENA broke market structure by forming a higher high.What usually follows? A higher low, and that’s where we are now.
💎The most probable scenario is for price to pull back to the S/R level or dip into the demand zone, and then form a higher low before making the next leg upward toward resistance.
💎Invalidation is simple and must be respected: if we see a confirmed candle close below 0.2798, then the bullish case breaks and the setup is no longer valid. This is where you must cut quickly, avoid hope-trading, and reassess the structure from scratch.
Don’t chase. Don’t panic. React with strategy, not emotion. This is how real professionals win in crypto. Stay sharp, Paradisers.
MyCryptoParadise
iFeel the success🌴

#ENA/USDT#ENA
The price is moving within a descending channel on the 1-hour frame, adhering well to it, and is heading for a strong breakout and retest.
We are seeing a bounce from the lower boundary of the descending channel, which is support at 0.3430.
We have a downtrend on the RSI indicator that is about to be broken and retested, supporting the upward trend.
We are looking for stability above the 100 moving average.
Entry price: 0.3521
First target: 0.3608
Second target: 0.3728
Third target: 0.3882

#ENA/USDT#ENA
The price is moving within a descending channel on the 1-hour frame, adhering well to it, and is heading for a strong breakout and retest.
We are experiencing a rebound from the lower boundary of the descending channel, which is support at 0.3700.
We are experiencing a downtrend on the RSI indicator, which is about to break and retest, supporting the upward trend.
We are looking for stability above the 100 Moving Average.
Entry price: 0.3911
First target: 0.4100
Second target: 0.4235
Third target: 0.4410

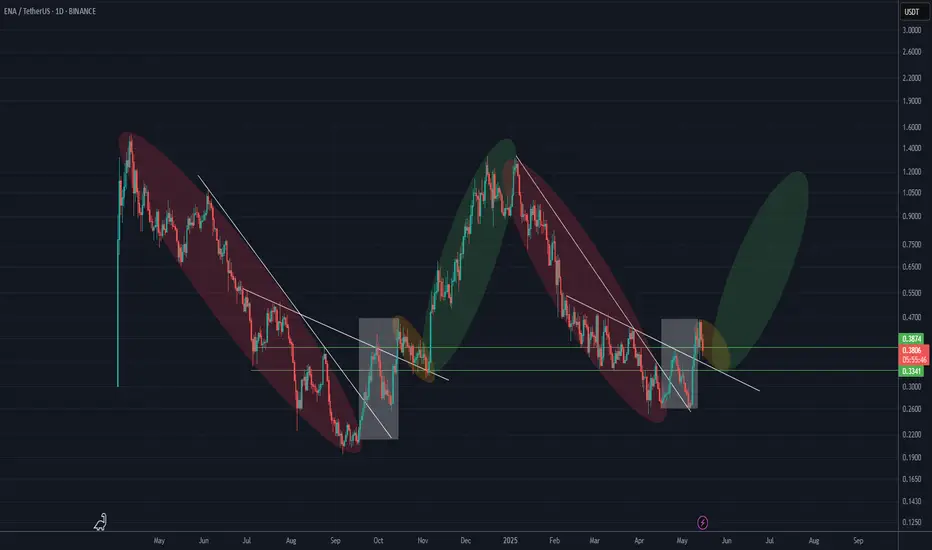
ENA is repeating a bullish fractal (1D)Look at the red, white, yellow, and green boxes in order, and then pay attention to the white trigger lines. You’ll notice that the previous phases | the end of the bearish trend (red box), followed by a bullish move for breakout (white box), then a pullback (yellow box), and finally the main bullish move (green box) | are now repeating.
Also, the price is currently sitting within the trading range marked by the two green lines, which is a key area. After the pullback is completed, a bullish wave is expected to begin, potentially reaching at least around the previous all-time high (ATH).
For risk management, please don't forget stop loss and capital management
Comment if you have any questions
Thank You
#ENA/USDT#ENA
The price is moving within a descending channel on the 1-hour frame, adhering well to it, and is heading for a strong breakout and retest.
We are seeing a rebound from the lower boundary of the descending channel, which is support at 0.2800.
We have a downtrend on the RSI indicator that is about to break and retest, supporting the upward trend.
We are looking for stability above the 100 moving average.
Entry price: 0.2935
First target: 0.3020
Second target: 0.3100
Third target: 0.3200

#ENA/USDT#ENA
The price is moving within a descending channel on the 1-hour frame, adhering well to it, and is heading for a strong breakout and retest.
We are experiencing a rebound from the lower boundary of the descending channel, which is support at 0.3530.
We are experiencing a downtrend on the RSI indicator, which is about to break and retest, supporting the upward trend.
We are looking for stability above the 100 Moving Average.
Entry price: 0.3700
First target: 0.3820
Second target: 0.3950
Third target: 0.4118

ENA Rebuy Setup (1D)The ENA structure has been bearish for a while. Given its significant drop and the upcoming support zones, we have identified two potential entry points for this asset. The target is marked on the chart.
A daily candle closing below the invalidation level will invalidate this analysis.
Do not enter the position without capital management and stop setting
Comment if you have any questions
thank you

#ENA/USDT#ENA
The price is moving in a descending channel on the 1-hour frame and is expected to continue upwards
We have a trend to stabilize above the moving average 100 again
We have a descending trend on the RSI indicator that supports the rise by breaking it upwards
We have a support area at the lower limit of the channel at a price of 0.3880
Entry price 0.4480
First target 0.4870
Second target 0.5224
Third target 0.5700

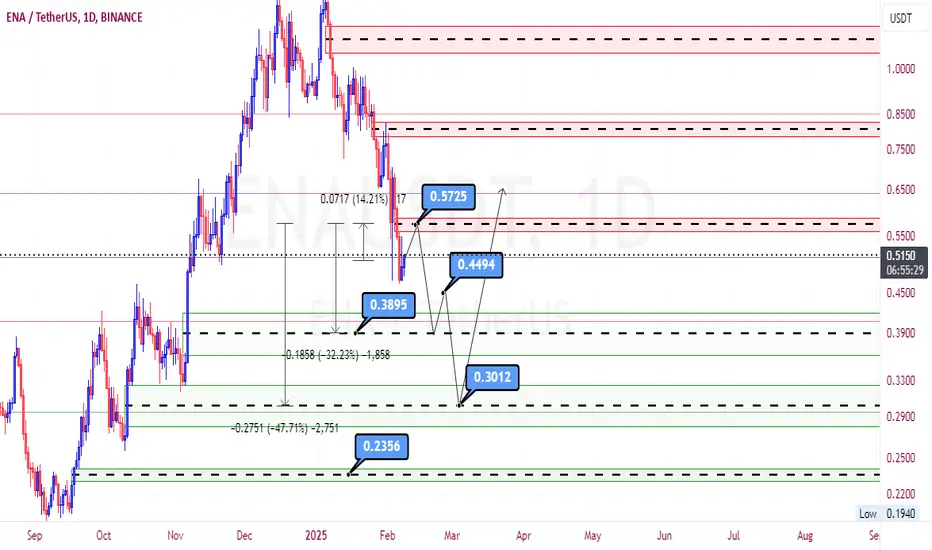
Analysis of currency $ENAIntroduction:
The MIL:ENA token is fundamentally one of the relatively good currencies in the market. Therefore, it can be beneficial for long-term investment. However, buying at these prices is not recommended for the long term, and in the next season of the market, as we enter the cryptocurrency winter, an updated analysis for accumulating this token will be provided. Of course, many fundamental issues in the entire crypto market may undergo unforeseen changes, so discussing the distant future is not very logical.
Short-term analysis:
I strongly believe that in the coming days, the price will reach $0.572, which represents about 14% profit. However, from there, it is likely that the price will be pushed back and revert to lower levels around $0.3895.
Mid-term analysis:
There is a high probability that if the market wants to correct, the price could even see lower levels around $0.3012. I guess the market can be well supported and rise from this price. If a fear atmosphere prevails in the market and negative news for altcoins is presented doubly, reaching a price of $0.2356 is not out of reach.
In my opinion, if you intend to purchase this currency during the upcoming alt season, place your first buy step around $0.3012 and your second buy step around $0.2356. I recommend just these two steps. Buying at higher numbers does not seem logical from my perspective. Also, allocate a larger percentage of your purchase to the second step. It should be noted that this analysis is suited for a trader with a medium risk profile in this market. If you are more optimistic about this market, you can make your purchases at higher levels.
At the end, I would be pleased to receive your valuable comments regarding the price movement in this chart below this analysis.
ENA rebuy setup (1D)This is one of the symbols that Trump had invested in. It now appears that a supercycle has completed, and the price has entered a new wave phase (wave E).
The low-risk area for rebuying in spot trading includes the two entries we have highlighted on the chart.
Minimum targets are indicated on the chart. If ENA can stabilize above the supply zone, it may become very bullish again.
The closure of a daily candle below the invalidation level will invalidate this analysis.
For risk management, please don't forget stop loss and capital management
Comment if you have any questions
Thank You


#ENA/USDT Ready to go up#ENA
The price is moving in a descending channel on the 15-minute frame and sticking to it well
We have a bounce from the lower limit of the descending channel, this support is at 0.6900
We have a downtrend on the RSI indicator that is about to be broken, which supports the rise
We have a trend to stabilize above the moving average 100
Entry price 0.7000
First target 0.7190
Second target 0.7389
Third target 0.7600

#ENA/USDT#ENA
The price is moving in a descending channel on the 4-hour frame upwards and is expected to continue.
We have a trend to stabilize above the moving average 100 again.
We have a downtrend on the RSI indicator that supports the rise by breaking it upwards.
We have a support area at the lower limit of the channel at a price of 0.33100.3800.
Entry price 0.2800.
First target 0.4174.
Second target 0.4435.
Third target 0.4637.

#ENA/USDT#ENA
The price has broken the descending channel on the 1-hour frame. To the upside and is expected to continue
We have a trend to stabilize above the moving average 100 again
We have an upward trend on the RSI indicator that supports the rise by breaking it to the upside
We have a support area at the lower limit of the channel at a price of 0.2700
Entry price 0.2900
First target 0.3300
Second target 0.3609
Third target 0.3963

ENAUSDT Resistance Breakout!ENAUSDt technical analysis update
ENA is breaking the resistance trendline after 20 days of consolidation on the 4H chart. We can expect a strong bullish move from the current level, as the price is trading above the 100 EMA.
Regards
Hexa
