ENA/USDT at a Critical Demand Zone – Bounce or Breakdown Ahead?ENA/USDT is currently in a strong bearish phase on the 3D timeframe. After failing to hold the distribution area above 0.80, price experienced a sharp and sustained decline, returning to a highly significant historical demand zone. The yellow zone at 0.212 – 0.190 is a critical area that will determine the next major move.
---
Market Structure & Price Action
Overall structure remains Lower High – Lower Low (bearish trend)
Strong breakdown from the 0.40 → 0.28 area confirms bearish continuation
Price is now testing a major multi-month demand zone
Market reaction here will define whether we see a technical rebound or further breakdown
---
Pattern Explanation
1. Descending Market Structure (Bearish Continuation)
Price has formed consistent lower highs since the 0.80 peak, showing dominant selling pressure.
2. Strong Demand Retest The 0.212 – 0.190 zone represents:
Previous accumulation area
Historical strong bounce level
Last major demand before potential deeper price discovery
3. Potential Dead Cat Bounce (if volume remains weak) A weak bounce without strong volume may only be a temporary pullback before continuation lower.
---
Key Levels
Support (Demand Zone):
0.212 – 0.190 (major demand / yellow zone)
Resistance (Supply Levels):
0.245
0.285
0.400
0.500
0.615
0.805
---
Bullish Scenario
The bullish scenario is valid only if price reacts strongly from the demand zone.
Conditions:
Price holds above 0.190
Clear rejection or bullish candle formation
Ideally supported by increasing volume
Potential upside targets:
0.245 (minor resistance)
0.285
0.400 (major resistance)
0.500 (extension target if momentum builds)
Note:
This bullish move would be considered a technical rebound, not a full trend reversal unless a higher-low structure is established.
---
Bearish Scenario
This scenario activates if the demand zone fails.
Conditions:
Daily / 3D candle close below 0.190
Lack of meaningful buying reaction
Downside risk:
Demand breakdown → bearish continuation
Potential capitulation phase
Lower prices become likely due to the absence of strong historical support below
---
Conclusion
ENA/USDT is currently at a critical decision zone.
A strong reaction from 0.212 – 0.190 could trigger a technical rebound
A confirmed breakdown would reinforce the broader bearish trend with deeper downside risk
Patience and confirmation are key due to elevated risk conditions.
---
#ENAUSDT #ENA #CryptoAnalysis #TechnicalAnalysis
#Altcoin #Binance #Downtrend #DemandZone
#SupportResistance #PriceAction
ENAUSD

ETHENA ENA ENAUSD 3D-1W TFThis coin can clearly be considered a pump-and-dump asset as it consistently falls to the accumulation zone and then rapidly goes upward.
However! it’s important to keep in mind that exchanges tend to train traders to expect a specific pattern.
Once the majority notices it and starts buying aggressively in the accumulation zone again the coin may simply be dumped and scammed leaving traders with nothing

Ethena ENA price analysisIs CRYPTOCAP:ENA setting up for a trend reversal?
The OKX:ENAUSDT daily chart is repeating familiar patterns typically seen at the early stages of an uptrend. While this doesn’t guarantee continuation, the structure is worth monitoring.
Key Levels
• Downside risk: –25% to retest the previous lows
• Upside target: +200% toward the upper consolidation range
• Higher targets remain possible if momentum expands
Thesis
The current structure offers a favorable risk-to-reward ratio for mid-term traders, provided CRYPTOCAP:ENA maintains local support and CRYPTOCAP:BTC volatility doesn’t accelerate.
Question:
Do you consider this a valid accumulation zone for CRYPTOCAP:ENA , or is the market still too fragile?
______________
◆ Follow us ❤️ for daily crypto insights & updates!
🚀 Don’t miss out on important market moves
🧠 DYOR | This is not financial advice, just thinking out loud

FireHoseReel : ENA : Ethena Charging Toward Daily Resistance🔥 Welcome FireHoseReel !
Let’s dive into the ENA setup and break down the key levels.
👀 ENA – 4H Timeframe Analysis
ENA is approaching its daily resistance on the 4H chart, and a confirmed breakout above this level can activate our long trigger and push price higher with momentum.
📊 Volume Analysis
ENA showed a clear volume increase during the breakout of its descending pattern (falling channel) — an early signal that a new bullish phase could be forming.
However, breaking the nearby daily resistance requires another strong wave of buy volume; without it, price may face rejection.
🔁 ENA/BTC – A Different Perspective Looking at ENA/BTC, we can see that this pair is also moving toward a key daily resistance level, just like ENA/USDT.
A breakout on the BTC pair could accelerate momentum and help ENAUSDT trigger earlier.
The structural overlap between the two charts gives strong confluence and increases confidence in our setups.
📌 Trading Scenarios
🔼 Long Scenario
• Daily resistance at 0.2814 breaks
• Buy volume increases
• Volume convergence forms after the breakout
• This activates the long trigger and may lead to higher continuation.
🔽 Short Scenario
cal support at 0.2267 breaks
• Sellers gain control and strong sell pressure appears
• This scenario can trigger a deeper sell-off.
🎯 Personal View
I personally prefer the long scenario, especially since ENA was recently listed on Hyperliquid Spot, which may boost liquidity and accelerate upward momentum.
🛞 Risk Management & Disclaimer
Please remember to always use proper risk management and position sizing. Nothing in this analysis is financial advice. The market can change quickly, so always trade based on your own strategy, research, and risk tolerance. You are fully responsible for your own trades.

#ENA/USDT : Bullish Setup#ENA
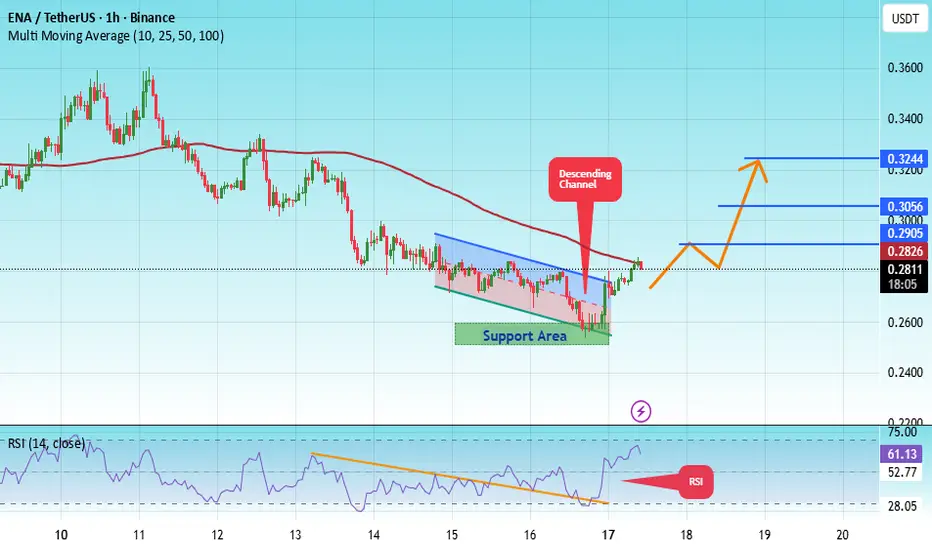
The price is moving within an ascending channel on the 1-hour timeframe and is adhering to it well. It is poised to break out strongly and retest the channel.
We have a downtrend line on the RSI indicator that is about to break and retest, which supports the upward move.
There is a key support zone in green at 0.2346, representing a strong support point.
We have a trend of consolidation above the 100-period moving average.
Entry price: 0.2409
First target: 0.2440
Second target: 0.2520
Third target: 0.2630
Don't forget a simple money management rule:
Place your stop-loss order below the green support zone.
Once you reach the first target, save some money and then change your stop-loss order to an entry order.
For any questions, please leave a comment.
Thank you.

#ENA/USDT setting up for its next leg higher.#ENA
The price is moving within an ascending channel on the 1-hour timeframe and is adhering to it well. It is poised to break out strongly and retest the channel.
We have a downtrend line on the RSI indicator that is about to break and retest, which supports the upward move.
There is a key support zone in green at 0.2550, representing a strong support point.
We have a trend of consolidation above the 100-period moving average.
Entry price: 0.2800
First target: 0.2900
Second target: 0.3056
Third target: 0.3244
Don't forget a simple money management rule:
Place your stop-loss order below the green support zone.
Once you reach the first target, save some money and then change your stop-loss order to an entry order.
For any questions, please leave a comment.
Thank you.
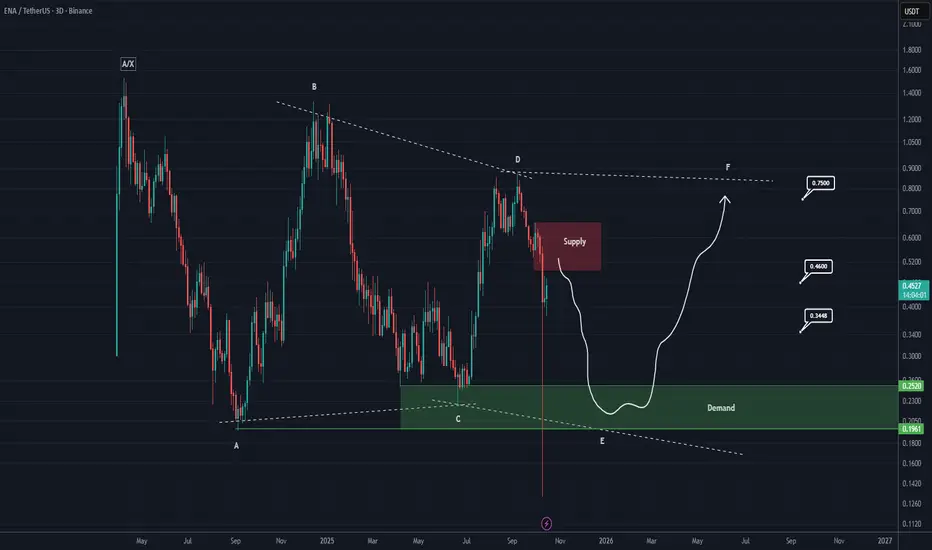
ENA Analysis (3D)It seems that ENA is forming a corrective diametric pattern, where wave E can extend from the red zone to the green zone. This means the price may experience a time–price correction lasting for several months.
The targets for the next bullish wave are marked on the chart. These targets will take time to be reached.
This is the overall outlook for ENA on the higher timeframes.
For risk management, please don't forget stop loss and capital management
When we reach the first target, save some profit and then change the stop to entry
Comment if you have any questions
Thank You
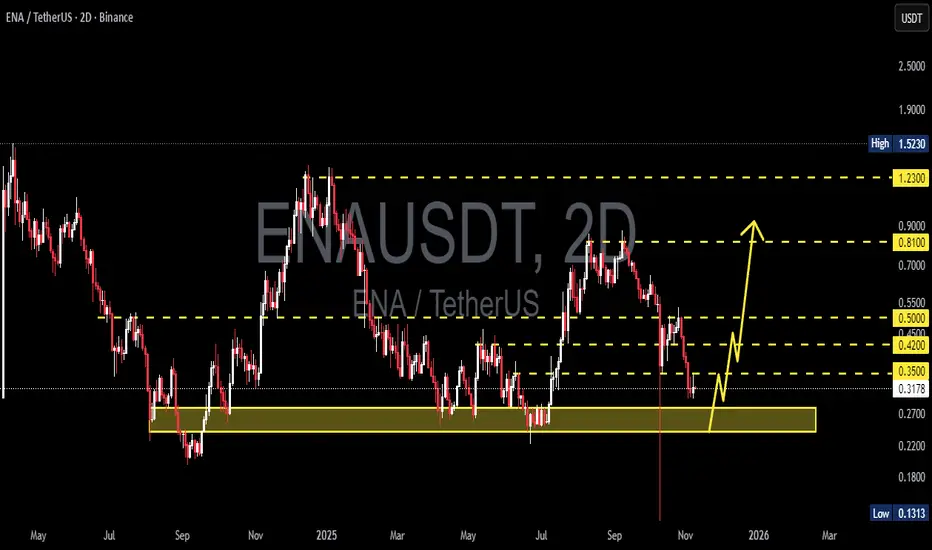
ENA/USDT – Ready for a Strong Rebound or a Deeper Fall?ENA is currently at one of its most critical moments. After a prolonged distribution phase and a consistent bearish trend from the highs around 0.80–1.20, the price has now returned to the strong historical demand zone at 0.28–0.24 — an area that previously served as the foundation for a major bullish rally.
This zone represents the “last fortress” of buyers. If it holds and forms a clear reversal pattern, ENA has a strong chance to stage a significant rebound. However, if it breaks down, the bearish continuation could accelerate sharply toward the 0.18–0.13 psychological support levels.
---
Structure & Pattern Analysis
Main trend: still bearish, but price is approaching a potential bottoming phase.
Current structure: likely forming an accumulation base around the demand zone — similar to a double-bottom or a descending structure losing momentum.
Key confirmation: a 2D candle close above 0.35 would be the first solid sign of buyer strength and a potential early reversal.
If this demand zone triggers a bounce like before, ENA could enter a mini bullish cycle targeting the 0.42–0.50 resistance range.
---
Bullish Scenario (Reversal Setup)
If the 0.28–0.24 zone successfully acts as support again:
1. Reversal signs: a strong bullish engulfing or pin bar on the 2D timeframe showing renewed buying pressure.
2. Upside targets:
0.35 → first confirmation level.
0.42–0.50 → mid-term profit-taking zone.
0.81 → extended target if bullish momentum continues.
3. Extra confirmation: rising volume and bullish RSI divergence would validate the strength of the rebound.
Under this setup, ENA could deliver a 30–80% recovery swing in the medium term.
---
Bearish Scenario (Breakdown Setup)
However, if sellers continue to dominate and price closes below 0.24 on the 2D timeframe, then:
1. Demand zone failure would signal a transition from accumulation to a new markdown phase.
2. Next downside targets:
Minor support near 0.20
Major support at 0.13 (historical low).
3. Bearish confirmation: high-volume breakdown followed by a failed retest around 0.28 would confirm continuation of the downtrend.
This could trigger a capitulation phase before a new bottom forms.
---
Trading Opportunities & Strategy
Aggressive traders: may look for early entries around 0.28–0.24 with tight risk management (stop below 0.22). Initial targets: 0.35–0.42.
Conservative traders: wait for a confirmed breakout and 2D close above 0.35 before entering for a safer reversal play.
Swing traders: best entry after a successful retest of 0.28–0.35 with strong volume and bullish confirmation.
---
Conclusion
ENA is standing at a make-or-break level that will define its medium-term direction.
If 0.28–0.24 holds, a strong rebound is likely to unfold.
If it breaks, the bearish trend could extend toward 0.18–0.13.
This is the “decision phase” for ENA — whether it’s preparing a reaccumulation structure for a new bullish leg or continuing into a deeper bearish spiral.
---
#ENA #ENAUSDT #CryptoAnalysis #TechnicalAnalysis #PriceAction #DemandZone #SupportAndResistance #SwingTrade #MarketStructure #CryptoTA #ReversalZone
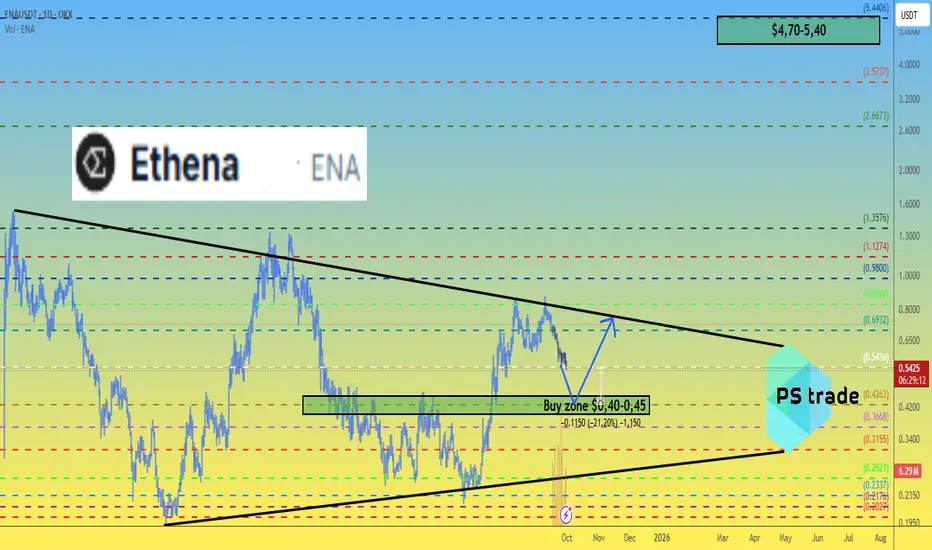
Ethena ENA price analysis🔗 #Ethena ( #ENA ) is part of the #Ethereum ecosystem and looks fundamentally strong.
⏳ The current OKX:ENAUSDT consolidation strongly resembles CRYPTOCAP:ETH phases before major rallies.
🛡️ Key support: $0.40–0.45 — buyers need to hold this level.
📈 If successful, there’s potential for a 10x growth, with market cap rising from $3B to $30B — realistic in today’s market.
📊 Conclusion: this support zone is crucial for ENA’s future trend.
🤔 Do you believe Ethena can repeat Ethereum’s story?
______________
◆ Follow us ❤️ for daily crypto insights & updates!
🚀 Don’t miss out on important market moves
🧠 DYOR | This is not financial advice, just thinking out loud.
BUY AND HOLDHello friends
Given the potential and good support that this currency has and the power of buyers, now that the price has corrected, you can buy in stages with capital and risk management and move with it to the specified goals.
Note that the holding period is at least 3 months, so be patient and observe capital management.
*Trade safely with us*

ENA Looks Bearish (12H)ENA is one of the symbols that has rallied strongly and has now reached strong resistance zones. A bearish 3D formation is visible on the chart, and momentum has dropped significantly, which may indicate the start of a bearish trend for ENA.
Currently, it is near a weak support that may cause temporary pullbacks to the upside, providing opportunities to open sell/short positions. One entry can be taken on a pullback upward, and another if the price reaches the red SWAP zone.
The target can be the green box area.
A daily candle closing above the invalidation level will invalidate this outlook.
For risk management, please don't forget stop loss and capital management
When we reach the first target, save some profit and then change the stop to entry
Comment if you have any questions
Thank You

#ENA/USDT - BEARISH CORRECTION AWAITED?#ENA
The price is moving within a descending channel on the 1-hour frame, adhering well to it, and is heading for a strong breakout and retest.
We have a bearish trend on the RSI indicator that is about to be broken and retested, which supports the upward breakout.
There is a major support area in green at 6900, which represents a strong support point.
We are heading for consolidation above the 100 moving average.
Entry price: 0.7040
First target: 0.7070
Second target: 0.7150
Third target: 0.7300
Don't forget a simple matter: capital management.
When you reach the first target, save some money and then change your stop-loss order to an entry order.
For inquiries, please leave a comment.
Thank you.

ENA ; SIGNALHello friends
Given the good growth we had, now the price can move to the set targets if it is fixed in the specified support areas.
*Trade safely with us*

ENA Bullish Flag Breakout – Next Leg Up?ENA has shown impressive strength, rallying over 235% from the bottom. After this strong move, price consolidated into a bullish flag formation, a continuation pattern often seen before the next leg up.
On the daily chart, a breakout has been confirmed, with price now preparing for further upside. Both the 100 and 200 EMA are acting as strong support at the bottom of the flag, while price is also holding above the volume support zone, adding confluence to the bullish setup.
If momentum continues, ENA has the potential to extend this breakout toward higher targets in the coming weeks. Proper risk management remains key, but the technical structure suggests the bulls are in control.
Cheers
Hexa

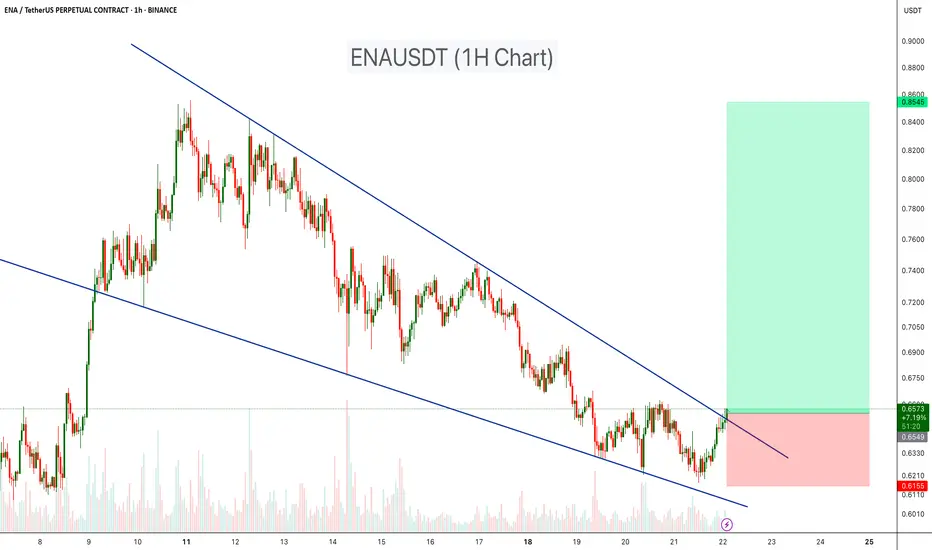
ENAUSDT – Falling Wedge Breakout in PlayENAUSDT on the 1H chart is forming a falling wedge pattern, which is typically a bullish reversal signal. After a consistent downtrend, the price is now testing the upper wedge resistance.
A breakout above this level could confirm bullish momentum, with potential upside toward the 0.85 USDT target zone.
Resistance 1:0.72
Resistance 2:0.79
Resistance 3:0.85
Stop loss: $0.615
Cheers
Hexa
ENAUSD 1D Golden Cross targets 1.10500.Ethena (ENAUSD) has been trading within a Triangle pattern ever since it's very start and since the June 22 Low it's been unfolding the new Bullish Leg
Following the formation of a 1D Golden Cross (August 08), this sequence resembles the November 28 2024 Bullish Cross, which was the pattern's previous Bullish Leg that peaked just above the 0.9 Fibonacci retracement level.
Based on that, our short-term Target is 1.10500 right at the top of the Triangle.
-------------------------------------------------------------------------------
** Please LIKE 👍, FOLLOW ✅, SHARE 🙌 and COMMENT ✍ if you enjoy this idea! Also share your ideas and charts in the comments section below! This is best way to keep it relevant, support us, keep the content here free and allow the idea to reach as many people as possible. **
-------------------------------------------------------------------------------
💸💸💸💸💸💸
👇 👇 👇 👇 👇 👇

Ethena Bullish Momentum Builds, Eyes 30% Rally to $0.85Hello✌
Let’s analyze Ethena’s upcoming price potential 📈.
BINANCE:ENAUSDT has demonstrated strong bullish momentum recently, supported by positive fundamental developments 📈. The price is currently near key daily and Fibonacci support levels. If these hold, a potential 30% upside targeting $0.85 looks likely 🚀.
✨We put love into every post!
Your support inspires us 💛 Drop a comment we’d love to hear from you! Thanks , Mad Whale

ENA / USDT#ENA / USDT
Iam expecting big returns from ETH and its related coins in this season
This chart is also looking good
Another Potential round bottom pattern under formation
Keep an eye

Long-Term Technical Analysis of ENA CoinENA coin continues its downward movement after being rejected from the $0.70 resistance level. As long as ENA holds above the 4H support level at $0.5549 with confirmed 4-hour candle closes, it is likely to attempt a rebound toward the weekly resistance zone (marked in blue).
However, if ENA loses the $0.5549 support level and closes multiple 4H candles below it, further downside momentum is expected. In such a scenario, the initial downside target would be $0.4611.
For long-term spot investments in ENA, the price range between $0.3952 and $0.3781 should be closely monitored by investors.
Our plan is to accumulate ENA coin within the $0.3952 – $0.3781 support range for long-term spot positions. If the price reaches this zone, our target will be set at $1.
Not Financial Advice (NFA).

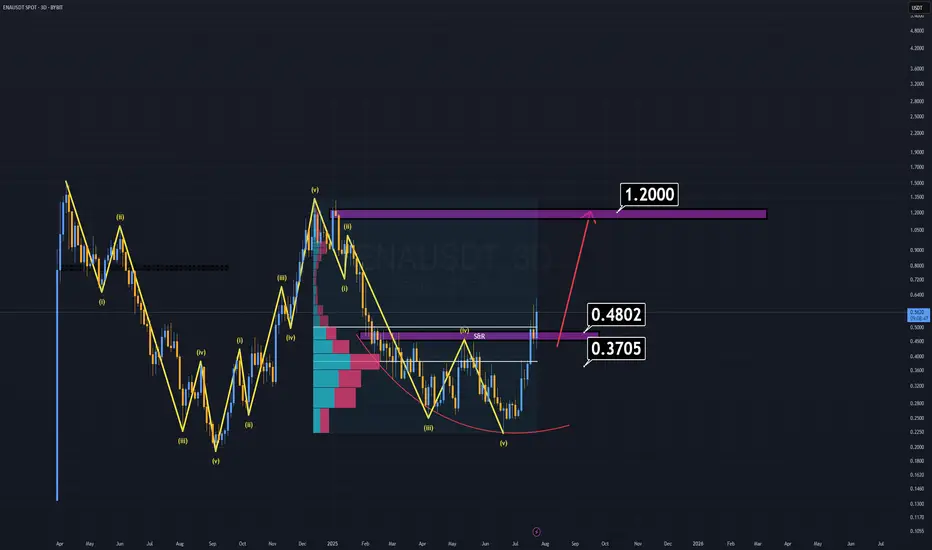
ENA Analysis (3D)ENA has been outperforming many altcoins for weeks, yet it still appears undervalued based on its fundamentals and recent investor interest.
Where to buy?
Right now, buying at current levels is extremely risky, as the ideal buy-back zones are significantly below the market price.
First major support: $0.48 — considered a "cheap" entry.
Dream entry (low probability): $0.37–$0.38 — at that point, ENA would feel almost free.
Notably, BlackRock and its partners are actively investing in ENA, which speaks volumes about its long-term credibility. That alone justifies keeping it on your radar.
Minimum target: $1.00–$1.20
Remember, that’s just the beginning. We may see even more once momentum kicks in.
Sometimes, the best trade is the one you're waiting for.
Good luck.
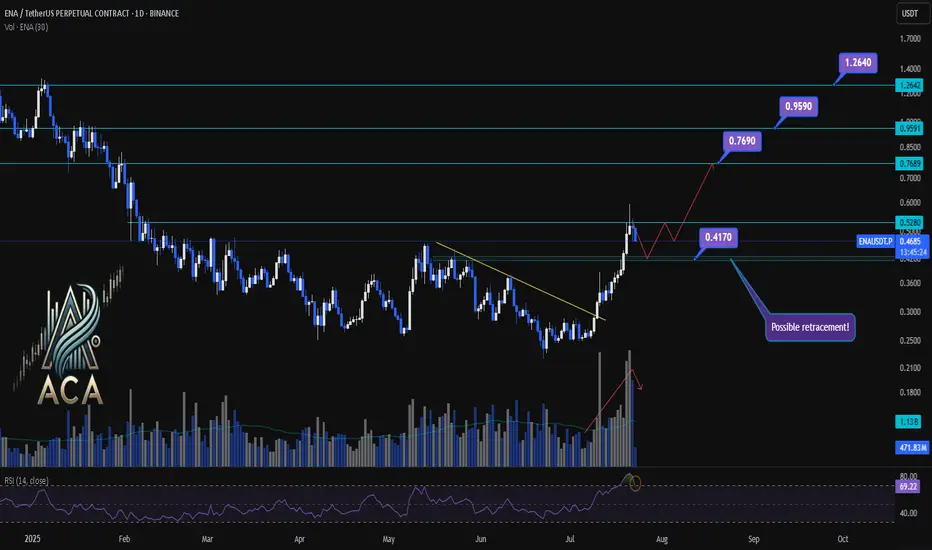
ENA/USDT Chart Analysis | Volatility Signals & Bullish TriggersENA/USDT Chart Analysis | Volatility Signals & Bullish Triggers
🔍 Let’s dive into the ENA/USDT perpetual contract and analyze recent price action, focusing on momentum shifts and key breakout scenarios.
⏳ Daily Overview
The daily chart shows that ENA recently reentered the overbought zone on the RSI, which can serve as a potential trigger for traders watching momentum shifts. Earlier, price action broke decisively above a long-standing descending trendline, resulting in a rapid, nearly 100% surge, a classic RR2 move off the trendline. This breakout coincided with a visible uptick in trading volume, confirming strong demand behind the move.
Now, during the ensuing rest or correction phase, trading volume is decreasing—often a constructive sign suggesting either profit-taking or a healthy pullback rather than panic selling.
🔺 Bullish Trigger & Setup:
- RSI Signal: Reentry into the RSI overbought zone is a potential long trigger, especially if confirmed by price action.
- Confirmation Level: A daily close with strong volume above $0.528 would add conviction to a bullish setup.
- Trendline Reference: The break above the recent trendline fueled the rapid advance, showing the importance of watching such key resistance levels.
📊 Key Targets (on further bullish confirmation):
- $0.769 — First upside resistance.
- $0.959 — Next bullish target.
- $1.264 — Extension target if momentum continues and broader market sentiment remains supportive.
🚨 Conclusion:
Eyes are on the $0.528 level—closing above it with volume, especially while RSI holds in the overbought zone, could provide the next strong entry signal. Current declining volume during pullbacks suggests this is likely a profit-taking phase or standard correction, not bearish capitulation. Keep monitoring RSI, volume profile, and price closes for the next actionable opportunity.
ENA/USDT Breakout Watch Signs of Reversal from a Key Demand Zone🔍 Full Technical Analysis:
ENA/USDT has been forming a Descending Triangle pattern since the December 2024 high — a structure often seen in continuation moves, but here it may act as a potential reversal pattern, especially since price is consolidating around a strong historical demand zone.
The price is hovering within a key support area between $0.1940–$0.2624, which has repeatedly held against bearish pressure. Recent candles are showing signs of accumulation, indicating possible base formation before a breakout.
✅ Bullish Scenario (Breakout Setup):
If the price successfully:
1. Breaks above the descending trendline (yellow line), and
2. Confirms with a breakout above the $0.28–$0.30 zone with strong volume,
We could see a powerful bullish reversal with the following upside targets:
📈 Target 1: $0.3720
📈 Target 2: $0.4569 – breakout structure confirmation
📈 Target 3: $0.6540 – prior resistance zone
📈 Target 4: $0.7702
📈 Target 5: $0.8928
💥 Extended Targets: $1.2512 – $1.3300 (Major High from December 2024)
🚨 A clean breakout from this setup may trigger major FOMO and offer multi-level swing trading opportunities.
❌ Bearish Scenario (Breakdown Risk):
If the downtrend continues and:
The price fails to break above the trendline, and
Breaks below $0.1940, which is the historical low support,
Then the door opens for further downside towards: 🔻 Bearish Target: $0.1600 or lower
⚠️ A confirmed breakdown below this key zone would suggest trend continuation and weakness in buyer interest.
🧠 Strategic Summary:
Strong Demand Zone + Historical Support suggest high probability of trend reversal.
Descending Triangle offers a textbook breakout opportunity with favorable risk-reward.
High RR potential makes this setup ideal for swing traders and mid-term investors.
💡 Success tip: Wait for breakout confirmation and volume spike before entering.
#ENAUSDT #CryptoBreakout #DescendingTriangle #BullishReversal #AltcoinSetup #CryptoTrading #SwingTrade #TechnicalAnalysis #ChartPatterns #SupportAndResistance

ENA : The largest token release...Hello dears
Given the long-term price decline that we have witnessed, it has now been announced that this currency is going to do a token release, which will naturally cause the price to fall, so be careful.
In case of a fall, we have identified important supports for you so that you can buy with risk and capital management.
The target has also been identified.
*Trade safely with us*
