EnaLooks good to be holding the range low here..
Id say that was local bottom
Chance of capitulation event all year basically... Just by the cyclic workings but most of the sell-off appears done..
ENAUSDT

Here’s Where Ethena (ENA) Price Could Go Next* Ethena has just emerged out of a bear flag, but whether it has legs to stand on or if further downside can be expected is now in question.
* The recent bounce has been a weak one, which shows a measure of restraint on the part of traders who are holding out for further signs.
* On-chain data points to stabilization, not strong buying, which keeps ENA in a wait-and-see phase for now.
When you zoom out and look at Ethena’s recent price action, it’s clear the market isn’t panicking anymore, even after a sharp breakdown.
The ENA price didn’t drift lower slowly. Once the bear flag broke, the price dropped fast, falling more than 30% in a short span. That move wiped out late buyers and cooled off the optimism that had built up during consolidation. Since then, though, the tone has shifted. Instead of continuing lower, the market looks like it’s taking a pause.
Over the past few sessions, the ENA price has been hovering around the $0.2000–$0.2100 area. This is the first zone where selling pressure has clearly slowed after the breakdown.
The price isn’t cascading lower anymore, and dips into this range are getting absorbed more quickly. That indicates sellers are losing urgency, even if buyers aren’t stepping in aggressively yet.
That matters. After slicing through multiple support levels during the selloff, this is the first place where the market seems willing to stabilize instead of accelerate lower. It doesn’t mean a bottom is in, but it does suggest the market is digesting the move rather than reacting emotionally.
On-chain data supports that view. ENA’s market cap stopped falling sharply once the price reached this area and has moved mostly sideways since. Capital isn’t rushing out anymore, even if fresh inflows haven’t arrived.
What’s next for Ethena?
The main challenge remains overhead resistance. The ENA price continues to stall near $0.2160 on the daily chart.
Every bounce so far has failed before reclaiming that level, keeping the broader trend intact. Until that zone is cleared and held, upside moves are better seen as relief bounces, not true reversals.
For now, ENA remains in wait-and-see mode. The damage has already been done, and what the market needs next isn’t hope, but confirmation.
ENA/USDT at a Critical Demand Zone – Bounce or Breakdown Ahead?ENA/USDT is currently in a strong bearish phase on the 3D timeframe. After failing to hold the distribution area above 0.80, price experienced a sharp and sustained decline, returning to a highly significant historical demand zone. The yellow zone at 0.212 – 0.190 is a critical area that will determine the next major move.
---
Market Structure & Price Action
Overall structure remains Lower High – Lower Low (bearish trend)
Strong breakdown from the 0.40 → 0.28 area confirms bearish continuation
Price is now testing a major multi-month demand zone
Market reaction here will define whether we see a technical rebound or further breakdown
---
Pattern Explanation
1. Descending Market Structure (Bearish Continuation)
Price has formed consistent lower highs since the 0.80 peak, showing dominant selling pressure.
2. Strong Demand Retest The 0.212 – 0.190 zone represents:
Previous accumulation area
Historical strong bounce level
Last major demand before potential deeper price discovery
3. Potential Dead Cat Bounce (if volume remains weak) A weak bounce without strong volume may only be a temporary pullback before continuation lower.
---
Key Levels
Support (Demand Zone):
0.212 – 0.190 (major demand / yellow zone)
Resistance (Supply Levels):
0.245
0.285
0.400
0.500
0.615
0.805
---
Bullish Scenario
The bullish scenario is valid only if price reacts strongly from the demand zone.
Conditions:
Price holds above 0.190
Clear rejection or bullish candle formation
Ideally supported by increasing volume
Potential upside targets:
0.245 (minor resistance)
0.285
0.400 (major resistance)
0.500 (extension target if momentum builds)
Note:
This bullish move would be considered a technical rebound, not a full trend reversal unless a higher-low structure is established.
---
Bearish Scenario
This scenario activates if the demand zone fails.
Conditions:
Daily / 3D candle close below 0.190
Lack of meaningful buying reaction
Downside risk:
Demand breakdown → bearish continuation
Potential capitulation phase
Lower prices become likely due to the absence of strong historical support below
---
Conclusion
ENA/USDT is currently at a critical decision zone.
A strong reaction from 0.212 – 0.190 could trigger a technical rebound
A confirmed breakdown would reinforce the broader bearish trend with deeper downside risk
Patience and confirmation are key due to elevated risk conditions.
---
#ENAUSDT #ENA #CryptoAnalysis #TechnicalAnalysis
#Altcoin #Binance #Downtrend #DemandZone
#SupportResistance #PriceAction

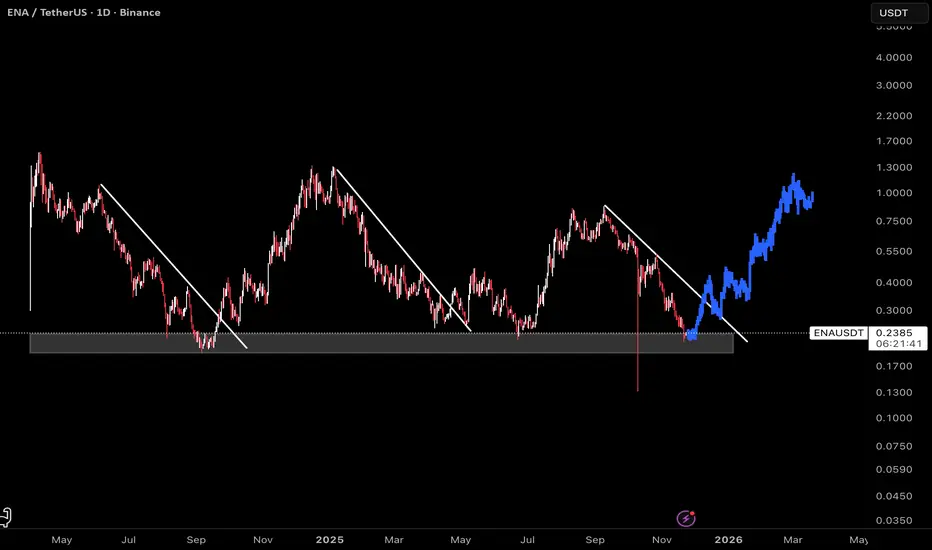
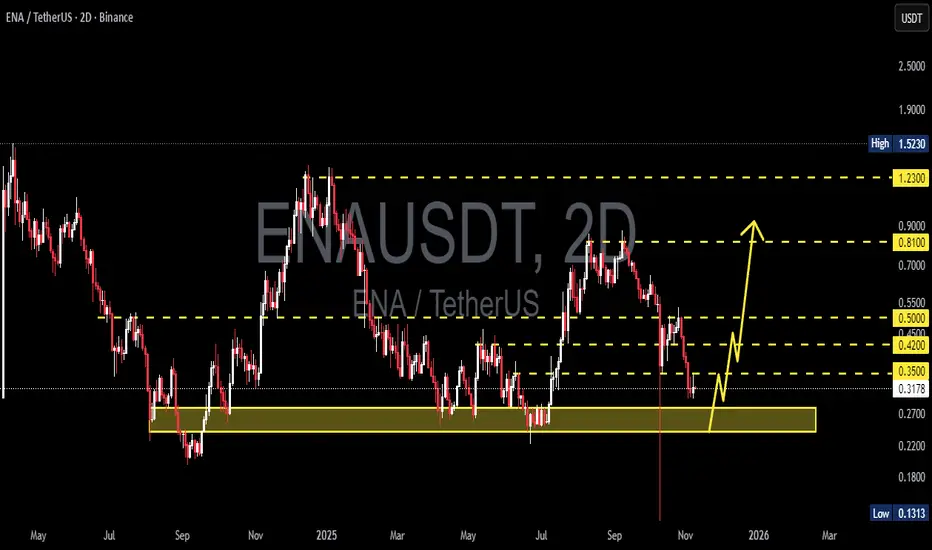
Ethena ENA price analysisIs CRYPTOCAP:ENA setting up for a trend reversal?
The OKX:ENAUSDT daily chart is repeating familiar patterns typically seen at the early stages of an uptrend. While this doesn’t guarantee continuation, the structure is worth monitoring.
Key Levels
• Downside risk: –25% to retest the previous lows
• Upside target: +200% toward the upper consolidation range
• Higher targets remain possible if momentum expands
Thesis
The current structure offers a favorable risk-to-reward ratio for mid-term traders, provided CRYPTOCAP:ENA maintains local support and CRYPTOCAP:BTC volatility doesn’t accelerate.
Question:
Do you consider this a valid accumulation zone for CRYPTOCAP:ENA , or is the market still too fragile?
______________
◆ Follow us ❤️ for daily crypto insights & updates!
🚀 Don’t miss out on important market moves
🧠 DYOR | This is not financial advice, just thinking out loud

ENA Update🚨📊 ENA Update
ENA is testing the red resistance zone 🔴.
If breakout occurs, first target = green line level 🟩🎯.

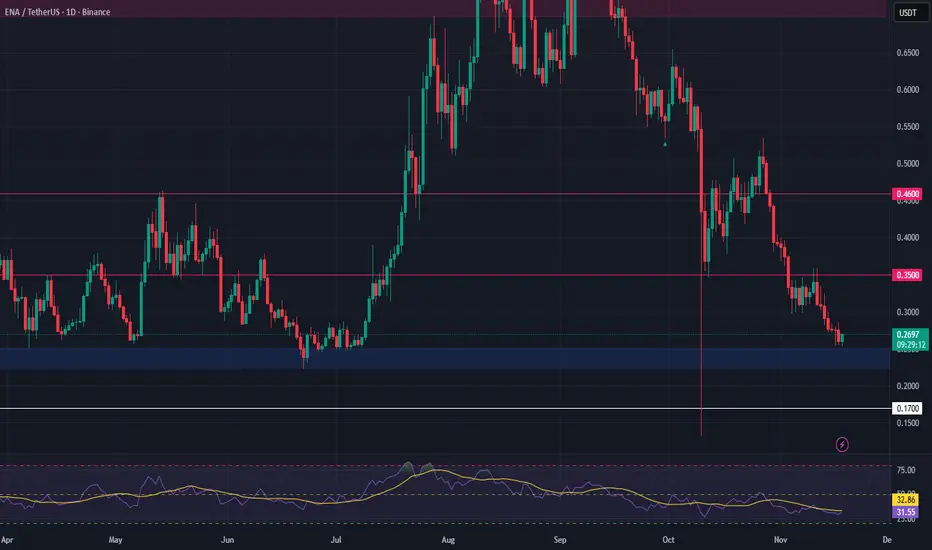
ENA Setup: Clean Support Entry – Eyes on $0.30 BreakoutENA surged 33% following our previous analysis, confirming bullish momentum. Now, price is attempting to reclaim the $0.30 resistance, a key level that could trigger the next leg up. However, failure to break and hold above this zone could lead to a retest of the recent lows, offering another potential long entry at stronger support.
The current setup offers a high-conviction entry at $0.24, which aligns with a major support area where buyers have historically stepped in. If this zone holds, we may see a trend reversal and continued upward pressure. Risk is tightly defined, making it attractive for disciplined setups.
🔹 Trade Plan:
Entry: $0.24
Take Profit Targets: $0.30 / $0.35
Stop Loss: $0.18
📌 Watching for a reaction near $0.30—break and hold above could shift momentum further bullish.

ENAUSDT Forming Falling WedgeENAUSDT is forming a clear falling wedge pattern, a classic bullish reversal signal that often indicates an upcoming breakout. The price has been consolidating within a narrowing range, suggesting that selling pressure is weakening while buyers are beginning to regain control. With consistent volume confirming accumulation at lower levels, the setup hints at a potential bullish breakout soon. The projected move could lead to an impressive gain of around 140% to 150% once the price breaks above the wedge resistance.
This falling wedge pattern is typically seen at the end of downtrends or corrective phases, and it represents a potential shift in market sentiment from bearish to bullish. Traders closely watching ENAUSDT are noting the strengthening momentum as it nears a breakout zone. The good trading volume adds confidence to this pattern, showing that market participants are positioning early in anticipation of a reversal.
Investors’ growing interest in ENAUSDT reflects rising confidence in the project’s long-term fundamentals and current technical strength. If the breakout confirms with sustained volume, this could mark the start of a fresh bullish leg. Traders might find this a valuable setup for medium-term gains, especially as the wedge pattern completes and buying momentum accelerates.
✅ Show your support by hitting the like button and
✅ Leaving a comment below! (What is your opinion about this Coin?)
Your feedback and engagement keep me inspired to share more insightful market analysis with you!

FireHoseReel : ENA : Ethena Charging Toward Daily Resistance🔥 Welcome FireHoseReel !
Let’s dive into the ENA setup and break down the key levels.
👀 ENA – 4H Timeframe Analysis
ENA is approaching its daily resistance on the 4H chart, and a confirmed breakout above this level can activate our long trigger and push price higher with momentum.
📊 Volume Analysis
ENA showed a clear volume increase during the breakout of its descending pattern (falling channel) — an early signal that a new bullish phase could be forming.
However, breaking the nearby daily resistance requires another strong wave of buy volume; without it, price may face rejection.
🔁 ENA/BTC – A Different Perspective Looking at ENA/BTC, we can see that this pair is also moving toward a key daily resistance level, just like ENA/USDT.
A breakout on the BTC pair could accelerate momentum and help ENAUSDT trigger earlier.
The structural overlap between the two charts gives strong confluence and increases confidence in our setups.
📌 Trading Scenarios
🔼 Long Scenario
• Daily resistance at 0.2814 breaks
• Buy volume increases
• Volume convergence forms after the breakout
• This activates the long trigger and may lead to higher continuation.
🔽 Short Scenario
cal support at 0.2267 breaks
• Sellers gain control and strong sell pressure appears
• This scenario can trigger a deeper sell-off.
🎯 Personal View
I personally prefer the long scenario, especially since ENA was recently listed on Hyperliquid Spot, which may boost liquidity and accelerate upward momentum.
🛞 Risk Management & Disclaimer
Please remember to always use proper risk management and position sizing. Nothing in this analysis is financial advice. The market can change quickly, so always trade based on your own strategy, research, and risk tolerance. You are fully responsible for your own trades.

#ENA/USDT : Bullish Setup#ENA
The price is moving within an ascending channel on the 1-hour timeframe and is adhering to it well. It is poised to break out strongly and retest the channel.
We have a downtrend line on the RSI indicator that is about to break and retest, which supports the upward move.
There is a key support zone in green at 0.2346, representing a strong support point.
We have a trend of consolidation above the 100-period moving average.
Entry price: 0.2409
First target: 0.2440
Second target: 0.2520
Third target: 0.2630
Don't forget a simple money management rule:
Place your stop-loss order below the green support zone.
Once you reach the first target, save some money and then change your stop-loss order to an entry order.
For any questions, please leave a comment.
Thank you.

ENAUSDT.P — One Last Dump Before Weekend Healing?Alright team, hear me out:
ENA might have one last dramatic fall before it spends the weekend reflecting on its life choices and “healing” in recovery mode. 😌✨
It’s Friday, we’ve still got a few hours of chaos left, and the market loves nothing more than a last-minute dump followed by a cute little weekend bounce.
If that happens, we could get a nice wickyyyyy on the weekly candle — the kind of wick that makes you say:
“Yep… classic crypto.”
Let’s test this theory. Worst case?
We blame Friday.
Good luck legends — protect your capital and your sanity. 📉🔥💚

ENA: Bullish SetupThis chart displays ENA on a daily timeframe, with clear structure pointing to a favorable long entry. The current price action is trading within a major support zone, where previous trendline breaks have consistently marked the start of impulsive moves.
Historically, every time ENA breaks out above the descending trendline, the asset tends to retest the breakout level before accelerating higher.
A blue fractal shows past price evolution from October last year, highlighting the repeatable bullish pattern as price reverses trend, retests the breakout, and rallies to new highs.
As always, use prudent position sizing and stop-losses, particularly if support fails to hold.
This bullish setup is most likely to play out if the FED decides to cut interest rates in December.
It could serve as a strong macro catalyst to support the pattern shown here. Thus, watch for confirmation from the Fed policy easing may power the next leg up for ENA and similar assets.
ENA/USDT Trading Analysis - SHORT PositionMarket Context
We're currently observing a well-defined bearish structure on ENA/USDT. After reaching peaks around 1.20 USDT, the pair is evolving within a descending channel characterized by lower highs and lower lows. Price has just completed a 5-wave Elliott impulse to the downside and is now forming an ABC correction that provides us with an excellent selling opportunity.
The major resistance zone sits at 0.2854 USDT, where the 20, 50, 100, and 200-period exponential moving averages converge. This technical confluence creates a strong ceiling that buyers will struggle to break through. Momentum remains weak with the RSI struggling to push above the neutral zone, confirming the exhaustion of bullish dynamics.
Trading Setup
I'm gradually entering a short position in the current zone between 0.2735 and 0.2767 USDT. This range represents an initial intermediate resistance where price is already showing rejection signs. If the market offers us a retest of the 0.2850-0.2854 zone, I'll add to my position as this is where our major resistance lies with the EMA convergence.
My stop loss is strategically placed at 0.2867 USDT, just above the critical resistance zone. This limits my risk to approximately 3.14% from the average entry point. For targets, I'm first aiming for 0.2401 USDT where significant historical support lies, then 0.2366 USDT which corresponds to our final technical projection. These levels offer us an attractive risk-reward ratio exceeding 1:2.
Key Operation Points
Entries:
Zone 1: 0.2735-0.2767 USDT ( immediate entry )
Zone 2: 0.2850-0.2854 USDT ( if retest occurs )
Exits:
Take Profit 1: 0.2401 USDT
Take Profit 2: 0.2366 USDT
Stop Loss: 0.2867 USDT
This solid technical configuration, combined with dominant bearish momentum and well-identified resistances, fully justifies this short position with excellent profit potential relative to the risk taken.

ENA: Positioning for a Reversal from All-Time Low SupportWe're looking for ENA to successfully hold the critical all-time low support zone and show confirmation of a bounce before potentially reversing its short-term downtrend back to the upside. This setup provides an opportunity to position for a long spot trade, capitalizing on the oversold RSI and the proximity to major historical lows.
Trade Setup: Capturing the Bounce
Entry Zone: $0.22 – $0.25 (Entering at the current price level, which is the established major support zone).
Take Profit Targets:
🥇 $0.35 (Targeting the first key structural resistance/previous local swing high).
🥈 $0.46 (Targeting the next major psychological and structural resistance level).
Stop Loss: $0.17 (Placing the stop loss below the critical support level to manage risk in case of a breakdown).
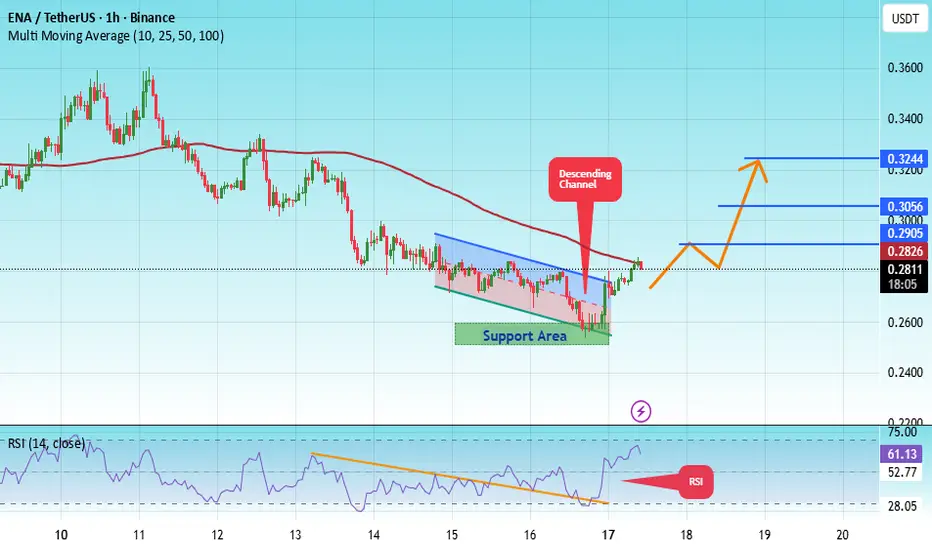
#ENA/USDT setting up for its next leg higher.#ENA
The price is moving within an ascending channel on the 1-hour timeframe and is adhering to it well. It is poised to break out strongly and retest the channel.
We have a downtrend line on the RSI indicator that is about to break and retest, which supports the upward move.
There is a key support zone in green at 0.2550, representing a strong support point.
We have a trend of consolidation above the 100-period moving average.
Entry price: 0.2800
First target: 0.2900
Second target: 0.3056
Third target: 0.3244
Don't forget a simple money management rule:
Place your stop-loss order below the green support zone.
Once you reach the first target, save some money and then change your stop-loss order to an entry order.
For any questions, please leave a comment.
Thank you.
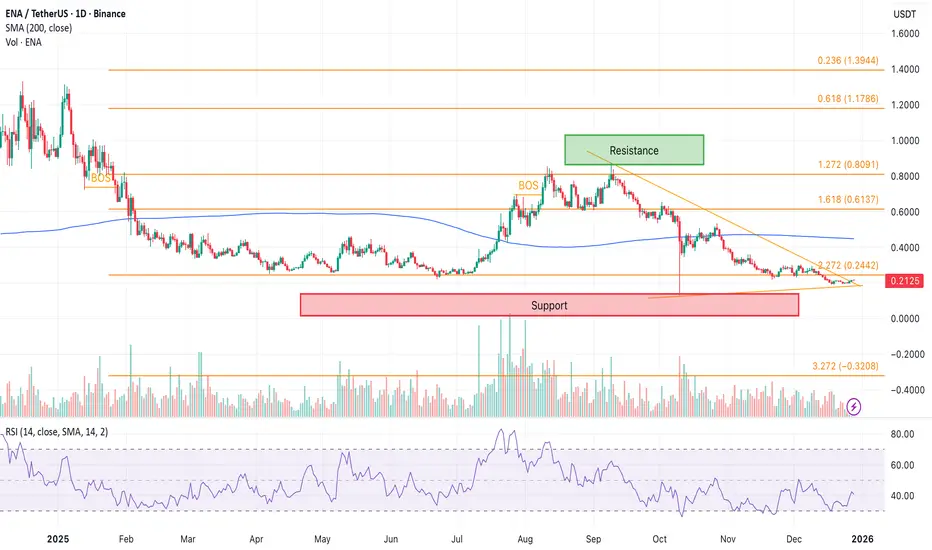
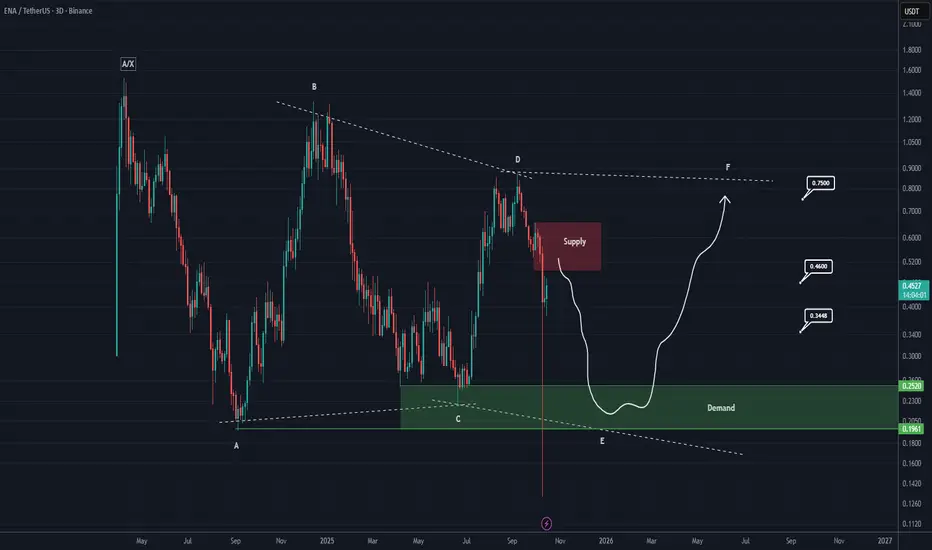
ENA Analysis (3D)It seems that ENA is forming a corrective diametric pattern, where wave E can extend from the red zone to the green zone. This means the price may experience a time–price correction lasting for several months.
The targets for the next bullish wave are marked on the chart. These targets will take time to be reached.
This is the overall outlook for ENA on the higher timeframes.
For risk management, please don't forget stop loss and capital management
When we reach the first target, save some profit and then change the stop to entry
Comment if you have any questions
Thank You
ENA/USDT – Ready for a Strong Rebound or a Deeper Fall?ENA is currently at one of its most critical moments. After a prolonged distribution phase and a consistent bearish trend from the highs around 0.80–1.20, the price has now returned to the strong historical demand zone at 0.28–0.24 — an area that previously served as the foundation for a major bullish rally.
This zone represents the “last fortress” of buyers. If it holds and forms a clear reversal pattern, ENA has a strong chance to stage a significant rebound. However, if it breaks down, the bearish continuation could accelerate sharply toward the 0.18–0.13 psychological support levels.
---
Structure & Pattern Analysis
Main trend: still bearish, but price is approaching a potential bottoming phase.
Current structure: likely forming an accumulation base around the demand zone — similar to a double-bottom or a descending structure losing momentum.
Key confirmation: a 2D candle close above 0.35 would be the first solid sign of buyer strength and a potential early reversal.
If this demand zone triggers a bounce like before, ENA could enter a mini bullish cycle targeting the 0.42–0.50 resistance range.
---
Bullish Scenario (Reversal Setup)
If the 0.28–0.24 zone successfully acts as support again:
1. Reversal signs: a strong bullish engulfing or pin bar on the 2D timeframe showing renewed buying pressure.
2. Upside targets:
0.35 → first confirmation level.
0.42–0.50 → mid-term profit-taking zone.
0.81 → extended target if bullish momentum continues.
3. Extra confirmation: rising volume and bullish RSI divergence would validate the strength of the rebound.
Under this setup, ENA could deliver a 30–80% recovery swing in the medium term.
---
Bearish Scenario (Breakdown Setup)
However, if sellers continue to dominate and price closes below 0.24 on the 2D timeframe, then:
1. Demand zone failure would signal a transition from accumulation to a new markdown phase.
2. Next downside targets:
Minor support near 0.20
Major support at 0.13 (historical low).
3. Bearish confirmation: high-volume breakdown followed by a failed retest around 0.28 would confirm continuation of the downtrend.
This could trigger a capitulation phase before a new bottom forms.
---
Trading Opportunities & Strategy
Aggressive traders: may look for early entries around 0.28–0.24 with tight risk management (stop below 0.22). Initial targets: 0.35–0.42.
Conservative traders: wait for a confirmed breakout and 2D close above 0.35 before entering for a safer reversal play.
Swing traders: best entry after a successful retest of 0.28–0.35 with strong volume and bullish confirmation.
---
Conclusion
ENA is standing at a make-or-break level that will define its medium-term direction.
If 0.28–0.24 holds, a strong rebound is likely to unfold.
If it breaks, the bearish trend could extend toward 0.18–0.13.
This is the “decision phase” for ENA — whether it’s preparing a reaccumulation structure for a new bullish leg or continuing into a deeper bearish spiral.
---
#ENA #ENAUSDT #CryptoAnalysis #TechnicalAnalysis #PriceAction #DemandZone #SupportAndResistance #SwingTrade #MarketStructure #CryptoTA #ReversalZone
ENA - bearish MIL:ENA - price analysis: 🔴
The chart is Following the global market sentiment: Bearish 📉
Bulls are literally absent at the moment.
Another bearish candle closed on the daily basis, under 0.3600$ 🚨
Rejection also on POC point daily 📉🔴
Zooming on the daily view, price could continue to dump & stabilize on lower demand zone:
🎯0.3100 - 0.300$ (weak level)
🎯0.2600 - 0.2500
🎯0.200 - 0.2050$
Even if it's a solid project, following general market trend often give view the right direction and best entries.
Long term outlook:
Prices is traded under many key levels Weekly / Monthly.
0.400 - 0.4550 - 0.500$ 🔴
Weekly candle close with volume above 0.400$ is required for potential bull reversal!
#ENA #trading

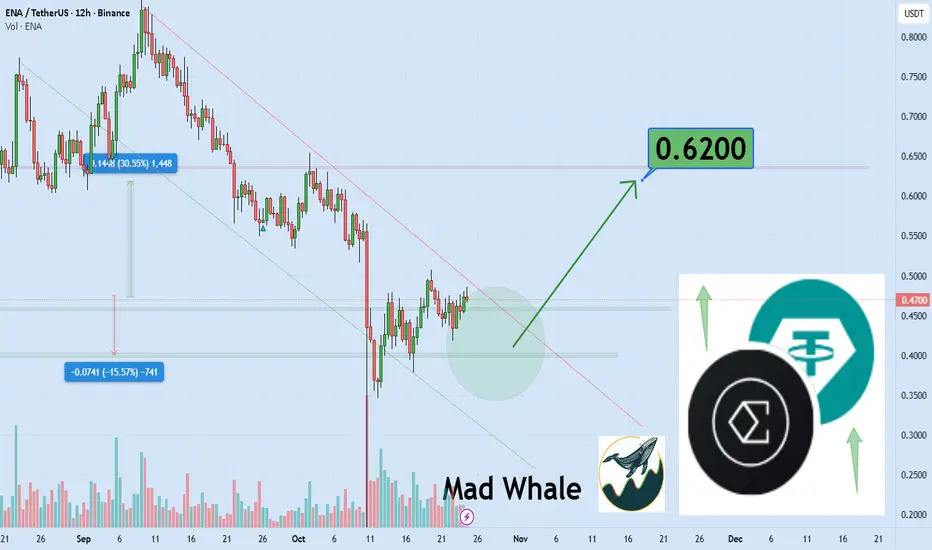
Ena to the moon at least 30% gain to 0.62$Hi
the support and resistances on the chart are based on the previous data and weekly candlesticks if BINANCE:ENAUSDT holds this last support the potential of 30% gain is logical toward 0.62$
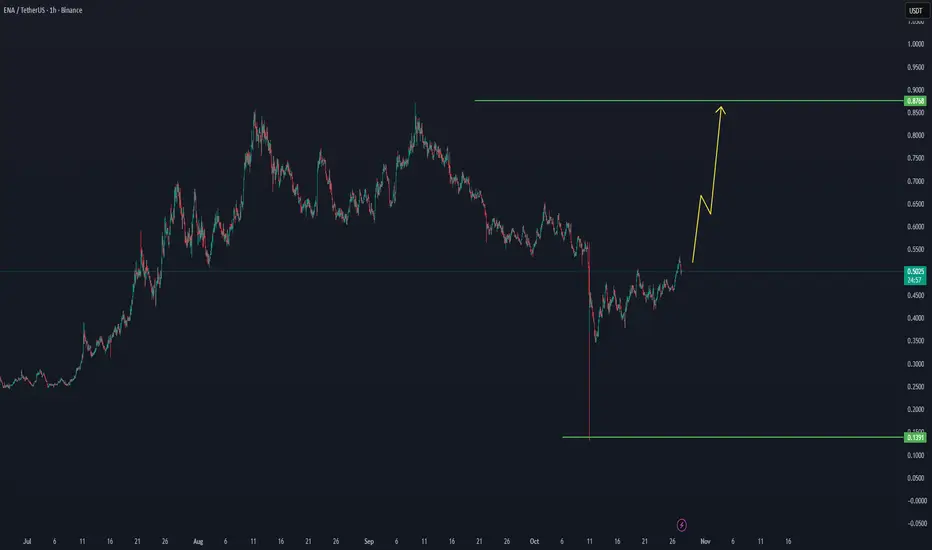
ENA/USDT — Recovery Setup Toward $0.87 in ProgressNA/USDT — Recovery Setup Toward $0.87 in Progress 🚀
ENA has shown a strong rebound from its major support zone, confirming a short-term bottom formation after the recent deep correction.
Price structure now indicates a shift from accumulation to expansion, with early signs of buyer momentum building up on the lower timeframes.
🔍 Technical Outlook:
Support Zone: $0.13 – $0.15 (strong base level)
Current Price: ~$0.50
Resistance / Target: $0.87
Pattern: Early stage of a potential impulse wave recovery
Volume: Gradually increasing, signaling renewed interest
📈 Scenario Expectation:
If ENA continues holding above the $0.45–$0.50 range, the next move could extend toward $0.65, followed by a possible breakout to $0.87, aligning with the previous major resistance zone.
A break above $0.87 would confirm a full trend reversal and open the path toward new cycle highs.
⚠️ Risk Zone:
Failure to hold above $0.45 may trigger a retest of the lower accumulation area around $0.30–$0.35 before another potential leg up.
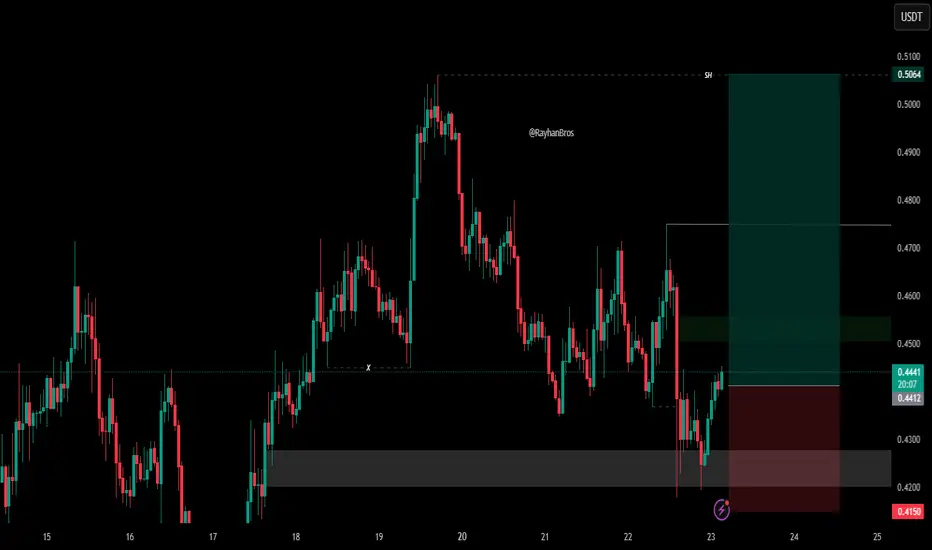
$ENA setting up for its next leg higher.Currently sitting in a high-conviction demand zone, making it an ideal spot for early buyers to position before momentum ignites.
🟢 Entry Zone: $0.4430 – $0.4400
🎯 Target 1 — $0.4530
🎯 Target 2 — $0.4630
🎯 Target 3 — $0.4750
🎯 Target 4 -- $0.500$
🔴 Stop Loss: $0.4180
⚡Momentum building… Smart money is quietly accumulating before the next explosive move!
📌 Use low leverage with Sl...Do proper money management... DYOR BINANCE:ENAUSDT.P
Going down Short #ENAUSDTGoing short on ENA/USDT as bearish momentum gains strength! 📉 Technical indicators signal a downward trend with resistance levels holding strong. Sellers are in control, and volatility is high—watch for potential breakout levels. Keep stop-loss tight and stay alert for trend reversals. 🚨

$ENA – Holding Strong or Losing Steam?$ENASUDT | 2D
Ethena, one of the standout performers lately, is currently trading around $0.4586 after a solid defense of the $0.35 support zone.
Buyers stepped in aggressively on the dip, showing clear signs of renewed demand.
If momentum holds, ENA could make a move to retest the $0.54–$0.60 zone. For now, I’m expecting price action to range between $0.30 and $0.60 before eventually filling its liquidation wick.

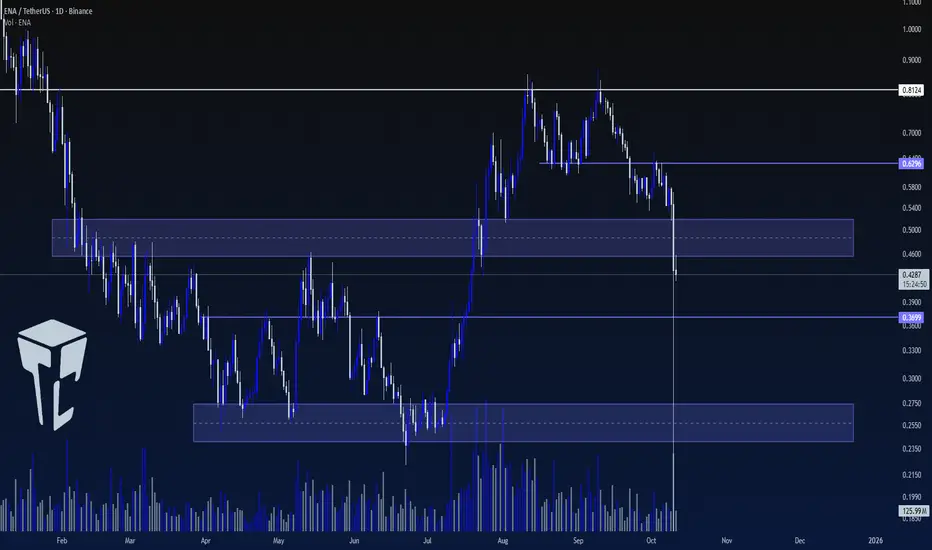
TradeCityPro | ENA: Market Shake-Off and Support Rebuild Zone👋 Welcome to TradeCity Pro!
In this analysis, I’ll review ENA, one of the DeFi projects that currently holds a market cap of $3.02 billion, ranking 36th on CoinMarketCap.
📅 Daily Timeframe
First, let’s take a look at the market as a whole — yesterday, some extremely unusual events occurred, which I’ll explain in detail in Bitcoin’s analysis.
✨ For now, the result of these events has been a sharp market decline, which has also affected this coin. ENA has now stabilized below the $0.5 support zone and printed a very long shadow to much lower levels.
🔍 Currently, the price is far below its last major high at $0.8124 and has formed a lower high at $0.6296.
✔️ There was a support zone around $0.5, but since the price has closed below it, the next key support lies at $0.3699.
📊 The final strong support zone is around $0.25, which is considered ENA’s main support level.
💥 For now, it’s better to stay on the sidelines and wait for the market to build a new structure. The recent move was highly emotional and volatile, making it difficult to accurately interpret the market’s behavior at the moment.
📝 Final Thoughts
Stay calm, trade wisely, and let's capture the market's best opportunities!
This analysis reflects our opinions and is not financial advice.
Share your thoughts in the comments, and don’t forget to share this analysis with your friends! ❤️