#ENA/USDT setting up for its next leg higher.#ENA
The price is moving within a descending channel on the hourly timeframe. It has reached the lower boundary and is heading towards a breakout, with a retest of the upper boundary expected.
The Relative Strength Index (RSI) is showing a downward trend, approaching the lower boundary, and an upward bounce is anticipated.
There is a key support zone in green at 0.1070. The price has bounced from this level several times and is expected to bounce again.
The RSI is showing a trend towards consolidation above the 100-period moving average, which we are approaching, supporting the upward move.
Entry Price: 0.1168
Target 1: 0.1200
Target 2: 0.1260
Target 3: 0.1325
Stop Loss: Below the green support zone.
Remember this simple thing: Money management.
For any questions, please leave a comment.
Thank you.
Enausdtlong

#ENA/USDT setting up for its next leg higher.#ENA
The price is moving within a descending channel on the hourly timeframe. It has reached the lower boundary and is heading towards a breakout, with a retest of the upper boundary expected.
The Relative Strength Index (RSI) is showing a downward trend, approaching the lower boundary, and an upward bounce is anticipated.
There is a key support zone in green at 0.2130. The price has bounced from this level several times and is expected to bounce again.
The RSI is showing a trend towards consolidation above the 100-period moving average, which we are approaching, supporting the upward move.
Entry Price: 0.2172
Target 1: 0.2200
Target 2: 0.2254
Target 3: 0.2322
Stop Loss: Below the green support zone.
Remember this simple thing: Money management.
For any questions, please leave a comment.
Thank you.

ENAUSDT at Critical Trendline — Breakdown or Reversal Ahead?ENA/USDT on the Daily (1D) timeframe remains in a primary bearish phase since topping near the 0.87 area. Market structure continues to print lower highs and lower lows, confirming strong seller dominance. Price is currently attempting a bullish pullback and is testing a descending trendline resistance.
---
Pattern Explanation
The dominant pattern visible is a Descending Trendline (Bearish Continuation Structure).
Pattern characteristics:
A descending trendline connecting lower highs since September.
Multiple price rejections from this trendline.
The current pullback remains below dynamic resistance, with no confirmed breakout.
This pattern typically indicates:
As long as the trendline holds, bearish control remains intact.
Rejection from the trendline often leads to further downside continuation.
---
Key Levels
Resistance Levels:
0.2575 → current rejection zone (trendline + minor resistance)
0.3000
0.3400
0.5100 (major resistance)
0.6100 – 0.8150 (upper supply zone)
Support Levels:
0.2328 → nearest support
0.2000 → psychological support
0.1750 → last demand zone (high-risk area)
---
Bullish Scenario
The bullish scenario becomes valid only after a confirmed breakout.
Bullish confirmation:
Daily close above the descending trendline
Increased volume during breakout
Successful retest of the trendline as support
Upside targets:
0.3000
0.3400
0.5100
Bullish conclusion: If ENA manages to break and hold above the trendline, bearish pressure weakens and a medium-term trend reversal becomes possible.
---
Bearish Scenario
The bearish scenario remains the primary outlook.
Bearish confirmation:
Strong rejection at the descending trendline
Failure to close above 0.2575
Formation of bearish continuation candles
Downside targets:
0.2328
0.2000
0.1750
Bearish conclusion: As long as price remains below the descending trendline, any upward move is likely just a pullback before further downside.
---
Conclusion
ENAUSDT remains in a strong bearish structure. The descending trendline is a key decision zone. Traders should wait for:
A clear breakout for bullish confirmation, or
A strong rejection for bearish continuation
Patience and confirmation are crucial as the market remains in a distribution phase.
---
#ENAUSDT #ENA #CryptoAnalysis #BearishTrend #DescendingTrendline #AltcoinAnalysis
#SupportResistance #PriceAction #DailyChart
#CryptoTrading #TechnicalAnalysis

ENA/USDT at a Critical Demand Zone – Bounce or Breakdown Ahead?ENA/USDT is currently in a strong bearish phase on the 3D timeframe. After failing to hold the distribution area above 0.80, price experienced a sharp and sustained decline, returning to a highly significant historical demand zone. The yellow zone at 0.212 – 0.190 is a critical area that will determine the next major move.
---
Market Structure & Price Action
Overall structure remains Lower High – Lower Low (bearish trend)
Strong breakdown from the 0.40 → 0.28 area confirms bearish continuation
Price is now testing a major multi-month demand zone
Market reaction here will define whether we see a technical rebound or further breakdown
---
Pattern Explanation
1. Descending Market Structure (Bearish Continuation)
Price has formed consistent lower highs since the 0.80 peak, showing dominant selling pressure.
2. Strong Demand Retest The 0.212 – 0.190 zone represents:
Previous accumulation area
Historical strong bounce level
Last major demand before potential deeper price discovery
3. Potential Dead Cat Bounce (if volume remains weak) A weak bounce without strong volume may only be a temporary pullback before continuation lower.
---
Key Levels
Support (Demand Zone):
0.212 – 0.190 (major demand / yellow zone)
Resistance (Supply Levels):
0.245
0.285
0.400
0.500
0.615
0.805
---
Bullish Scenario
The bullish scenario is valid only if price reacts strongly from the demand zone.
Conditions:
Price holds above 0.190
Clear rejection or bullish candle formation
Ideally supported by increasing volume
Potential upside targets:
0.245 (minor resistance)
0.285
0.400 (major resistance)
0.500 (extension target if momentum builds)
Note:
This bullish move would be considered a technical rebound, not a full trend reversal unless a higher-low structure is established.
---
Bearish Scenario
This scenario activates if the demand zone fails.
Conditions:
Daily / 3D candle close below 0.190
Lack of meaningful buying reaction
Downside risk:
Demand breakdown → bearish continuation
Potential capitulation phase
Lower prices become likely due to the absence of strong historical support below
---
Conclusion
ENA/USDT is currently at a critical decision zone.
A strong reaction from 0.212 – 0.190 could trigger a technical rebound
A confirmed breakdown would reinforce the broader bearish trend with deeper downside risk
Patience and confirmation are key due to elevated risk conditions.
---
#ENAUSDT #ENA #CryptoAnalysis #TechnicalAnalysis
#Altcoin #Binance #Downtrend #DemandZone
#SupportResistance #PriceAction

$ENA/USDT ANALYSISOn the 3-day chart, ENA/USDT is trading inside a long-term demand zone where price has reacted multiple times in the past, showing that buyers have stepped in here before. The market has been in a downtrend for several months and is still moving under a descending trendline, showing weak momentum overall, but it is also holding above the same support area that previously triggered a strong bounce. Candles are small and volume looks low, which shows indecision, and the price is moving sideways near the bottom of the range instead of breaking down or starting a strong move yet. Until a clear move happens, the chart is showing consolidation near support after a long decline, meaning the market is in a waiting phase where buyers and sellers are trying to take control.

#ENA/USDT : Bullish Setup#ENA
The price is moving within an ascending channel on the 1-hour timeframe and is adhering to it well. It is poised to break out strongly and retest the channel.
We have a downtrend line on the RSI indicator that is about to break and retest, which supports the upward move.
There is a key support zone in green at 0.2346, representing a strong support point.
We have a trend of consolidation above the 100-period moving average.
Entry price: 0.2409
First target: 0.2440
Second target: 0.2520
Third target: 0.2630
Don't forget a simple money management rule:
Place your stop-loss order below the green support zone.
Once you reach the first target, save some money and then change your stop-loss order to an entry order.
For any questions, please leave a comment.
Thank you.

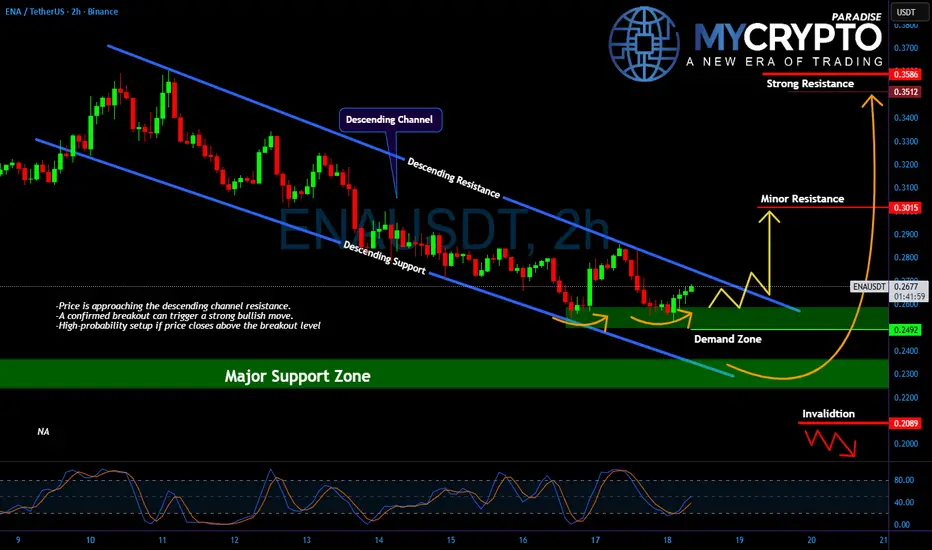
ENA About to Explode? Yello Paradisers, is ENA quietly building up pressure for a major breakout while everyone else is hypnotized by Bitcoin’s sideways snoozefest?
💎While the crypto herd remains laser-focused on BTCUSDT, #ENAUSDT is showing signs of life and potentially setting up a stealth move that could catch most traders completely off guard.
💎Price action has been respecting a clean descending channel, with repeated rejections at the upper resistance and strong bounces off the lower boundary. #ENA has now bounced from a well-defined demand zone between $0.2300 and $0.2492 for the third time. This double bottom structure is a powerful reversal signal, especially if a confirmed breakout follows it.
💎The descending channel resistance is being tested again. If #ENA closes a strong candle above $0.2700–$0.2750, this would confirm the breakout technically. Once that level is broken and successfully retested, a move toward $0.3015 is very likely.
💎The next serious resistance sits between $0.3512 and $0.3586, a target zone where we expect aggressive profit-taking. From current prices, this represents a potential 30%+ move that most traders still focused on #BTCUSDT will completely miss.
That said, if ENA fails to break above the resistance and drops below $0.2089, the bullish setup would be invalidated. Until that happens, the bullish thesis remains fully intact.
MyCryptoParadise
iFeel the success🌴
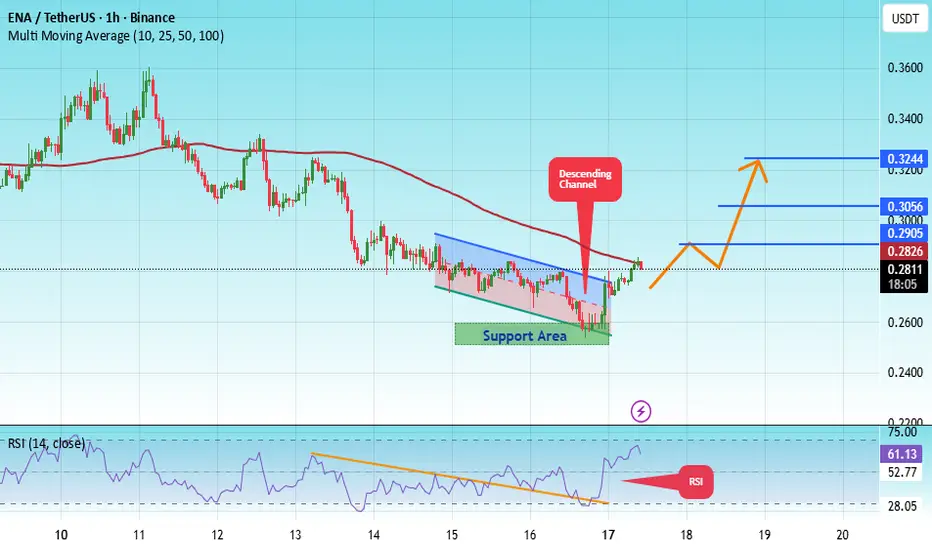
#ENA/USDT setting up for its next leg higher.#ENA
The price is moving within an ascending channel on the 1-hour timeframe and is adhering to it well. It is poised to break out strongly and retest the channel.
We have a downtrend line on the RSI indicator that is about to break and retest, which supports the upward move.
There is a key support zone in green at 0.2550, representing a strong support point.
We have a trend of consolidation above the 100-period moving average.
Entry price: 0.2800
First target: 0.2900
Second target: 0.3056
Third target: 0.3244
Don't forget a simple money management rule:
Place your stop-loss order below the green support zone.
Once you reach the first target, save some money and then change your stop-loss order to an entry order.
For any questions, please leave a comment.
Thank you.
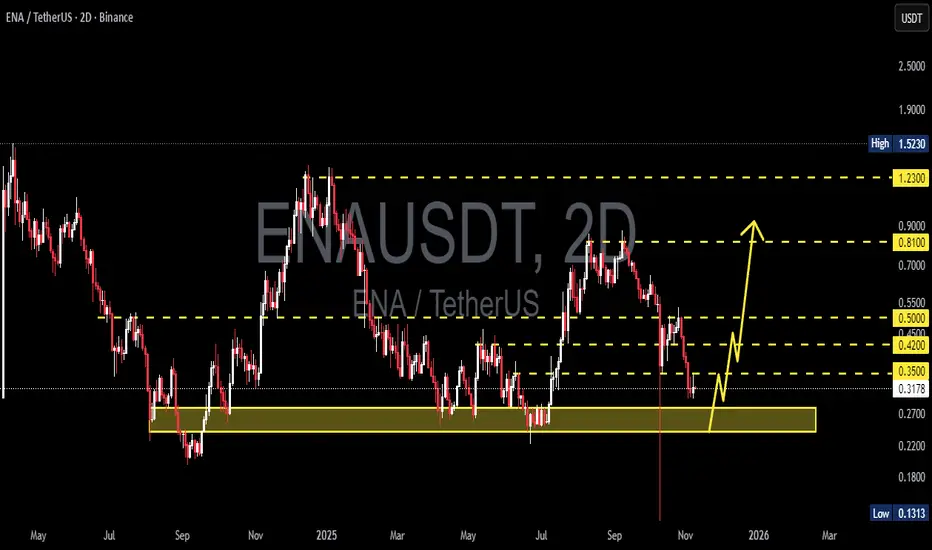
ENA/USDT – Ready for a Strong Rebound or a Deeper Fall?ENA is currently at one of its most critical moments. After a prolonged distribution phase and a consistent bearish trend from the highs around 0.80–1.20, the price has now returned to the strong historical demand zone at 0.28–0.24 — an area that previously served as the foundation for a major bullish rally.
This zone represents the “last fortress” of buyers. If it holds and forms a clear reversal pattern, ENA has a strong chance to stage a significant rebound. However, if it breaks down, the bearish continuation could accelerate sharply toward the 0.18–0.13 psychological support levels.
---
Structure & Pattern Analysis
Main trend: still bearish, but price is approaching a potential bottoming phase.
Current structure: likely forming an accumulation base around the demand zone — similar to a double-bottom or a descending structure losing momentum.
Key confirmation: a 2D candle close above 0.35 would be the first solid sign of buyer strength and a potential early reversal.
If this demand zone triggers a bounce like before, ENA could enter a mini bullish cycle targeting the 0.42–0.50 resistance range.
---
Bullish Scenario (Reversal Setup)
If the 0.28–0.24 zone successfully acts as support again:
1. Reversal signs: a strong bullish engulfing or pin bar on the 2D timeframe showing renewed buying pressure.
2. Upside targets:
0.35 → first confirmation level.
0.42–0.50 → mid-term profit-taking zone.
0.81 → extended target if bullish momentum continues.
3. Extra confirmation: rising volume and bullish RSI divergence would validate the strength of the rebound.
Under this setup, ENA could deliver a 30–80% recovery swing in the medium term.
---
Bearish Scenario (Breakdown Setup)
However, if sellers continue to dominate and price closes below 0.24 on the 2D timeframe, then:
1. Demand zone failure would signal a transition from accumulation to a new markdown phase.
2. Next downside targets:
Minor support near 0.20
Major support at 0.13 (historical low).
3. Bearish confirmation: high-volume breakdown followed by a failed retest around 0.28 would confirm continuation of the downtrend.
This could trigger a capitulation phase before a new bottom forms.
---
Trading Opportunities & Strategy
Aggressive traders: may look for early entries around 0.28–0.24 with tight risk management (stop below 0.22). Initial targets: 0.35–0.42.
Conservative traders: wait for a confirmed breakout and 2D close above 0.35 before entering for a safer reversal play.
Swing traders: best entry after a successful retest of 0.28–0.35 with strong volume and bullish confirmation.
---
Conclusion
ENA is standing at a make-or-break level that will define its medium-term direction.
If 0.28–0.24 holds, a strong rebound is likely to unfold.
If it breaks, the bearish trend could extend toward 0.18–0.13.
This is the “decision phase” for ENA — whether it’s preparing a reaccumulation structure for a new bullish leg or continuing into a deeper bearish spiral.
---
#ENA #ENAUSDT #CryptoAnalysis #TechnicalAnalysis #PriceAction #DemandZone #SupportAndResistance #SwingTrade #MarketStructure #CryptoTA #ReversalZone
BUY AND HOLDHello friends
Given the potential and good support that this currency has and the power of buyers, now that the price has corrected, you can buy in stages with capital and risk management and move with it to the specified goals.
Note that the holding period is at least 3 months, so be patient and observe capital management.
*Trade safely with us*

ENA Swing Setup + Investment IdeaEna showed some Great Strength, we took it from 0.30 and sold at 0.66 n 0.80. Now wait for the Monthly + Weekly level to reach n show some reaction, and then Buy. for spot traders keep buying from 0.55 , 0.45 , 0.40 and wait for the Uptober Bull Run specially for alts. Will update the trade, if ena doesn't reach to those levels.

#ENA/USDT - BEARISH CORRECTION AWAITED?#ENA
The price is moving within a descending channel on the 1-hour frame, adhering well to it, and is heading for a strong breakout and retest.
We have a bearish trend on the RSI indicator that is about to be broken and retested, which supports the upward breakout.
There is a major support area in green at 6900, which represents a strong support point.
We are heading for consolidation above the 100 moving average.
Entry price: 0.7040
First target: 0.7070
Second target: 0.7150
Third target: 0.7300
Don't forget a simple matter: capital management.
When you reach the first target, save some money and then change your stop-loss order to an entry order.
For inquiries, please leave a comment.
Thank you.

ENA ; SIGNALHello friends
Given the good growth we had, now the price can move to the set targets if it is fixed in the specified support areas.
*Trade safely with us*

ENA Bullish Flag Breakout – Next Leg Up?ENA has shown impressive strength, rallying over 235% from the bottom. After this strong move, price consolidated into a bullish flag formation, a continuation pattern often seen before the next leg up.
On the daily chart, a breakout has been confirmed, with price now preparing for further upside. Both the 100 and 200 EMA are acting as strong support at the bottom of the flag, while price is also holding above the volume support zone, adding confluence to the bullish setup.
If momentum continues, ENA has the potential to extend this breakout toward higher targets in the coming weeks. Proper risk management remains key, but the technical structure suggests the bulls are in control.
Cheers
Hexa

ENAUSDT UPDATE#ENA
UPDATE
ENA Technical Setup
Pattern : Falling Wedge Pattern
Current Price: $0.6759
Target Price: $1.11
Target % Gain: 65.62%
Technical Analysis: ENA is consolidating inside a falling wedge on the 1D chart. Price is holding near support and showing signs of breakout potential, with upside momentum likely to push toward $1.11 if confirmed by volume.
Time Frame: 1D
Risk Management Tip: Always use proper risk management.

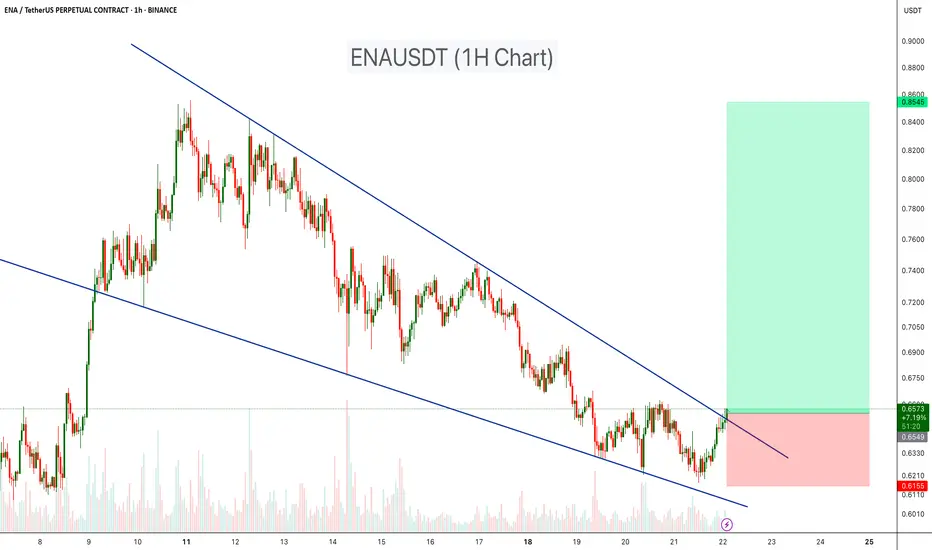
ENAUSDT – Falling Wedge Breakout in PlayENAUSDT on the 1H chart is forming a falling wedge pattern, which is typically a bullish reversal signal. After a consistent downtrend, the price is now testing the upper wedge resistance.
A breakout above this level could confirm bullish momentum, with potential upside toward the 0.85 USDT target zone.
Resistance 1:0.72
Resistance 2:0.79
Resistance 3:0.85
Stop loss: $0.615
Cheers
Hexa
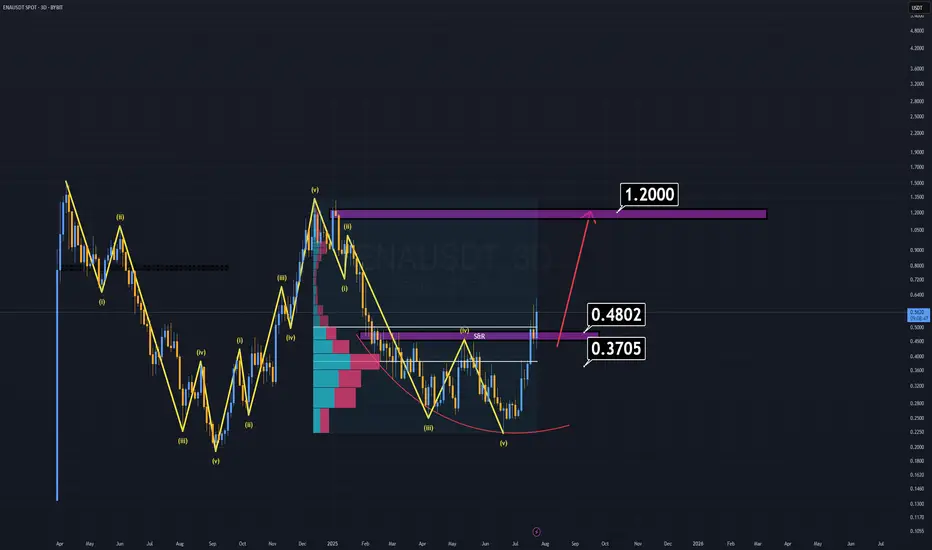
ENA Analysis (3D)ENA has been outperforming many altcoins for weeks, yet it still appears undervalued based on its fundamentals and recent investor interest.
Where to buy?
Right now, buying at current levels is extremely risky, as the ideal buy-back zones are significantly below the market price.
First major support: $0.48 — considered a "cheap" entry.
Dream entry (low probability): $0.37–$0.38 — at that point, ENA would feel almost free.
Notably, BlackRock and its partners are actively investing in ENA, which speaks volumes about its long-term credibility. That alone justifies keeping it on your radar.
Minimum target: $1.00–$1.20
Remember, that’s just the beginning. We may see even more once momentum kicks in.
Sometimes, the best trade is the one you're waiting for.
Good luck.
ENA/USDT Breakout Watch Signs of Reversal from a Key Demand Zone🔍 Full Technical Analysis:
ENA/USDT has been forming a Descending Triangle pattern since the December 2024 high — a structure often seen in continuation moves, but here it may act as a potential reversal pattern, especially since price is consolidating around a strong historical demand zone.
The price is hovering within a key support area between $0.1940–$0.2624, which has repeatedly held against bearish pressure. Recent candles are showing signs of accumulation, indicating possible base formation before a breakout.
✅ Bullish Scenario (Breakout Setup):
If the price successfully:
1. Breaks above the descending trendline (yellow line), and
2. Confirms with a breakout above the $0.28–$0.30 zone with strong volume,
We could see a powerful bullish reversal with the following upside targets:
📈 Target 1: $0.3720
📈 Target 2: $0.4569 – breakout structure confirmation
📈 Target 3: $0.6540 – prior resistance zone
📈 Target 4: $0.7702
📈 Target 5: $0.8928
💥 Extended Targets: $1.2512 – $1.3300 (Major High from December 2024)
🚨 A clean breakout from this setup may trigger major FOMO and offer multi-level swing trading opportunities.
❌ Bearish Scenario (Breakdown Risk):
If the downtrend continues and:
The price fails to break above the trendline, and
Breaks below $0.1940, which is the historical low support,
Then the door opens for further downside towards: 🔻 Bearish Target: $0.1600 or lower
⚠️ A confirmed breakdown below this key zone would suggest trend continuation and weakness in buyer interest.
🧠 Strategic Summary:
Strong Demand Zone + Historical Support suggest high probability of trend reversal.
Descending Triangle offers a textbook breakout opportunity with favorable risk-reward.
High RR potential makes this setup ideal for swing traders and mid-term investors.
💡 Success tip: Wait for breakout confirmation and volume spike before entering.
#ENAUSDT #CryptoBreakout #DescendingTriangle #BullishReversal #AltcoinSetup #CryptoTrading #SwingTrade #TechnicalAnalysis #ChartPatterns #SupportAndResistance

ENA Long / Buy Swing SetupENA Looking Good here, daily closing above 1st tp guaranteed tp 2. Ena can be the next SUI, Ondo. Below 0.31$ buying is a good choice and hold till 1st and then 2nd tp. While for the long term investors it has the potential to hit 2-3$ mark.

ENAUSDT Long / Buy SetupOn lower tf ena showing bullish momentum, while previous setups went bad due to war, but ena still holding the previous marked area, this is a short term setup not long term, still expecting another low for whole market. Will share swing setups if found strong momentum. Must use SL as btc as it's peak.

ENA SCALP & Intraday Setup Both Long & Short SetupWait for the entries to be filled first. If short entry achieved first then go for the short, if long entry achieved first then go for the long, in both cases must use SL, cause it's consolidating in a range, any side impulse move is expected from ena.

ENAUSDT 1D Analysis ENA ~ 1D Analysis
#ENA Buy back gradually from here if you still have confidence in this coin with a short term target of at least 15%+ from here.

ENA About to Explode or Dump? Key Levels You Can’t Ignore!Yello Paradisers — are you positioned right for the next potential explosion in #ENA, or will you get caught on the wrong side of the move like most retail traders? After a brutal grind in a descending channel, something big is brewing... and it’s coming faster than many realize. Let's dive in.
💎#ENAUSDT currently facing a key resistance at the upper boundary of the descending channel, clearly tested multiple times and respected well by the market structure. A candle close above this channel would trigger a confirmed breakout, which opens up a clean path for continued upside movement — the next major target sits at the resistance zone between 0.446 and 0.4725.
💎There’s a high-probability alternative setup unfolding as well: ENA holding the S/R level around 0.3448 and the demand zone below, which aligns perfectly with the multi-timeframe EMA support. If this area holds strong, expect another impulse move toward our resistance zone as momentum builds.
💎Price had been forming lower highs and lower lows, respecting the downtrend But recently we observed a Clear Change of Character (ChoCH) — ENA broke market structure by forming a higher high.What usually follows? A higher low, and that’s where we are now.
💎The most probable scenario is for price to pull back to the S/R level or dip into the demand zone, and then form a higher low before making the next leg upward toward resistance.
💎Invalidation is simple and must be respected: if we see a confirmed candle close below 0.2798, then the bullish case breaks and the setup is no longer valid. This is where you must cut quickly, avoid hope-trading, and reassess the structure from scratch.
Don’t chase. Don’t panic. React with strategy, not emotion. This is how real professionals win in crypto. Stay sharp, Paradisers.
MyCryptoParadise
iFeel the success🌴
