ENSUSDT — Massive Bounce or Final Breakdown?After months of wide consolidation, Ethereum Name Service (ENS) is once again testing one of its most critical structures — the golden confluence zone between 16.5–14.0 USDT, which has served as a major battleground between buyers and sellers since 2022.
This isn’t just a price range:
It’s where ENS repeatedly formed higher lows and launched new rallies.
It’s also aligned perfectly with the multi-month ascending trendline, creating a high-value technical confluence.
The market is holding its breath — waiting for a decisive move.
---
Technical Structure & Pattern
Ascending Trendline: still intact since 2023, providing medium-term bullish structure.
Horizontal Support 16.5–14.0: long-term demand zone with multiple reactions in the past; a true make-or-break level.
Compression Phase: price is coiling tighter against support — signaling a potential volatility expansion soon.
---
📈 Bullish Scenario
If ENS manages to close above 16.5 on the weekly timeframe with a strong bullish candle (such as a pinbar or bullish engulfing), a rebound could unfold toward:
Initial targets: 19.8 → 23.6 USDT
Extended targets: 30.4 → 37.0 USDT
This golden zone could act as a launchpad for the next major bullish leg. Long-term buyers may see this as a high-reward accumulation opportunity with limited downside risk.
---
📉 Bearish Scenario
However, a weekly close below 14.0 would confirm a structural breakdown, potentially triggering a deeper move toward:
Next supports: 12.0 → 9.5 USDT
Extreme target: 7.5 – 6.56 USDT, the historical low on the chart.
Such a breakdown would invalidate the medium-term higher-low structure and confirm full bearish control.
---
Conclusion
ENS stands at a technical cliff — this 16.5–14.0 zone will decide whether it marks the foundation for a new bullish cycle or the start of a major downtrend.
Traders who stay patient and wait for clear weekly confirmation will find the best opportunities here — with defined risk and strong potential reward.
---
#ENSUSDT #EthereumNameService #CryptoAnalysis #TradingView #SupportResistance #Trendline #Breakout #BullishScenario #BearishScenario #TechnicalAnalysis #CryptoWeekly #ENSAnalysis #CryptoChart
Ensusdttrade

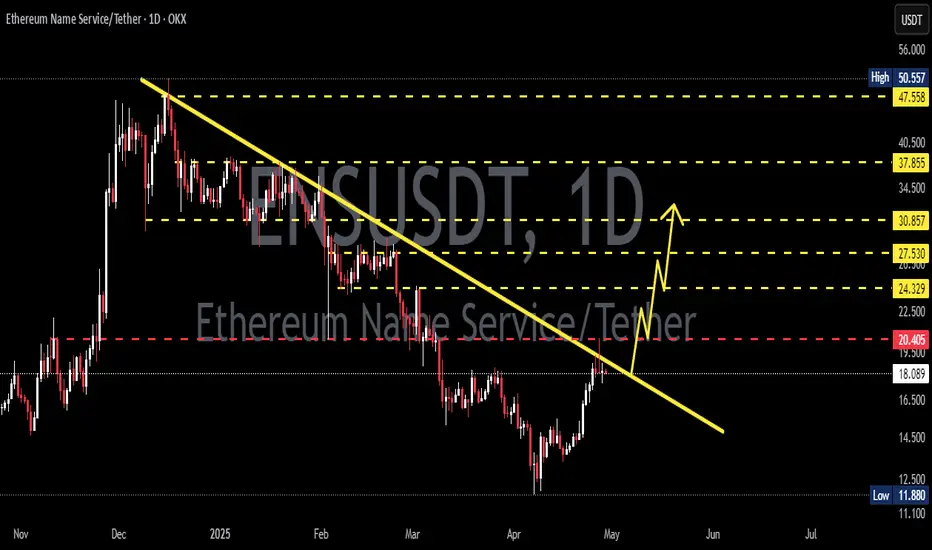
ENSUSDT – Final Pressure at Critical Zone: Buyer or Seller Wins?Overview
ENS price is currently at a decisive point — compressed within a descending triangle formation, narrowing right above the major demand zone between 17.5–19.5 USDT.
After a prolonged correction from its local highs, the market is now facing an intense battle between fading selling pressure and persistent buying defense around this key support.
The upcoming move will likely define the next major trend for ENS in the following weeks.
---
Structure and Pattern
Main Pattern: Descending Triangle — signaling consistent selling pressure but also potential for a strong reversal if a breakout occurs.
Critical Zone: The 17.5–19.5 USDT area acts as a long-standing demand zone that has repeatedly held price throughout 2025.
Short-Term Dynamics: The series of lower highs forming the descending trendline indicates a phase of accumulation or waiting for a key catalyst.
---
Bullish Scenario – Reversal from Demand Zone
If ENS manages to break above the descending trendline and close a daily candle above 24.15 USDT, it would confirm a valid bullish breakout from the pattern.
Confirmation: A daily candle with strong volume closing above the trendline.
Upside Targets: 24.15 → 27.7 → 30.67 → 37.6 → up to 47.9 USDT if momentum continues.
Strategy: Wait for a retest around the breakout area for confirmation. Maintain a stop-loss below 17.5 to manage risk.
Such a breakout could mark the beginning of a major reversal, especially if supported by rising volume and positive sentiment within the Ethereum Name Service (ENS) and Web3 ecosystem.
---
Bearish Scenario – Breakdown from Historical Support
Conversely, if selling pressure pushes the price below the 17.5 USDT zone, the mid-term structure may shift into a bearish continuation.
Confirmation: A daily close below 17.5 with strong volume.
Downside Targets: 15.0 → 12.0 → potential retest of the historical low at 11.9.
Strategy: Consider short positions after a breakdown and retest of the former support-turned-resistance area.
A confirmed breakdown below this demand zone would reinforce the narrative that buyers are losing control, opening the door to a new downward trend phase.
---
Technical Conclusion
ENS is currently at a critical inflection point — the 17.5–19.5 zone represents the buyers’ last stand.
A breakout above the descending trendline could ignite a significant rally toward 30–37 USDT,
while a breakdown below the demand zone could extend the correction into the 12–15 USDT range.
Watch price reaction and volume within the yellow zone, as it will determine the winner of this crucial market battle.
---
#ENS #ENSUSDT #CryptoAnalysis #TechnicalAnalysis #PriceAction #DescendingTriangle #SupportResistance #BreakoutTrading #SwingTrade #Web3 #EthereumNameService #CryptoTrading

ENS/USDT Weekly Outlook – “Massive Breakout Brewing from Base
Ethereum Name Service (ENS) is currently positioned at a critical inflection point on the weekly chart, signaling a high-probability setup for a massive bullish breakout after nearly 2 years of sideways consolidation and structural base building.
🔍 Technical Pattern Breakdown
This chart reveals a macro Ascending Triangle formation developing since late 2022, with higher lows consistently respecting a rising trendline support and price now retesting the golden pocket Fib zone.
Pattern Formed:
📐 Macro Ascending Triangle + Fibonacci Confluence Zone
📉 Long-Term Accumulation Range: $14.6 – $23.7
Trendline Support:
✅ Rising since 2023, showing buyers consistently stepping in at higher levels
Fibonacci Retracement:
🔑 Price currently sitting between 0.5–0.786 Fib zone from the 2023 rally:
0.5 = $18.33
0.618 = $16.82
0.786 = $14.68
🟢 Bullish Scenario – Potential Multi-Leg Rally
If price holds and rebounds from this support region, we could see a stepped breakout with key resistance levels being taken out one by one:
1. First Resistance – $23.73: Psychological and structural breakout level
2. Second Target – $30.48: Prior major rejection area
3. Third Target – $47.13: 2024 resistance high
4. Macro Target – $69.99 to $85.88: Full breakout potential from triangle width and historical ATH zone
🚀 Upside Potential from Current Levels (~$18): Over 350%
📈 This would confirm the end of the accumulation cycle and signal the start of a long-term bullish phase.
🔴 Bearish Scenario – Breakdown Risk
In the event of a confirmed weekly candle closing below $14.6, we invalidate the ascending triangle and shift bias toward bearish retracement:
Next Support: $10.00
Extreme Bearish Target: $6.65 (macro low from 2022)
🛑 Breakdown from this structure would suggest failure of the accumulation pattern and return to long-term bearish pressure.
💡 Strategic Insight
ENS is one of the rare altcoins currently forming a clean high-timeframe bullish setup. This is the kind of structure institutional or swing traders look for when anticipating early entries before explosive moves.
With a tight invalidation below $14.6 and multiple upside targets, this setup provides a strong risk-reward opportunity.
#ENS #ENSUSDT #AltcoinBreakout #CryptoSetup #Accumulation #TechnicalAnalysis #CryptoTrading #SwingTrade #Fibonacci #AscendingTriangle

ENS SWING Trade SetupENS Showing strong momentum towards upside and dropped without touching POI, So it can go higher first then it may take correction, spot and future trader can take risk on this. Wait for the entries and enter from 20-19 level, if price reverse from any other point, then wait for the 4hrs candle closing above 26 and target the 30-32$ level. for scalp and day trading get long from 22.40 SL 21.65 and set tp 25.56 & 27.79$.

ENSUSDT 1D AnalysisENS ~ 1D Analysis
#ENS Buy after successfully penetrating this resistant line with a short -term target of at least 10%+ from here.
ENSUSDT 4DENS ~ 4D Analysis
#ENS Buy gradually from here if you still have a Conviction on this coin with a short -term target of at least 15%+.

ENSUSDT 5DENS ~ 5D Analysis
#ENS If you still have a Conviction on this coin, maybe this support you can consider to start buying back from here with a short -term target of at least 15%+.

ENSUSDT 1WENS ~ 1W
#ENS So far it continues to maintain its bullish structure. This is wave 2 in the Eliot Wave pattern. Buy gradually within this support block.with a minimum target of 20+

ENS showing a stunning Regular-Flat🚀 #ENS @ensdomainsis showing a stunning Regular-Flat (a,b,c) structure 😍
There’s a slight bullish divergence on the MACD between the two tops (🟠).
But on the MACD (⬜️) we can see that the correction is done.
Looking for to reach at least $23, then aiming for the top! 💸

Ethereum Name Service ENS price needs to take a break from growtThe price of CRYPTOCAP:ETH has finally started to rise 👇
follow they're accelerating growth of the #ENS price (which has the word #Ethereum in its name)
#ENS is an Ethereum Name Service control token used to control the protocol and influence the pricing decisions of its .eth address and price oracle.
In our opinion, now it is not so much important for #ENSUSDT buyers to continue their rapid growth as it is to finally hold the price above $23.60 , which they have not been able to do by all 2024.
Only then will it be possible to continue the steady wave of growth to $80+.
_____________________
Did you like our analysis? Leave a comment, like, and follow to get more

Cage Cycle Values for ENSUSDT.PCage Cycle Values: If the price is above 26.770 (Buy Point), the price target is 35.330, and if it is below 26.623 (Sell Point), the price target is 18.103. You can find the details of the Cage Cycle strategy attached. (MAKE SURE TO FOLLOW THE NEW TAKE PROFIT POINTS PUBLISHED AS TAKE PROFIT POINTS ARE INCREASED ACCORDING TO THE TRADING CYCLE)
Long Position:
Entry: 26.770
Profit: 35.330 (Will be updated if necessary in the positive direction)
Stop: 26.623
Short Position:
Entry: 26.623
Profit:18.103 (Will be updated if necessary in the positive direction)
Stop: 26.770
The Cage Cycle Strategy is a model that emerges from analyzing approximately 2 over 20 data points (1,000,000 and above tick data). The price definitely reaches one of the specified Take Profit Points as a price target. It is not possible to determine the direction with a hundred percent certainty in financial markets. Therefore, success rates are attempted to be increased by using certain models. The Cage Cycles end when the price reaches the price target in any direction in the Cage Cycle Strategy. Although it is not an investment advice, an example of use is as follows: A Long position is opened at the price level of 26.770, the Stop Loss is 26.623, and the Take Profit is 35.330. When the price reaches 26.623, instead of the Long position that was stopped, a Short Position is opened, with the Stop Loss of the Short Position being 26.770 and the Take Profit being 18.103. Transactions are monitored by stopping until the market direction is determined. Considering the number of stopped transactions and the expected time, Take Profit points are updated to increase profits (Updated Take Profit Points will never be lower than the initially specified Take Profit points). By recalculating the Take Profit points to increase profits, the aim is to compensate for the losses of the stopped transactions when the Cage Cycle ends. In the data analysis of the last 10 years, the average number of stops is 12, and the highest number of stops is calculated as 83 (These figures may vary in the future). Although it is not an investment advice, in the Cage Cycle, if the amount to be stopped is set at $1, by increasing the position by half of the initial lot amount for every 10 stops (0.5 $ for every 10 stops), a higher profit can be targeted along with the increased Take Profit point. Using the Cage Cycle data provided above as an example for Ensusdt, after 15 stops, when the cycle ends, the profit-loss calculation (Initial Stop Amount to be stopped is $1): For the first 10 stops, the loss will be 10$*1=10$, and between 10 and 15 stops, the loss will be 5*1.5$= 7.5$, resulting in a total loss of 17.5$. The profit to be obtained with the updated Take Profit points will be 1.5*27= 40.5$. The net profit, excluding commission, will be 40.5-17.5= 23$. The Cage Cycle helps you determine the Take Profit point in your own trades as well, as it is known that the price will definitely reach one of the Take Profit points. Enjoy and Good luck with your trades.
THIS IS NOT AN INVESTMENT ADVICE. Made by Yourcages

Ethereum Name Service ENS price strong but there is a nuanceGiven the media hype surrounding the CRYPTOCAP:ETH ETF and the word #Ethereum, which is also in the name of the #ENS token, it's no surprise that #ENSUSD price has been rising so well over the past week
#ENS is an Ethereum Name Service token used to manage the protocol and influence the pricing decisions of its .eth address and price oracle.
Since the story around the #ETH ETF is not yet fully resolved, we can assume that there is still potential for growth in the ENS price, at least to $39-40.
🔽But looking at the #ENSUSDT chart, we see some rather “dangerous” shadows that may suggest that someone is selling aggressively.
Therefore, we would probably risk buying #ENSUSDT no earlier than $21.30, but for now, we are watching this asset.

ENSUSD 1WENS ~ 1W
#ENS Make purchases gradually or you can make purchases after successfully breaking through this resistance block. , With a target of at least 20%+ from here.

ENSUSDT at weekly resistance, likely to land on weekly supportThe price has moved to the weekly resistance WR1 and got rejected from there on the first attempt and found support on the zone where weekly support WS1 lies. The price made another attempt at the weekly resistance WR1 only to get rejected again. The price is currently trading under this resistance after getting rejected. If the price lands on the support WS1 then it will be a long opportunity again. The next resistance on its way up is weekly resistance WR2 and that will pose significant resistance to the price movement.

ENS/USDTTRADE ALERT!ENS
Ticker: ENS/USDT
Entry: 16.70-18.25
Take Profit:24.00-28.00
Stop Loss: 14.00
Risk to reward: 1:2
Technical Thesis: Price is taking a pullback.We have 0.5 fib and 0.618 fib zone.
18.25$ to 16.70$ area.Expecting a bounce in price from this level soon.

ENSUSDTBINANCE:ENSUSDT Long idea
⛔"Daily crypto market analyses I provide are personal opinions & not financial advice. Trading carries risks, so do your own research & seek advisor's help.#DYOR"
Don't forget to like and comment

📈 ENS Bullish Potential 🚀💰
ENS is showing strong signs of a bullish move. 🐂 I anticipate the price to rise towards $20 from this point onwards. Let's keep a close eye on it. 🤞
Please note, this is not financial advice. Always do your own research (DYOR) before making any investment decisions. 💼🔍

ENSUSDTBINANCE:ENSUSDT Short idea
⛔"Daily crypto market analyses I provide are personal opinions & not financial advice. Trading carries risks, so do your own research & seek advisor's help.#DYOR"
Don't forget to like and comment

ENSUSDT - I wonder what will happen after this metric#ENS Reasons for possible growth:
1. Whales and their accumulations look "healthy"
2. Network growth. In the case of ENS, "the crowd is buying the fall." Whenever the crowd "buys the fall" - it's gone. Only when the crowd "gives up" can it go in. If the metric doesn't go up much in the next 48 hours - maybe the crowd has given up.
I wonder how such a crappy metric will play out.
This metric is available to everyone.
Graphically you can see the structure of the buyer. In the yellow zone someone is aggregating a position. If on all of the straits ENS will hold, there will be a rally. if not, we will fly to the renewal of the low!

Ethereum Name Service(ENS) formed Gartley for upto 14.50% moveHi dear friends, hope you are well and welcome to the new trade setup of Ethereum Name Service (ENS) US Dollar pair.
On a 4-hr time frame, ENS has formed a bullish Gartley pattern.
Note: Above idea is for educational purpose only. It is advised to diversify and strictly follow the stop loss, and don't get stuck with trade

$ENS - ConsolidatingClearly consolidating at resistance - there is a want to go higher - seeing shorts being swallowed.
If can push through and retest - turning resistance to support - should see a push to higher line -> Big IF however - if rejected aim low support...
Largely will be related to MACRO environment over next week
If CPI / US Jobs data come in on-expectations - expect a push lower - this is due to likely response from FED being "right - we haven't broken anything yet - lets push harder for 75bps hike" - if however jobs growth / income growth weaker than exp. will see some evidence of risk on appetite....short term
Lets see.
Remember the market is forward looking - these things are around 75% baked in already.

ENS USDT bear or Bullish ?Although it has performed well in the past months, I feel that the time has come to correct the price
my opinion
Bear market
your own risk

🟢 ENSUSDT - 15M (30.09.2022)🟢 ENSUSDT
TF: 15M
Side: Long
SL: $15.1589
TP 1: $15.5021
TP 2: $15.6518
TP 3: $15.7728
Little pump coming for ENSUSDT.
