EOS/USD | Bullish Momentum Building After BounceEOS/USD has bounced off the buy entry and could rise from this level to the upside.
Buy entry is at 0.2748, which is a pullback support.
Stop loss is at 0.2703, which is a pullbakc support.
Take profit is at 0.2908, which is an overlap resistance that is slightly below thhe 61.8% Fibonacci retracement.
Stratos Markets Limited (tradu.com ):
CFDs are complex instruments and come with a high risk of losing money rapidly due to leverage. 68% of retail investor accounts lose money when trading CFDs with this provider. You should consider whether you understand how CFDs work and whether you can afford to take the high risk of losing your money.
Stratos Europe Ltd (tradu.com ):
CFDs are complex instruments and come with a high risk of losing money rapidly due to leverage. 70% of retail investor accounts lose money when trading CFDs with this provider. You should consider whether you understand how CFDs work and whether you can afford to take the high risk of losing your money.
EOS-USD

EOSUSD H4 | Momentum Set to ContinueBased on the H4 chart analysis, we can see that the price has rejected off the sell entry, which is a pullback resistance and could drop from this level to the downside.
Sell entry is at 0.4051, which is a pullback resistance.
Stop loss is at 0.44221, which is a pullback resistance that is slightly above the 61.8% Fibonacci retracement.
Take profit is at 0.3390, which lines up with the 61.8% Fibonacci projection and the 161.8% Fibonacci extension.
High Risk Investment Warning
Trading Forex/CFDs on margin carries a high level of risk and may not be suitable for all investors. Leverage can work against you.
Stratos Markets Limited (tradu.com ):
CFDs are complex instruments and come with a high risk of losing money rapidly due to leverage. 65% of retail investor accounts lose money when trading CFDs with this provider. You should consider whether you understand how CFDs work and whether you can afford to take the high risk of losing your money.
Stratos Europe Ltd (tradu.com ):
CFDs are complex instruments and come with a high risk of losing money rapidly due to leverage. 66% of retail investor accounts lose money when trading CFDs with this provider. You should consider whether you understand how CFDs work and whether you can afford to take the high risk of losing your money.
Stratos Global LLC (tradu.com ):
Losses can exceed deposits.
Please be advised that the information presented on TradingView is provided to Tradu (‘Company’, ‘we’) by a third-party provider (‘TFA Global Pte Ltd’). Please be reminded that you are solely responsible for the trading decisions on your account. There is a very high degree of risk involved in trading. Any information and/or content is intended entirely for research, educational and informational purposes only and does not constitute investment or consultation advice or investment strategy. The information is not tailored to the investment needs of any specific person and therefore does not involve a consideration of any of the investment objectives, financial situation or needs of any viewer that may receive it. Kindly also note that past performance is not a reliable indicator of future results. Actual results may differ materially from those anticipated in forward-looking or past performance statements. We assume no liability as to the accuracy or completeness of any of the information and/or content provided herein and the Company cannot be held responsible for any omission, mistake nor for any loss or damage including without limitation to any loss of profit which may arise from reliance on any information supplied by TFA Global Pte Ltd.
The speaker(s) is neither an employee, agent nor representative of Tradu and is therefore acting independently. The opinions given are their own, constitute general market commentary, and do not constitute the opinion or advice of Tradu or any form of personal or investment advice. Tradu neither endorses nor guarantees offerings of third-party speakers, nor is Tradu responsible for the content, veracity or opinions of third-party speakers, presenters or participants.

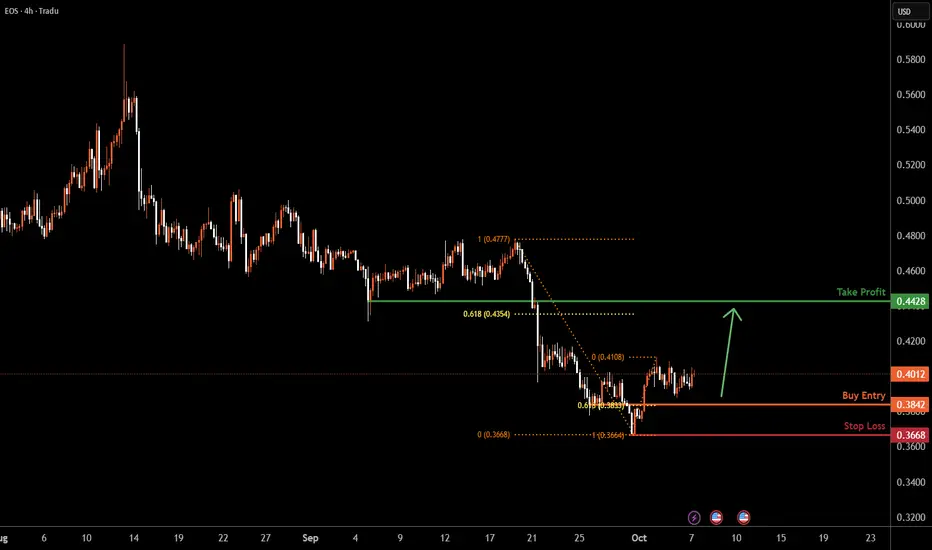
EOSUSD H4 | Potential Bullish Reversal FormingEOSUSD is falling towards the buy entry, which is a pullback support that aligns with the 61.8% Fibonacci retracement and could bounce from this level to the upside.
Buy entry is at 0.3842, which is a pullback support that aligns with the 61.8% Fibonacci retracement.
Stop loss is at 0.3668, which is a pullback support.
Take profit is at 0.4428, which is a pullback resistance that is slightly above the 61.8% Fibonacci retracement.
High Risk Investment Warning
Trading Forex/CFDs on margin carries a high level of risk and may not be suitable for all investors. Leverage can work against you.
Stratos Markets Limited (tradu.com ):
CFDs are complex instruments and come with a high risk of losing money rapidly due to leverage. 65% of retail investor accounts lose money when trading CFDs with this provider. You should consider whether you understand how CFDs work and whether you can afford to take the high risk of losing your money.
Stratos Europe Ltd (tradu.com ):
CFDs are complex instruments and come with a high risk of losing money rapidly due to leverage. 66% of retail investor accounts lose money when trading CFDs with this provider. You should consider whether you understand how CFDs work and whether you can afford to take the high risk of losing your money.
Stratos Global LLC (tradu.com ):
Losses can exceed deposits.
Please be advised that the information presented on TradingView is provided to Tradu (‘Company’, ‘we’) by a third-party provider (‘TFA Global Pte Ltd’). Please be reminded that you are solely responsible for the trading decisions on your account. There is a very high degree of risk involved in trading. Any information and/or content is intended entirely for research, educational and informational purposes only and does not constitute investment or consultation advice or investment strategy. The information is not tailored to the investment needs of any specific person and therefore does not involve a consideration of any of the investment objectives, financial situation or needs of any viewer that may receive it. Kindly also note that past performance is not a reliable indicator of future results. Actual results may differ materially from those anticipated in forward-looking or past performance statements. We assume no liability as to the accuracy or completeness of any of the information and/or content provided herein and the Company cannot be held responsible for any omission, mistake nor for any loss or damage including without limitation to any loss of profit which may arise from reliance on any information supplied by TFA Global Pte Ltd.
The speaker(s) is neither an employee, agent nor representative of Tradu and is therefore acting independently. The opinions given are their own, constitute general market commentary, and do not constitute the opinion or advice of Tradu or any form of personal or investment advice. Tradu neither endorses nor guarantees offerings of third-party speakers, nor is Tradu responsible for the content, veracity or opinions of third-party speakers, presenters or participants.
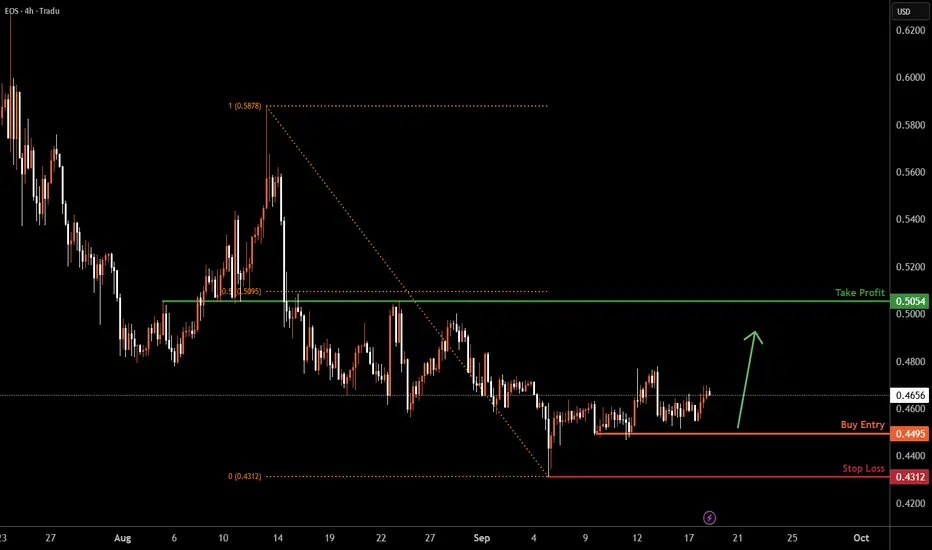
EOSUSD H4 | Bullish reversal at key supportEOS/USD has bounced off the buy entry which is a pullback support and could potentially rise from this level to the upside.
Buy entry is at 0.4495, which is a pullback support.
Stop loss is at 0.4312, which is a pullback support.
Take profit is at 0.5054, which is an overlap resistance that is slightly below the 50% Fibonacci retracement.
High Risk Investment Warning
Trading Forex/CFDs on margin carries a high level of risk and may not be suitable for all investors. Leverage can work against you.
Stratos Markets Limited (tradu.com ):
CFDs are complex instruments and come with a high risk of losing money rapidly due to leverage. 65% of retail investor accounts lose money when trading CFDs with this provider. You should consider whether you understand how CFDs work and whether you can afford to take the high risk of losing your money.
Stratos Europe Ltd (tradu.com ):
CFDs are complex instruments and come with a high risk of losing money rapidly due to leverage. 66% of retail investor accounts lose money when trading CFDs with this provider. You should consider whether you understand how CFDs work and whether you can afford to take the high risk of losing your money.
Stratos Global LLC (tradu.com ):
Losses can exceed deposits.
Please be advised that the information presented on TradingView is provided to Tradu (‘Company’, ‘we’) by a third-party provider (‘TFA Global Pte Ltd’). Please be reminded that you are solely responsible for the trading decisions on your account. There is a very high degree of risk involved in trading. Any information and/or content is intended entirely for research, educational and informational purposes only and does not constitute investment or consultation advice or investment strategy. The information is not tailored to the investment needs of any specific person and therefore does not involve a consideration of any of the investment objectives, financial situation or needs of any viewer that may receive it. Kindly also note that past performance is not a reliable indicator of future results. Actual results may differ materially from those anticipated in forward-looking or past performance statements. We assume no liability as to the accuracy or completeness of any of the information and/or content provided herein and the Company cannot be held responsible for any omission, mistake nor for any loss or damage including without limitation to any loss of profit which may arise from reliance on any information supplied by TFA Global Pte Ltd.
The speaker(s) is neither an employee, agent nor representative of Tradu and is therefore acting independently. The opinions given are their own, constitute general market commentary, and do not constitute the opinion or advice of Tradu or any form of personal or investment advice. Tradu neither endorses nor guarantees offerings of third-party speakers, nor is Tradu responsible for the content, veracity or opinions of third-party speakers, presenters or participants.
EOSUSD H4 | Bullish bounceBased on the H4 chart analysis, the price is falling towards the buy entry, which is a multi swing low support, and could bounce from this level to the take profit.
Buy entry is at 0.4586, which is a multi swing low support.
Stop loss is at 0.4173, which is a swing low support.
Take profit is at 0.5059, which is an overlap resistance.
High Risk Investment Warning
Trading Forex/CFDs on margin carries a high level of risk and may not be suitable for all investors. Leverage can work against you.
Stratos Markets Limited (tradu.com ):
CFDs are complex instruments and come with a high risk of losing money rapidly due to leverage. 65% of retail investor accounts lose money when trading CFDs with this provider. You should consider whether you understand how CFDs work and whether you can afford to take the high risk of losing your money.
Stratos Europe Ltd (tradu.com ):
CFDs are complex instruments and come with a high risk of losing money rapidly due to leverage. 66% of retail investor accounts lose money when trading CFDs with this provider. You should consider whether you understand how CFDs work and whether you can afford to take the high risk of losing your money.
Stratos Global LLC (tradu.com ):
Losses can exceed deposits.
Please be advised that the information presented on TradingView is provided to Tradu (‘Company’, ‘we’) by a third-party provider (‘TFA Global Pte Ltd’). Please be reminded that you are solely responsible for the trading decisions on your account. There is a very high degree of risk involved in trading. Any information and/or content is intended entirely for research, educational and informational purposes only and does not constitute investment or consultation advice or investment strategy. The information is not tailored to the investment needs of any specific person and therefore does not involve a consideration of any of the investment objectives, financial situation or needs of any viewer that may receive it. Kindly also note that past performance is not a reliable indicator of future results. Actual results may differ materially from those anticipated in forward-looking or past performance statements. We assume no liability as to the accuracy or completeness of any of the information and/or content provided herein and the Company cannot be held responsible for any omission, mistake nor for any loss or damage including without limitation to any loss of profit which may arise from reliance on any information supplied by TFA Global Pte Ltd.
The speaker(s) is neither an employee, agent nor representative of Tradu and is therefore acting independently. The opinions given are their own, constitute general market commentary, and do not constitute the opinion or advice of Tradu or any form of personal or investment advice. Tradu neither endorses nor guarantees offerings of third-party speakers, nor is Tradu responsible for the content, veracity or opinions of third-party speakers, presenters or participants.

EOS' last line of defenseEOS needs to break 2$ to get on a mini-bullrun to all-time highs and beyond, with main support at 4-5$. Otherwise - when rejected - this project will go down forever.

EOS/USD (POTENTIAL BUY LEVEL) ***BULLISH SENTIMENTThis is just my basic MONTHLY charting.
I have marked what I see as the bottom (support).
I see overall DOWNTREND with POSSIBLE reversal.
I have marked my potential BUY LEVELS for LONGS/CALLS.

💡Don't miss the great buy opportunity in EOSUSD @EosNFoundationTrading suggestion:
". There is a possibility of temporary retracement to the suggested support line (1.418).
. if so, traders can set orders based on Price Action and expect to reach short-term targets."
Technical analysis:
. EOSUSDT is in a range bound, and the beginning of an uptrend is expected.
. The price is above the 21-Day WEMA, which acts as a dynamic support.
. The RSI is at 57.
Take Profits:
TP1= @ 1.574
TP2= @ 1.660
TP3= @ 1.837
TP4= @ 1.947
TP5= @ 2.041
SL= Break below S2
❤️ If you find this helpful and want more FREE forecasts in TradingView
. . . . . Please show your support back,
. . . . . . . . Hit the 👍 LIKE button,
. . . . . . . . . . Drop some feedback below in the comment!
❤️ Your support is very much 🙏 appreciated! ❤️
💎 Want us to help you become a better Forex / Crypto trader ?
Now, It's your turn !
Be sure to leave a comment; let us know how you see this opportunity and forecast.
Trade well, ❤️
ForecastCity English Support Team ❤️

💡Don't miss the great buy opportunity in EOSUSD @EosNFoundationTrading suggestion:
". There is a possibility of temporary retracement to the suggested support line (1.418).
. if so, traders can set orders based on Price Action and expect to reach short-term targets."
Technical analysis:
. EOSUSDT is in a range bound, and the beginning of an uptrend is expected.
. The price is above the 21-Day WEMA, which acts as a dynamic support.
. The RSI is at 57.
Take Profits:
TP1= @ 1.574
TP2= @ 1.660
TP3= @ 1.837
TP4= @ 1.947
TP5= @ 2.041
SL= Break below S2
❤️ If you find this helpful and want more FREE forecasts in TradingView
. . . . . Please show your support back,
. . . . . . . . Hit the 👍 LIKE button,
. . . . . . . . . . Drop some feedback below in the comment!
❤️ Your support is very much 🙏 appreciated!❤️
💎 Want us to help you become a better Forex / Crypto trader?
Now, It's your turn!
Be sure to leave a comment; let us know how you see this opportunity and forecast.
Trade well, ❤️
ForecastCity English Support Team ❤️

EOSUSD Potential for Bearish Dip | 14th April 2022Price is near sell entry of 2.3655 in line with 23.6% of Fibonacci retracement and 100% Fibonacci projection. Price can potentially dip to the take profit level of 2.1257 in line with 61.8% Fibonacci projection. Our bearish bias is supported by price trading under Ichimoku cloud.
Any opinions, news, research, analyses, prices, other information, or links to third-party sites contained on this website are provided on an "as-is" basis, as general market commentary, and do not constitute investment advice. The market commentary has not been prepared in accordance with legal requirements designed to promote the independence of investment research, and it is therefore not subject to any prohibition on dealing ahead of dissemination. Although this commentary is not produced by an independent source, FXCM takes all sufficient steps to eliminate or prevent any conflicts of interest arising out of the production and dissemination of this communication. The employees of FXCM commit to acting in the clients' best interests and represent their views without misleading, deceiving, or otherwise impairing the clients' ability to make informed investment decisions. For more information about the FXCM's internal organizational and administrative arrangements for the prevention of conflicts, please refer to the Firms' Managing Conflicts Policy. Please ensure that you read and understand our Full Disclaimer and Liability provision concerning the foregoing Information, which can be accessed on the website.

bulish is comingIt's time to relax a bit and rise high after it hits the support lines. Good prospects in the long term.

💡Don't miss the great buy opportunity in EOSUSDT @EOSIOTrading suggestion:
". There is a possibility of temporary retracement to the suggested support line (2.826).
. if so, traders can set orders based on Price Action and expect to reach short-term targets."
Technical analysis:
. EOSUSDT is in a range bound, and the beginning of an uptrend is expected.
. The price is above the 21-Day WEMA, which acts as a dynamic support.
. The RSI is at 53.
Take Profits:
TP1= @ 3.001
TP2= @ 3.143
TP3= @ 3.310
TP4= @ 3.492
TP5= @ 3.764
SL= Break below S2
❤️ If you find this helpful and want more FREE forecasts in TradingView
. . . . . Please show your support back,
. . . . . . . . Hit the 👍 LIKE button,
. . . . . . . . . . Drop some feedback below in the comment!
❤️ Your support is very much 🙏 appreciated!❤️
💎 Want us to help you become a better Forex / Crypto trader?
Now, It's your turn!
Be sure to leave a comment; let us know how you see this opportunity and forecast.
Trade well, ❤️
ForecastCity English Support Team ❤️

💡Don't miss the great buy opportunity in EOSUSDT @EOSIOTrading suggestion:
". There is a possibility of temporary retracement to the suggested support line (2.826).
. if so, traders can set orders based on Price Action and expect to reach short-term targets."
Technical analysis:
. EOSUSDT is in a range bound, and the beginning of an uptrend is expected.
. The price is above the 21-Day WEMA, which acts as a dynamic support.
. The RSI is at 53.
Take Profits:
TP1= @ 3.001
TP2= @ 3.143
TP3= @ 3.310
TP4= @ 3.492
TP5= @ 3.764
SL= Break below S2
❤️ If you find this helpful and want more FREE forecasts in TradingView
. . . . . Please show your support back,
. . . . . . . . Hit the 👍 LIKE button,
. . . . . . . . . . Drop some feedback below in the comment!
❤️ Your support is very much 🙏 appreciated! ❤️
💎 Want us to help you become a better Forex / Crypto trader ?
Now, It's your turn !
Be sure to leave a comment; let us know how you see this opportunity and forecast.
Trade well, ❤️
ForecastCity English Support Team ❤️


Eos bullish divergence creatingWe know market is now too much volatile....
Some opportunities are available here many alts now i find this on eos it can give a small profit in this bear market.... Never lose opportunity ...

EOS testing its major support level We can see that this support has been holding quite strongly for several months despite the high volatility on the market. It looks like EOS is ready to pump from here.


EosHello everyone, I wish you whatever you want. Friends of this currency is technically good. And I think if you are very careful with this currency, you will get a good profit

EOS ready for 7.50Bulls managed to push the price towards 23% of Fib. starting from the highest level this year - 14.48. there traders collected some good profits following the uptrend from 3.20. The price has made a correction to the main support level at 5. Following the history of the chart, we can see the price bounces back up from this support every time since the beginning of the trend. Since EOS is traded above this support, the trend is not over yet. Buyers are expected to enter here around this zone - 5-4.85 and push for the next target 7.50. The idea gets invalid if we see a close below 4.53 on 4h chart.

EOS/USD:BAT PATTERN FORMATION ON H4 TIMEFRAME | SHORT IDEA 🔔Welcome back Traders, Investors, and Community!
Check the Links on BIO and If you LIKE this analysis, Please support our Idea by hitting the LIKE 👍 button
Traders, if you like this idea or have your own opinion about it, please write your own in the comment box . We will be glad for this.
Feel free to request any pair/instrument analysis or ask any questions in the comment section below.
Have a Good Day Trading !

EOS going beyond $5All right, we can see that the price managed to break the resistance of the up channel yesterday which started around $3. Bulls pushed the price above $5 mark yesterday and then we witnessed a correction to 4.60 due to a profit-taking interest among the traders. Buyers reloaded at 4.60 and we can see that EOS is forming a good support at $4.80 now (which was the top of the channel before).

Broken Resistance - New SupportBulls have pushed recently and the price bounced back up from 50 MA (blue line) as expected. The bounce brought the price back to the up channel. The resistance at 4.50 has been broken and now EOS is finding good support there getting ready for its next move to the upside.

False Breakout, Support at 50 MAWe can see that bears tried to break down the up-channel on 4 hours chart, however bulls are still in control and EOS has found a good support at 50 MA (blue line) and it could not get broken for the past several days. Also, we can see MACD lines are about to cross each other soon and the orange line to go below the blue line which confirms buying signal. Following these indicators, we could expect the price getting back to the up-channel and eventually breaking the next resistance at 4.50 mark.
