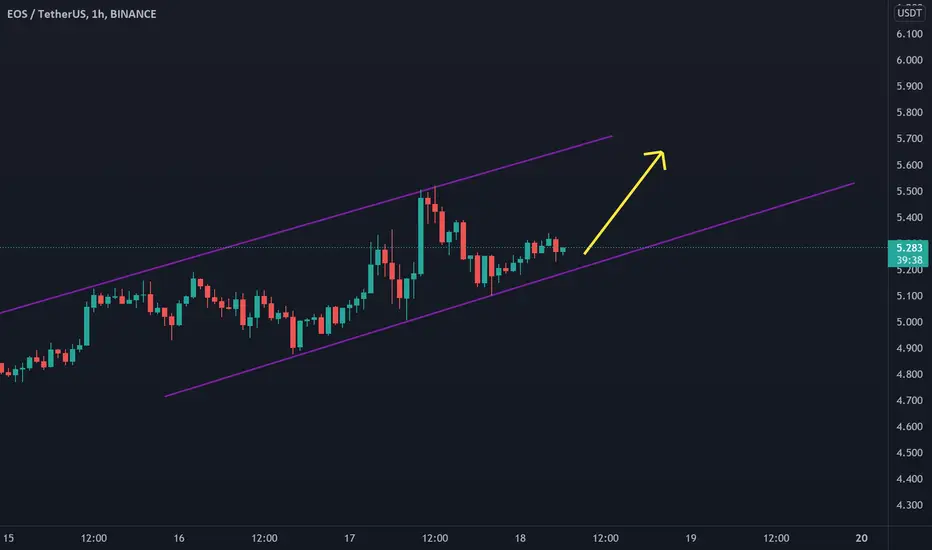
EOS/BTC buy opportunityHi followers,
EOSBTC showing first signs of trend reversal, after long period of consolidation, the pair forming slightly higher highs.
A break out above the resistance line can be very powerful move.
Don't forget to manage your risk! 👌
Good luck and trade with care 🙏
If you like my content - 👍 Like, 💬 comment, 👆 follow and 👉 share!
❗❗❗
Disclaimer: This information is not a recommendation to BUY or SELL. It is to be used for educational purposes only!
EOS
EOS DAILY SCALENOWLY IN FRONT OF RESISTANCE AND AFTER SUPPORTING by the lower price we can predicted higher price
EOS/BTC Long (Long-term and Safe)If you want more BTC in the future, it's a good opportunity for you.
We are in the lowest level of the weekly support.
You can see the resistance levels on the chart.
You can enter in the current price and set different take profits step by step in each level.
It's takes time to reach the top levels but it could be happen.
* This is not a financial advice
🔥 EOS Break Out: Bullish Price Action AheadWith Bitcoin showing exceptional bullish behaviour, many alts are riding the bullish wave up as well.
EOS is one of them. As seen on the chart, EOS has broken out of the horizontal trading area and is now slowly climbing up.
Main target for the current move is placed at $5.50.
Happy trading!
₿ EOSUSDT 1D ₿ : #Buy_Recommendation 🟢As we can see, after breaking its downward trend, the price is gathering strength to start a strong rise .
In order to buy, the SL (stop loss) and capital management must be observed.
All resistances and TPs (take profits) are marked on the chart. BINANCE:EOSUSDT
⚠️ This Analysis will be updated ...
👤 Arman Shaban : @Ar_M_An_4
📅 16.Sep.2021
⚠️(DYOR)
EOS, WAITING FOR BREAKOUT...After this breakout we will see the top of the cloud (5.35). Be sure to open your long positions after the 5.35, Because we may have a ranging action from price and coming down again. If it couldn't break the dynamic resistance, other points are marked for entry.
Thank you so much, Have a great day >_-
EOSBTCEOS has formed a diametric pattern and we are in the end wave G and the next months can be good for this coin.
Eos usdtHello Traders
Eos is one of my Favorites coin .
I think EOS will climb after breaking his resistance level
so I'm ready to buy ...
what is your opinion?
EOSDisclaimer: All Videos/Information on this channel are for Education purpose only .They are not buy/Sell Recommendations . Please consult your financial Advisor before taking any trade or investment decisions.
EOS easy BullHere we go again EOS ready to break ATH coin in the right position to break out and move all the way up to ATH watch this coin make ways.
Why? This coin have been doing work and building relation with other company's that will most likely not lower the value of this coin.
Coin is still under valued and will likely move up wards.
Analysis of this coin is showing resistant at the $4 we may see $7 and after $15 dollars
If this help you Please follow for more free analysis.
CrptoWhale100Billion
Eos will be 5111111111111111111111111111111111111111111111111111111111111111111111111111111111111111111
EOS ready for 7.50Bulls managed to push the price towards 23% of Fib. starting from the highest level this year - 14.48. there traders collected some good profits following the uptrend from 3.20. The price has made a correction to the main support level at 5. Following the history of the chart, we can see the price bounces back up from this support every time since the beginning of the trend. Since EOS is traded above this support, the trend is not over yet. Buyers are expected to enter here around this zone - 5-4.85 and push for the next target 7.50. The idea gets invalid if we see a close below 4.53 on 4h chart.
EOS EOSUSD - Rounding bottom + NEW ATH very soon!- This is my analysis for EOS , a lot of poepole asking about why EOS is not pumping.
- On the chart we can see a rounding bottom or cap and handle formation, which is bullish .
- After a rectangle consolidaton, the price started with an Impulse Elliott wave .
- First target 1:1 / below all time high.
- RSI is ready and volume favors bulls.
- For expected duration of the trade, probability, stop loss, profit target, entry price and risk to reward ratio ( RRR ) - please check my signature below ↓
- If you want to see more of these ideas, hit "Like" & "Follow"!
EOS (EOS) - September 9Hello?
Welcome, traders.
By "following", you can always get new information quickly.
Please also click "Like".
Have a nice day.
-------------------------------------
(EOSUSD 1W Chart)
If the price is maintained above the 2.8250-4.0849 range, it is expected that the uptrend will continue.
In particular, if the price is maintained above the 6.4053 point, it is expected to create a new wave.
(1D chart)
We need to see if we can sustain the price above the 5.1 point.
If it goes down, you should check to see if it finds support at the 3.6732-4.0849 level.
It is important to be able to break above the resistance zone formed by the 6.4053-8.1435 area.
-------------------------------------
(EOSBTC 1W chart)
We'll have to wait and see if we can climb from the bottom section of 0.0000856-0.0003040.
Specifically, we need to see if we can sustain the price above the 0.0001470 point.
(1D chart)
We need to see if we can find support in the 0.0000997-0.0001113 zone and move above the 0.0001181 point.
If it goes down from the 0.0000997 point, it could touch the 0.0000856 point, so you need to be careful with your trades.
An upward break above the 0.0001470-0.0001690 zone is required to accelerate the uptrend.
------------------------------------------
We recommend that you trade with your average unit price.
This is because, if the price is below your average unit price, whether it is in an uptrend or in a downtrend, there is a high possibility that you will not be able to get a big profit due to the psychological burden.
The center of all trading starts with the average unit price at which you start trading.
If you ignore this, you may be trading in the wrong direction.
Therefore, it is important to find a way to lower the average unit price and adjust the proportion of the investment, ultimately allowing the funds corresponding to the profits to regenerate themselves.
------------------------------------------------------------ -----------------------------------------------------
** All indicators are lagging indicators.
Therefore, it is important to be aware that the indicator moves accordingly with the movement of price and volume.
However, for the sake of convenience, we are talking in reverse for the interpretation of the indicator.
** The wRSI_SR indicator is an indicator created by adding settings and options to the existing Stochastic RSI indicator.
Therefore, the interpretation is the same as the traditional Stochastic RSI indicator. (K, D line -> R, S line)
** The OBV indicator was re-created by applying a formula to the DepthHouse Trading indicator, an indicator disclosed by oh92. (Thanks for this.)
** See support, resistance, and abbreviation points.
** Support or resistance is based on the closing price of the 1D chart.
** All descriptions are for reference only and do not guarantee a profit or loss in investment.
Explanation of abbreviations displayed in the chart
R: A point or section of resistance that requires a response to preserve profits.
S-L: Stop Loss point or section
S: A point or section where you can buy to make a profit as a support point or section.
(Short-term Stop Loss can be said to be a point where profit and loss can be preserved or additional entry can be made through split trading. It is a short-term investment perspective.)
GAP refers to the difference in prices that occurred when the stock market, CME, and BAKKT exchanges were closed because they are not traded 24 hours a day.
G1 : Closing price when closed
G2: Opening price
(Example) Gap (G1-G2)
EOS - Daily ChartSo it happened. my last idea explained why it crashed, you can read details there:
There are two key supports. as you can see on the chart we are on our way to our new resistance area , be VERY careful with your positions.
There are too many sell volumes on the market right now so watch out for more drops. We're still shaking.
I'll keep this chart updated.
Use this chart as your trade setup for now.
Current Market Price: $4.72
Good Luck
Tell me your ideas. Like and Share