EPIC/USDT — Post-Breakout Distribution & Key Decision Levels!
🔎 Chart Summary
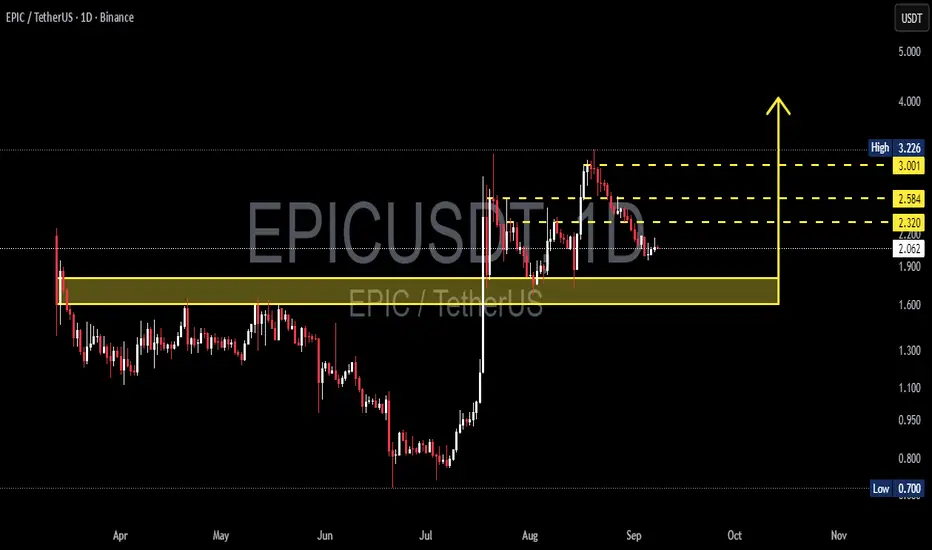
EPIC/USDT is currently in a distribution phase after a strong parabolic rally during mid-July – August. After hitting a local high of 3.22, price started forming lower highs, showing gradual selling pressure, and is now trading around 2.06.
The key battleground lies in the 1.55–1.75 demand zone (yellow box) — this zone will decide whether price consolidates for another leg up, or breaks down for a deeper correction.
---
🔑 Key Technical Levels
Current Price: 2.065
Immediate Resistances: 2.320 → 2.584 → 3.001 → 3.226 (High)
Major Support (Demand Zone): 1.55 – 1.75
Extreme Long-Term Support: 0.700 (historical low)
---
📌 Pattern & Market Structure
Pre-rally phase: Sideways accumulation (March – June) around 1.0–1.7.
July → August: Parabolic breakout with massive impulse.
After the pump: Market entered distribution/sideways range between ~1.9–3.2, with multiple rejections near 3.0+.
Current daily candles show lower highs, indicating weakening bullish momentum.
Overall, the setup resembles a distribution range rather than a clean bullish continuation, leaving the market in a neutral-to-bearish bias unless confirmed otherwise.
---
🟢 Bullish Scenario
Confirmation: Daily close above 2.32 + successful retest as support.
Targets:
TP1: 2.58
TP2: 3.00
TP3: 3.22 (previous high)
Invalidation: Daily close back below 1.95 or breakdown under 1.75.
Reasoning: Breakout above 2.32 signals buyers regaining control, opening room to retest major resistance zones.
---
🔴 Bearish Scenario
Confirmation: Daily close below 1.90, followed by a breakdown of the 1.55–1.75 demand zone.
Targets:
TP1: 1.20–1.10
TP2: 0.70 (in case of a full capitulation)
Invalidation: Price regains 2.32 with strong volume confirmation.
Reasoning: Failure to hold the demand zone confirms distribution phase is over, leading into a markdown phase.
---
📈 Strategy & Risk Management
Use 2.32 (resistance) and 1.75 (demand zone) as decision points.
Wait for confirmed breakout/retest before entering — avoid chasing price.
Risk only 1–2% per trade and size positions accordingly.
Use partial take-profit strategy: lock gains at 2.58, let runners ride to 3.0+.
Always track volume: weak breakouts without volume = high risk of false moves.
---
🧩 Conclusion
EPIC/USDT is at a critical crossroads:
Holding above 1.75 and breaking 2.32 would trigger a bullish continuation towards 2.58–3.00.
Losing the 1.55–1.75 demand zone could drag the market back to 1.20 or even 0.70.
This is a decisive moment for swing traders and mid-term investors to watch closely.
---
#EPIC #EPICUSDT #CryptoAnalysis #Altcoin #SwingTrading #TechnicalAnalysis #CryptoBreakout #PriceAction #SupportResistance
EPICUSD
ERNUSDT / EPICUSDT 5D Analysis ERN / EPIC ~ 5D Analysis
#ERN / #EPIC This is the lowest support for now. Buy if you still have confidence in this coin with a short term target of at least 20%+ from this support.

EPIC New Update (8H)EPIC appears ready for a rejection to the downside and a drop.
Maintaining the supply zone, it could drop further.
The marked demand zone could potentially reject the price back upward again.
Do not enter the position without capital management and stop setting
Comment if you have any questions
thank you

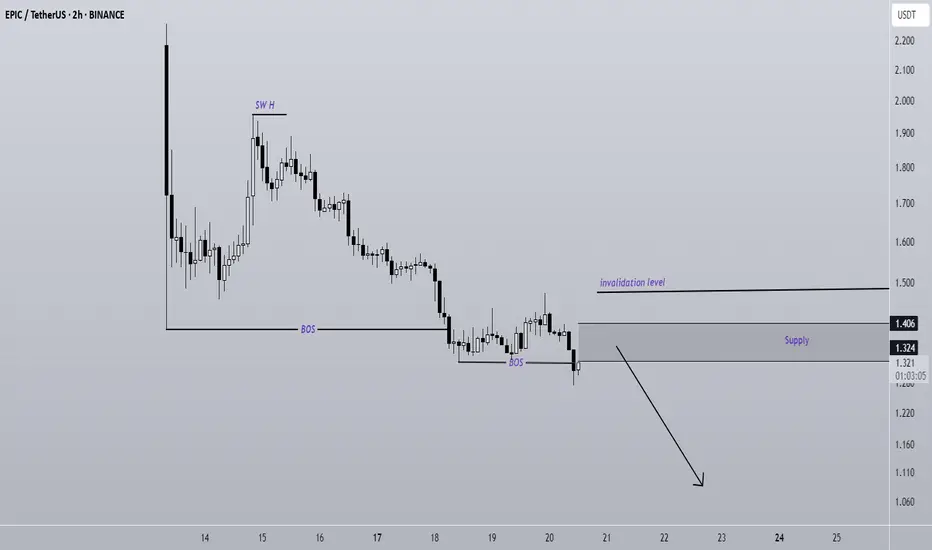
EPIC Is Bearish (2H)It has a bearish structure and is forming a trading kink, which acts as a supply zone. We expect a rejection to the downside from this supply area.
When your profit exceeds 10%, break even and secure some profits.
A daily candle closing above the invalidation level will invalidate this analysis.
A daily candle closing above the invalidation level will invalidate this outlook.
Do not enter the position without capital management and stop setting
Comment if you have any questions
thank you