another BuySide QuickScalp #GBPJPY 📌 Market Insight: {#GBPJPY }
⚠️ Risk Assessment: {High}
🚀 Approach:
Lets see , does it give us another QuickScalp or not ... its More Riskier than Yesterday
#Ash_TheTrader #Forex #GBPJPY #MarketAnalysis #TradingSetup #RiskManagement #GOLD #Scalper #NQ #EURUSD
Es!1

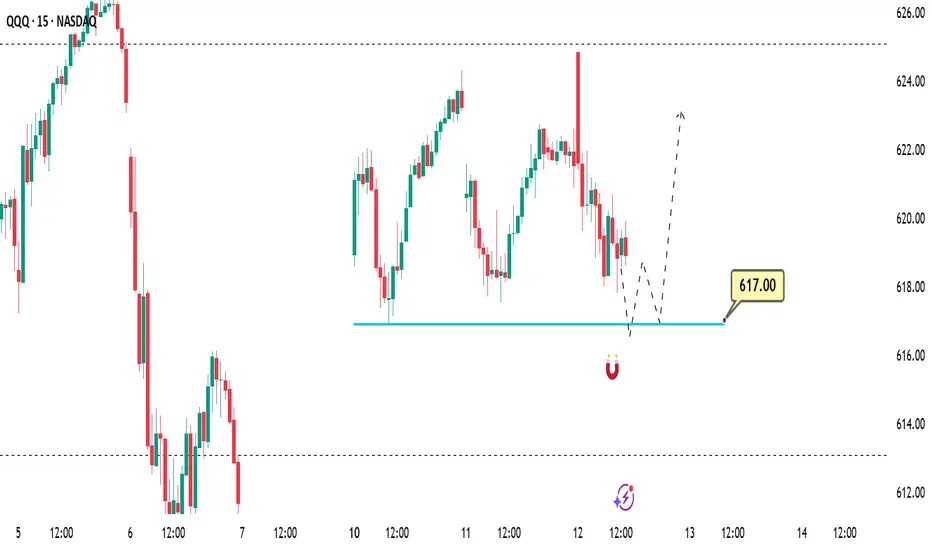
QQQ (NQ/US100) Quick Trade Idea - (12 NOV)📌 Prediction / Game Plan
In my opinion, the price is currently attempting to reprice the gap around the 617 level.
If the price reaches this zone, we may see a rejection-bounce toward 620 first, followed by 625.
I’ll be closely watching the 617 zone for a potential call entry setup.
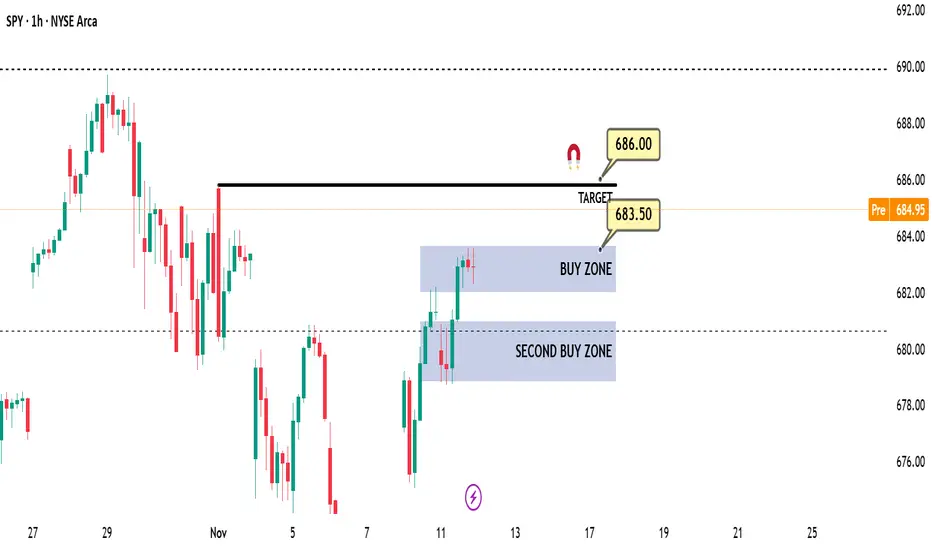
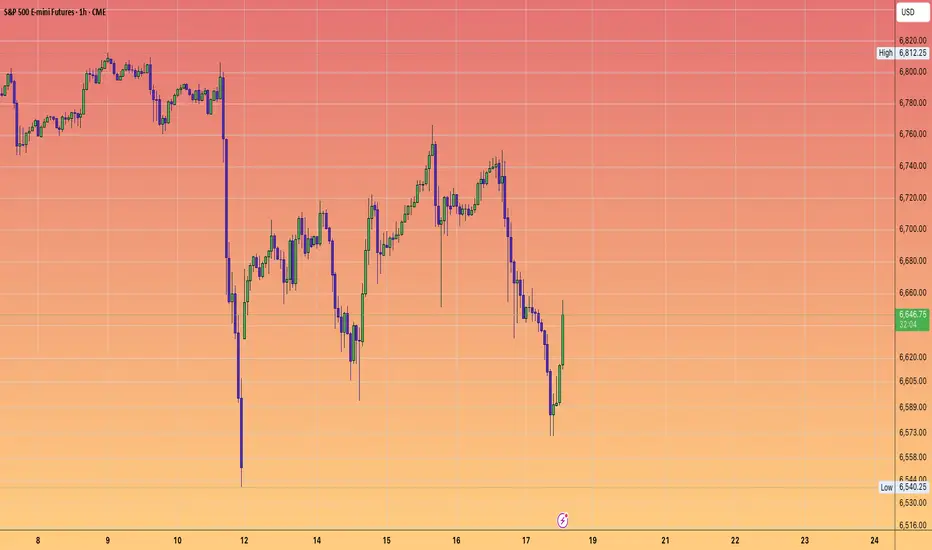
Daily SPY (US500) Outlook - Prediction (12 NOV)Daily SPY (US500) Outlook - Prediction (12 NOV)
📊 Market Sentiment
The market continues to lean bullish following the potential resolution of the U.S. government shutdown, along with the proposed $2,000 incentives for U.S. citizens. These developments could drive stronger inflows into equities and sustain short-term positive sentiment.
📈 Technical Analysis
Price moved higher overnight, likely targeting the 686 level, supported by strong momentum carried over from the Dow Jones (US30).
📌 Game Plan
In my opinion, I will look to buy if the price retraces to the 683.5–682 zone for a potential continuation move toward 686.
However, if we see a strong breakout below 682 and a 4H candle close beneath that level, I plan to exit my position. Another possible bounce could occur around 681, but confirmation would be required before entering such a trade.
💬For detailed insights and broader market context, please check my Substack link in profile.
⚠️ For educational purposes only. This is not financial advice.
a BuySide QuickScalp #GBPJPY 📌 Market Insight: {#GBPJPY }
⚠️ Risk Assessment: {High}
🚀 Approach:
Not a bad Structure , we need momentum first then a nice LTF entry sign .
#Ash_TheTrader #Forex #GBPJPY #MarketAnalysis #TradingSetup #RiskManagement #GOLD #Scalper #NQ #EURUSD

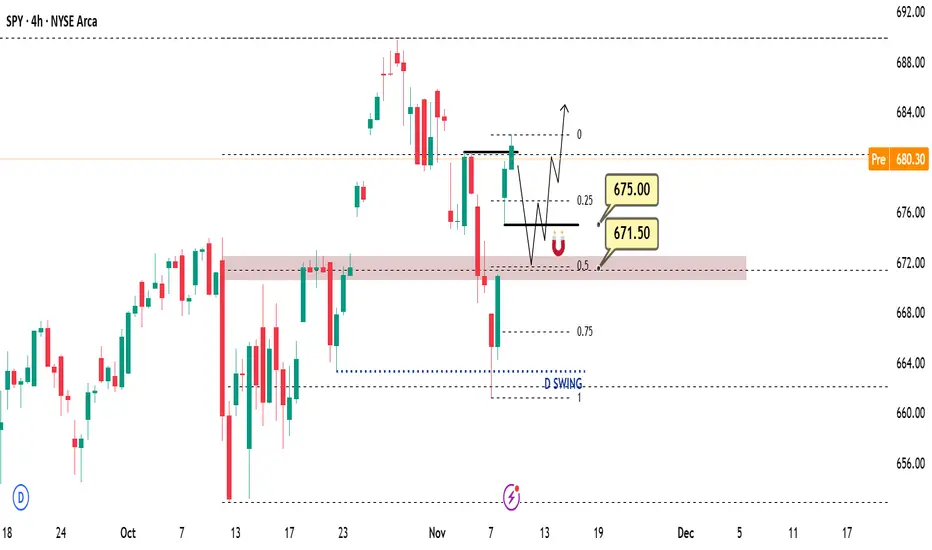
Daily SPY (US500) Outlook - Prediction (11 NOV)Daily SPY (US500) Outlook - Prediction (11 NOV)
📊 Market Sentiment
The market is turning bullish following the potential resolution of the U.S. government shutdown, along with the proposed $2,000 incentives for U.S. citizens. These factors could create strong inflows into equities and improve short-term sentiment.
📈 Technical Analysis
Price moved sharply higher on Monday, reaching the 681 level as expected (see my previous SPY outlook). The 681 level remains a strong resistance zone, and we have already seen a rejection from that area.
📌 Game Plan
In my opinion, the market may turn short-term bearish today. After rejecting 681, the price could target the 675 level and possibly though not necessarily reach 671.5.
My plan is to short the market toward 675 and observe if a bounce occurs. If it does, I will look to buy calls, expecting a move toward new highs around 685.
💬For detailed insights and broader market context, please check my Substack link in profile.
⚠️ For educational purposes only. This is not financial advice.
SPY (S&P 500 ETF) – Game PlanSPY (S&P 500 ETF) – Game Plan
📊 Market Sentiment
On October 29, the FED lowered rates by 25bps as expected. However, Powell’s remarks introduced uncertainty around further cuts in December, emphasizing that future policy will depend on incoming data.
One FED member dissented, preferring no cut this cycle — a notable shift from September’s unanimous decision.
Additionally, ADP Non-Farm Employment Change came at 42K versus 32K expected. It’s slightly higher, but since other macro data are missing due to the U.S. government shutdown, the overall sentiment remains unclear.
For now, sentiment leans bearish, as rate cuts may be delayed into 2026.
📈 Technical Analysis
SPY recently touched the 670 level an important support zone representing the equilibrium of the current daily range and an area with significant liquidity.
However, with bearish macro sentiment, I don’t expect this level to hold for long. The structure suggests that price wants to seek lower liquidity zones.
📌 Game Plan / Expectations
My primary scenario is a short move targeting 663, which aligns with the 0.75 max discount zone. From there, a potential rally toward all-time highs could begin.
Scenario 2: If the 663 level fails to hold, I will look for another bounce opportunity near 657.
Overall, I don’t see this as a start of a bear market — rather a healthy correction within the broader bullish structure. I’ll be positioning for buys once the downside liquidity objectives are met.
💬 For deeper sentiment and strategy insights, subscribe to my Substack — free access available.
⚠️ Disclaimer
This analysis is for educational purposes only and does not constitute financial advice. Always conduct your own research before trading or investing.

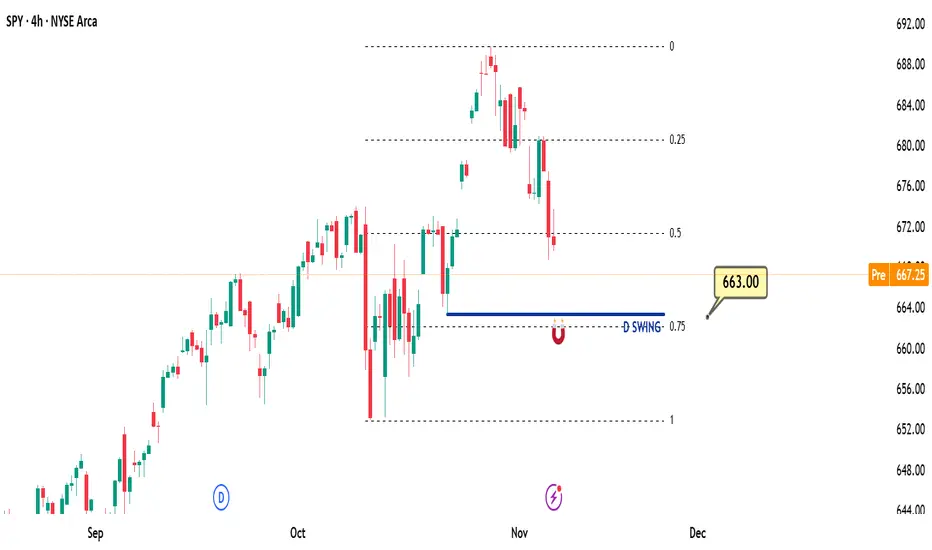
Weekly SPY (US500) Outlook - Prediction (09 NOV)Weekly SPY Outlook - Prediction (09 NOV)
📊 Market Sentiment
Market sentiment remains slightly bearish as expectations for a December rate cut may be pushed into 2026. We have seen some sell-offs, likely due to hedging or profit-taking activity. However, the market experienced a healthy bounce last Friday, as anticipated in my previous Daily SPY Outlook on November 7.
Today, Trump announced that American citizens, excluding high-income individuals, will receive a $2,000 payment. This news could inject additional liquidity into risk assets, similar to what occurred during his first term. In my opinion, this development may create a short-term bullish narrative for the markets.
📈 Technical Analysis
Price retraced throughout the week and reached the 663 level, where it bounced as expected from my November 7 outlook. The 663 zone represents the most discounted range (based on my quarterly range theory, 0.75 fib level), which I consider an optimal buy area. This level also coincides with daily swing liquidity, and the reaction suggests a potential move toward new all-time highs.
📌 Game Plan
I’m considering two possible scenarios for this week:
Scenario 1 (Black Line):
In my opinion, the price now has enough momentum to extend higher and create new all-time highs. Therefore, I’ll be watching for a daily close above the 671 level. If confirmed, I plan to buy SPY calls targeting new highs.
Scenario 2 (Red Line):
If the price fails to close above 671, it may indicate that more accumulation is needed before another upward move. In that case, I’ll look to short (buy puts) toward the 657 level and observe whether we can bounce from there. Should that happen, I’ll then switch to calls and target higher levels.
💬For detailed insights and broader market context, please check my Substack link in profile.
⚠️ For educational purposes only. This is not financial advice.

Daily SPY (US500) Outlook - Prediction (10 NOV)📊 Market Sentiment
Market sentiment remains slightly bearish as expectations for a December rate cut may be postponed into 2026. We have seen some sell-offs, likely due to hedging or profit-taking activity. However, the market experienced a healthy bounce last Friday, as anticipated in my previous Daily SPY Outlook on November 7.
Trump announced that American citizens, excluding high-income individuals, will receive a $2,000 payment. This news could inject additional liquidity into risk assets, similar to what occurred during his first term. In my opinion, this may create a short-term bullish narrative for the markets.
📈 Technical Analysis
The ES market is showing strong pre-market inflows. I think the price may continue seeking higher levels, possibly targeting the 681 zone today.
📌 Game Plan
In my opinion, calls may perform well today. I plan to buy at the market open and take profits around the 681 level.
💬For detailed insights and broader market context, please check my Substack link in profile.
⚠️ For educational purposes only. This is not financial advice.

Daily SPY Outlook - Prediction (07 NOV)Daily SPY Outlook - Prediction (07 NOV)
📊 Market Sentiment
Market sentiment is slightly bearish as expectations for a December rate cut may be delayed into 2026. We have seen some sell-offs, likely due to hedging or profit-taking activity.
📈 Technical Analysis
Price is currently pulling back from the all-time high and moving within the equilibrium zone near the 670 level, which acts as short-term support. This is where I think accumulation may occur.
📌 Game Plan
In my opinion, price could reach the 663 level before showing a potential rebound. Therefore, I plan to stay short-biased toward 663, as puts might perform well today — unless I see a strong 4H candle close after the market open.
💬For detailed insights and broader market context, please check my Substack link in profile.
⚠️ Disclaimer: For educational purposes only. This is not financial advice.
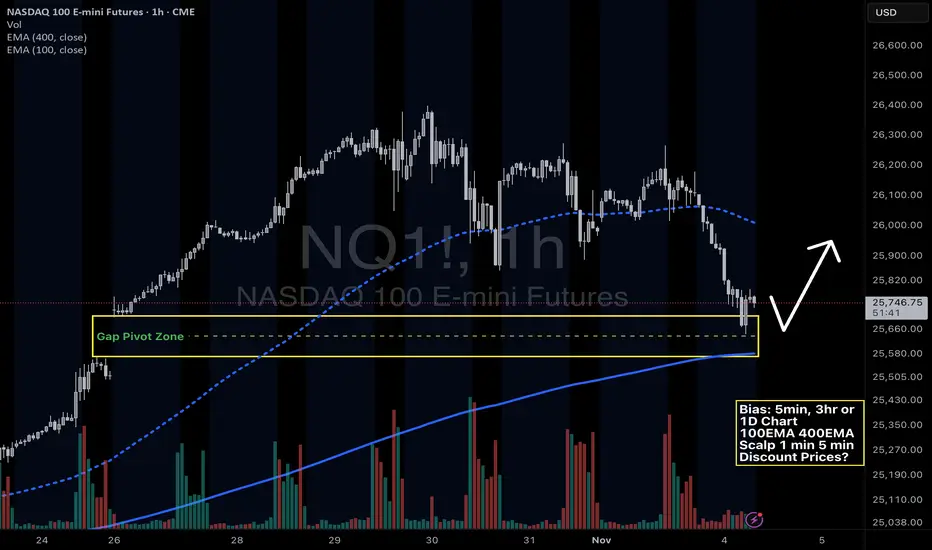
Nasdaq NQ - tapping into previous Gap Pivot ZoneNQ -Nasdaq Futures- pulled all the way back to the previous Gap up zone from October 26, 2025. Also, confluence with the 1 hour 400 EMA. Does this signal a bounce opportunity? Or does this signal that there will be a major news event that will occur? Is the market predictive of real life?
Week 11.03 - 11.07 Prep Last Week :
Last week we opened on a gap above Value and made a push over Edge top where we found our top and larger sellers for the week. Return to above VAL provided selling back into and eventually under the Edge. Holding under the Edge got us under MAs and changed the trend from uptrend to downtrend on 30m and 1h Time Frames, 2hr and 4hr frames only changed into correction without fully changing into downtrend. Holds under the Edge also provided good sells into lower VAH/Value for the gap fill towards end of the week when we got Month End profit taking but we were not able to fill the gap, instead we ran out of Supply Friday Midday and got end of the week short covering which drove price back out Value without filling the gap or staying in Value.
This Week :
So far this week we have again opened over Value and have been balancing between VAH and Edge in Globex, right now Edge again provided good sell back towards VAH and it may seem like it can continue selling but this will be the area to be careful at, at least to start the week as we are starting New Month, New week and it would be best to see what order flow we get, of course it is possible that we just continue lower right away but also this could be an area where we will see more covering above the Gap which can keep price over it and eventually once selling slows down could give another rotation towards/into and possible over the Edge.
As mentioned last week we are currently inside 915 - 875 +/- Intraday Range with 900 - 890 being its mean and price can stay within this range until it accepts under 870 - 65 areas without popping back over 75 then we know we have accepted in lower Intraday Range of 870 - 830 and can continue through its targets which would be 855 - 845 Mean area and down into/towards 830 - 20s. If we do hold this current range we are in then it is still possible that it will bring more buying as buyers like to start getting in once price holds which could still push us up towards/over the Edge and maybe even back towards above VAL, how far over Edge we get would be determined by order flow IF it happens but this will be the spots to be careful on the long side instead of getting excited for new ATH or continuation over previous one even if we take it out. Our bigger sellers will still be lurking over the Edge and closer to above VAL which means if we see a push out we could either see a quick or after consolidation return back under the Edge.
For price to change things back into stability or strength from here we would need a strong push over VAL with Medium/Larger MAs following behind us for support to be able to hold the price in/around new Value to show acceptance in New Hourly Range, unless this happens we have to keep thinking that top is in for now and look for return trips away from it which would make price want to return to previous Value.
If we do get strong selling continuation today/tomorrow through 70 - 65 and keep it under then of course we will go with that and keep targeting the Mean/Gap fill and push under the Mean but unless you see clear selling under 70 - 65 careful looking for too much continuation from here early on, it might take few days to decide what we will do and get ready for a good move into lower Value which maybe happen either from above the Edge or once we hold under it long enough and change trend on 2hr and 4hr Frames.

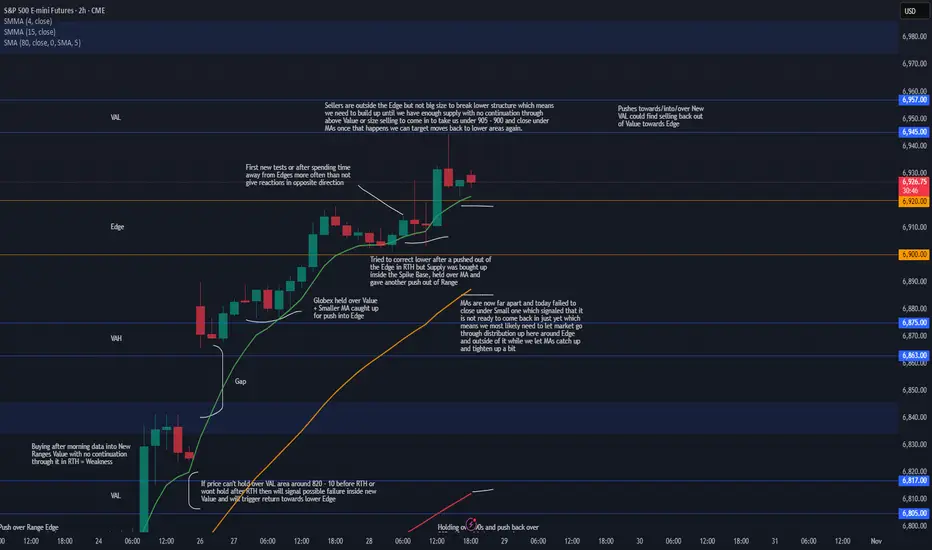
Week 10.26 - 10.31 Updated after GAPSunday Globex gapped up and held over Value which when MAs caught up gave us pushes into upper Edge. Edge areas often act as reversal spots on first tests or after we spend time away from them which it tried to do today but we had good enough buying inside the Spike Base and smaller MA which took in the supply and gave a rotation out of Edge, as we saw price got into VAL and reversed without holding.
There really is no reason for this gap over the weekend and pretty much everyone knows it will be filled but what market showed us today is that we are not ready to come in to start the process for gap fill yet, we have no size operating up here with it being Month End and FOMC tomorrow, FOMC may shake things up BUT we may need to let market balance some up here around Edge and out of it before we can build up the supply and at the same time let MAs catch up to tighten up some to give us a better correction back in.
For now we can see price hold in and out of Edge with pushes towards above VAL and maybe even pushes into/over it BUT careful looking for too much continuation into new Value as we have sellers over the Edge and MAs are far which means any pushes towards/into/over could find their way back out of Value towards lower Edge and eventually once we have enough supply or Volume we can see a push back into/under lower Edge that wont come back out and instead either continue or start holding under to start the process to move for lower targets. For that we would need to be under 905 - 900 area or be able to catch good entry above the Edge and ride it in once market is ready for that.
To see acceptance in this new Range and see more strength we would need to see Medium MA catch up and get over the Edge to provide better support when price pushes into new Value so that it can push in and hold around VAL, until then Small MA acts as Support but it is not something to build big positions on. For now I will be focusing on reversal shorts until market can hold under Hourly MAs and under Intraday VWAP to give better continuation trades lower, I will most likely avoid longs here as they are very choppy and by waiting for good short entries eventually one of them will be the one that will take us back under the Edge and maybe even continue into lower Value so want to be ready for it unless we see strength inside this new Range and good holds over around above VAL.
We have month end coming up and FOMC tomorrow, FOMC is always important but Month end might be more of a mover this time around, being at ATHs so far extended away from MAs on Daily and GAP below we could see profit taking last few days which could give us the pressure to head back under the Edge which would also take stops to add extra pressure for when everyone will be trying to get out so will be watching for that either after FOMC or Thursday/Friday.
SPY and QQQ Macro outlook for 27 to 31 Oct 2025Macro map for 27 to 31 Oct 2025
Concentration of policy and inflation prints means policy expectations and real yields will drive the United States dollar, global equities, bitcoin, and gold. The hinge events are Wednesday FOMC, Thursday US GDP advance and German data, Friday US Core PCE and Chicago PMI. Secondary drivers are BoJ policy guidance and ECB tone, plus BoC.
Watch list
Real ten year yield and the DXY dollar index after FOMC and PCE
EUR front end versus USD front end after ECB and FOMC
VIX around the FOMC window and into PCE
US liquidity windows around 14:00 Eastern on Wednesday and 08:30 Eastern on Thursday and Friday
SPY and QQQ outlook for next week
Set up
US equities enter a policy and growth triad. Wednesday brings the FOMC decision and press conference. Thursday brings the first look at Q3 growth. Friday brings the price index that the Fed emphasizes. The path for real yields and the earnings tone are the first order drivers. Valuation sensitivity is higher in QQQ due to the weight of long duration cash flows. SPY has more cyclicals and defensives and therefore reacts more to growth beats or misses.
Baseline view
A patient Fed message combined with growth that is solid but not hot and inflation that continues to ease supports a grind higher. The market prefers falling real yields with inflation in check. A hawkish shift in the balance of risks, or a hot inflation print that lifts terminal pricing, pressures multiples and skews returns lower. If messages conflict, expect a whipsaw week with heavy rotation.
Scenarios and probabilities
Relief grind higher with QQQ leadership. Probability thirty eight. Triggers are a patient tone on Wednesday, a growth print that shows resilience without overheating, and Core PCE that validates disinflation. Breadth improves and volatility stays contained.
Air pocket lower. Probability thirty two. Triggers are a firmer Core PCE or a hawkish shift in the statement language that pushes real yields up. Valuation compression hits QQQ first and deepest. SPY holds better if staples and energy carry.
Two way chop with wide intraday bars. Probability thirty. Triggers are mixed messages across events and sectors. Expect quick moves around 14:00 Eastern on Wednesday and 08:30 Eastern on Thursday and Friday with mean reversion later in the day.
Key confirms
Watch the ten year real yield and the curve. A drop in real yields with stable breakevens favors a risk appetite day. A jump in real yields with a firm dollar and tight financial conditions favors de‑risking. Also watch VIX and the put call ratio into Wednesday afternoon to gauge dealer positioning.
Risk notes
Large cap earnings that land between FOMC and PCE can add idiosyncratic gaps. Respect prior week high and low as regime markers. If the market opens outside that range and fails to re enter on a retest, trend day odds increase.

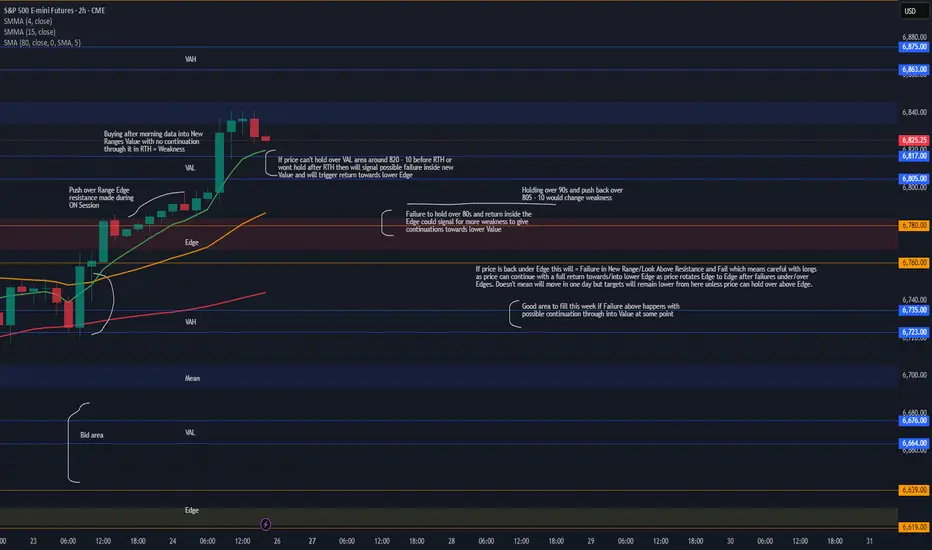
Week 10.26 - 10.31 PrepLast Week :
Last week Sunday Globex opened up inside Value over all the hourly and daily MAs signaling trend change from Fridays ON Flush and RTH Return to Value. Price pushed outside of Value before RTH and we got a push into Edge Resistance area which then gave a two day consolidation that failed back into Value after build up instead of pushing higher.
Hourly/Daily MAs below provided support as we didn't have enough volume to change the trend, instead price again rotated over the MAs and grinded higher into Resistance. Thursday Globex price grinded over resistance on low Volume and held over key area which brought in more buyers with morning Data giving it a push into new Ranges Value where those buyers could sell the product. If we had strength in new range we would have continued with buying into RTH to push price at least over New Ranges Mean but instead we stalled and closed with a rejection away from the Mean to end the Day.
This Week :
Pushes which are made on low volume and in ON hours over/under KEY areas like range tops/bottoms especially if they proved to be good resistance/support areas previously are very likely to fail and return back at least to the initial scene of the crime which looks to be the area under 780s after Thursdays Close.
Of course anything can happen and price may hold/accept in new range and we can start building up inside it to then visit higher targets later but we have been seeing topping patterns in this areas at/under 800s for quite some time and this weak push over the resistance is something to be careful with as market may be ready for correction to our HTF trend to finally start after very long run up with this being sort of blow off top move.
We will have to see how the price will open/hold Sunday Globex but things are pretty straight forward from here, if we cannot hold over/around Smaller Hourly's MAs over 820 - 10 area into or after RTH then this will signal failure in New Value which can trigger next steps to show failure in New Range and from there step by step could trigger a move back for lower MAs, back into/under Edge and eventually we would target lower targets like VAL / Move Into Value, from there we have to be careful because IF we actually go through Trend Change on Hourlys up here this time around then what we could see is holds that may seem like support but with changed trend market could continue giving continuation/holds/continuations lower as Failure in New Range can trigger a return all the way back into Previous Ranges Lower Edge. Does not mean it will or will not happen in one week but will eventually get there as long as price holds under upper Edge.
IF this happens then I would also warn about trend changing for a bit longer than what everyone is used to already as we may target even lower correction areas but that is HTF trend change with HTF Targets I have recently posted Daily Outlook which shows those areas. Careful with slower down days as if trend changes we would still be getting buying/covering on the way down so it may not just sell off quick and instead have more of leak lower days unless there is high volume.
For us to continue with strength and show acceptance in this new range we either need to Open and continue holding/pushing through New Value or at least hold over 780 - 90s on pull back with any dips into it having strong reaction away which would take us back over 805 - 10 area if we don't get that then we need to expect weakness.
S&P 500 Elliott Wave Analysis: Approaching the End of Wave 5I believe the S&P 500 is nearing the end of wave 5, possibly complete already or very soon, based on ES future and SPX charts. The wave 4 low from April 2025 (~5000) should be retested in a 3-wave ABC pullback, targeting late 2026 to early 2027, aligning with Fibonacci time frames. RSI divergence and ending patterns support this. Thoughts?

NQ Shorts IncomingYM approaching 4H imbalance, ES could sweep asian session high and play into previous OB while NQ sweeps london session liq and mitigates asian session OB

SANTA RALLY OR BLACK FRIDAY ..... ZOOMThis is a zoom into the 1hour detail up til the predicted November low (dead cat bounce zone)

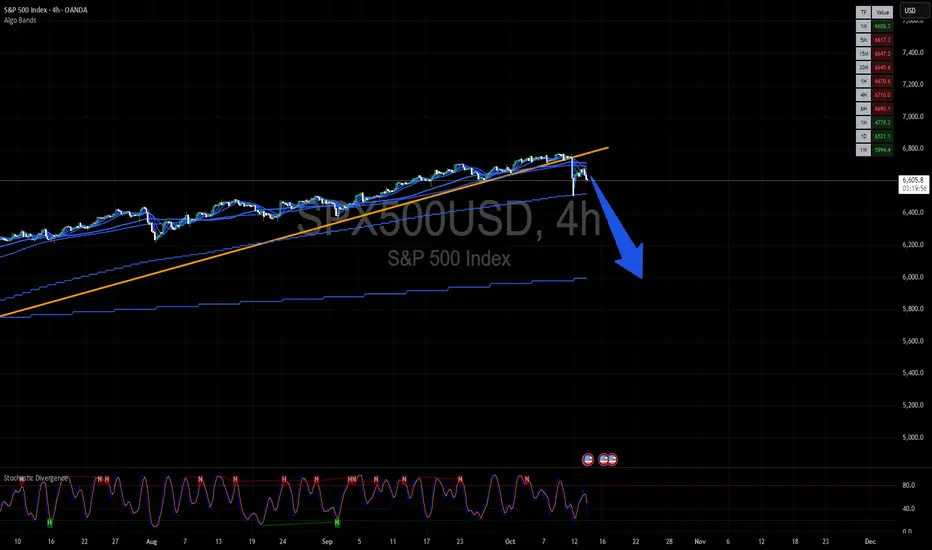
SANTA RALLY OR BLACK FRIDAY ...... THOUGHTS?This is this weekend's whiteboard projections for the next 6months.
This shows a slight reclaim this week but a continuation of lower highs and lower lows.
Then a drop to the bottom of the narrower channel when China tariffs & rare earth restrictions are reflected in earnings guidance as Mag7 reports Q3 results.
Dead cat bounce into Thanksgiving after the market pullback on guidance.
Then only a Trump tweet can give us a Santa Rally, otherwise the other shoe falls and we get a Black Friday/Monday after Thanksgiving.
Followed by a controlled selloff through Q4/Q1 earnings & poor guidance.
Chart forecasts finding a bottom in April 2026.
Please share your charts/forecasts into April 2026. (I am pretty new to this if you can't tell by my charts)

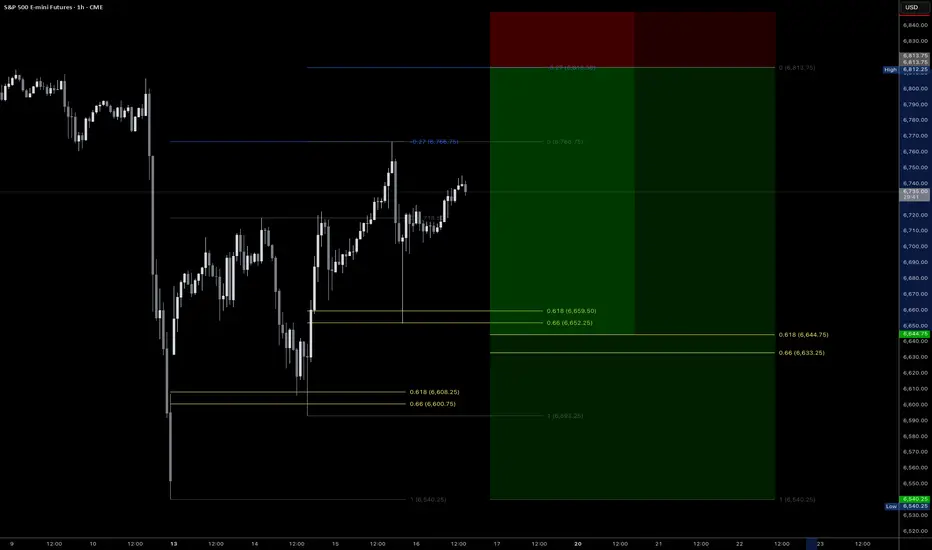
Watch out for 3 drives patternWith the last two retracements to the 0.618 and a perfect touch of the 0.272, we currently have an ideal setup for a potential three drives pattern.
If it hits the final 0.272, it will coincide with CME_MINI:ES1! reaching new all-time highs before reversing for a possible 150-point drop.
Let's see how it evolves.
TRUMP TWEET: High Tariffs on china will NOT remain.I expect a deal with Xi to be announced at the APEC meeting
#ES
#STOCKS
#SPX
$SPX Sell is not over yetHuge down move on Friday on Trump's tweet. And a gap up yesterday and market was sideways. So we are going up from here? It was a super bearish candle on Friday and technical points to further downside.
Indeed, my call at 840pm EST timestamped was followed by a 80 pts sell down. I could be wrong but I see 6000 or so; confluence of support, and even down to 5800 (50 Fib) before a huge rally towards end of year.
ES continuing with my short stratStructure is key when identifying direction. Overall trend isnt as important as you think. When trading reversals I look for large moves in one direction that allows for large moves back, I capitalize off of finding the structure shift and I enter only on discount. Watch your win rate increase when entering deeper into discount.
Trade for Christ

Nq shorts at the momentI took a short position here and am looking to trail it down for a decent RR.
Glory to Christ!
