#ES_F Daily TF Longer Outlook UpdateBack in October we broke down Daily Outlook after we had topping signals and strong trend break. When that was posted we were looking to two possibilities after the trend was broken, we either needed to get back under Smaller MA without reaching the top to show no acceptance in New Range to then proceed with trend change and a slower correction or stay above Smaller MA to push for higher VAH/Edge areas to make this our range for some time and possibly balance between VAH/VAL with pushes out of them finding their way back in.
What ended up happening is we got a push back into MA but closed over it and more buying came in to push and gap us over VAH into Range Top, of course we had no way of knowing that Range Edge would be the top but we pushed into it and showed clear topping/rejection from it.
This time Edge Top rejection was much stronger and got us back under VAH/Smaller MA, flushed VAL with Medium MA which again provided Temp Support and as mentioned we got that balancing action between VAL / VAH with pushes out rotating back in until we broke/closed under Medium MA and got more selling which took us under Range Edge Low, flushed Previous Range VAH and Large MA but as that was first tag of big MA after spending quite some time away it naturally provided buying to get us back in New Range which we showed acceptance in by Previously Tagging the Top which meant once price is back in, it doesn't need much big buying as it just wants to rotate back towards Supply which so happens to be at/over VAH.
Where can we go from here ?
The flush under Edge Low temporarily changed Medium Trend into correction but the bounce didn't let us stay in correction and instead we go that rotation into Supply and are now technically again in Up Trend over MAs.
Yes we can stay in up trend and continue with sideways/strength/inside days that will keep us up Over/Around VAH while we let Smaller/Medium MAs catch up and continue pushing us towards Edge Top and maybe even push us into New Range Above.
But few things we have to consider... We are at the top of Big Big area (under new price level of 7000), We had a huge run this year, We have showed multiple Topping Patterns here around 6800 - 6900 +/- Areas, We have showed good trend breaks and attempts at trend change, We are back in area of Supply where bigger failures/sellers have came in, We are extended from Medium and Small MAs which provide support in New/Untested areas and this time we are extended away into Supply Area not New area.
With all that in mind will we have strong buyers who will come in here and start buying the extension inside Supply ? Or was this extension all momentum buyers who aren't planning to hold us up.
My current bias is if we look at Cost Basis break out area up to our Top, then the Flush to Large MA and back up, to me it looks like one side of a bigger M topping pattern which happens at bigger tops. If that is the case then either Friday or somewhere close we should be marking our Lower High and if buyers from Last Week will not hold this then price will want to head back towards some sort of Support which would be Smaller MA as the first spot which means back under VAH. Something to be careful of is that since now VIX is down, Volume will be down as well with holidays coming which means even if we start moving down it might be more of the same way we got up here last week which was more of Slower Balance(Back and Forth) Up days. Way down could be similar with slower balance down days.
From there Smaller MA and areas under it can Provide Support and keep us in some sort of sideways action around it BUT as long as we keep holding under VAH 860s - and under Edge Top 920s then that will mean Weakness, we would look for a move under VAH that can stay under it even if it consolidates around, then into Mean where Medium MA should be by the time we get there, of course it could happen fast as well but have this feeling that it might be a drag this time around IF it happens.
We already have a week of fresh Supply up here from Last Week and if we again get under Smaller MA and can again change trend under Medium MA then that will bring in more weakness to continue for lower targets back towards VAL which could also provide holds BUT if trend stays in correction and we are to follow through with the M pattern then we will eventually see a move back under Range Edge Low and aim to take out the low we made on the last Flush Nov 21st which would be the M middle which could give us more weakness to take us towards our Correction Areas lower into the Cost Basis. Again if market has topped out and all the large selling for now is done, if this is to happen then careful of forcing for it to happen quick as this can play out over a longer period of time as market may need a longer breather/correction/consolidation before it can start a new stronger trend again.
If we don't end up getting a correction under Medium MAs under VAL/Edge then staying over VAL can keep price in balance with us going back and forth in 6700 - 6900s areas for some time, to not have a correction or prevent price balance and see more strength price would need to let some MAs catch up and push us over Previous High AND be able to stay above it, until then we will be looking at either more Balance or Balance with Weakness which can give us a correction.
Es_f

Week 11.03 - 11.07 Prep Last Week :
Last week we opened on a gap above Value and made a push over Edge top where we found our top and larger sellers for the week. Return to above VAL provided selling back into and eventually under the Edge. Holding under the Edge got us under MAs and changed the trend from uptrend to downtrend on 30m and 1h Time Frames, 2hr and 4hr frames only changed into correction without fully changing into downtrend. Holds under the Edge also provided good sells into lower VAH/Value for the gap fill towards end of the week when we got Month End profit taking but we were not able to fill the gap, instead we ran out of Supply Friday Midday and got end of the week short covering which drove price back out Value without filling the gap or staying in Value.
This Week :
So far this week we have again opened over Value and have been balancing between VAH and Edge in Globex, right now Edge again provided good sell back towards VAH and it may seem like it can continue selling but this will be the area to be careful at, at least to start the week as we are starting New Month, New week and it would be best to see what order flow we get, of course it is possible that we just continue lower right away but also this could be an area where we will see more covering above the Gap which can keep price over it and eventually once selling slows down could give another rotation towards/into and possible over the Edge.
As mentioned last week we are currently inside 915 - 875 +/- Intraday Range with 900 - 890 being its mean and price can stay within this range until it accepts under 870 - 65 areas without popping back over 75 then we know we have accepted in lower Intraday Range of 870 - 830 and can continue through its targets which would be 855 - 845 Mean area and down into/towards 830 - 20s. If we do hold this current range we are in then it is still possible that it will bring more buying as buyers like to start getting in once price holds which could still push us up towards/over the Edge and maybe even back towards above VAL, how far over Edge we get would be determined by order flow IF it happens but this will be the spots to be careful on the long side instead of getting excited for new ATH or continuation over previous one even if we take it out. Our bigger sellers will still be lurking over the Edge and closer to above VAL which means if we see a push out we could either see a quick or after consolidation return back under the Edge.
For price to change things back into stability or strength from here we would need a strong push over VAL with Medium/Larger MAs following behind us for support to be able to hold the price in/around new Value to show acceptance in New Hourly Range, unless this happens we have to keep thinking that top is in for now and look for return trips away from it which would make price want to return to previous Value.
If we do get strong selling continuation today/tomorrow through 70 - 65 and keep it under then of course we will go with that and keep targeting the Mean/Gap fill and push under the Mean but unless you see clear selling under 70 - 65 careful looking for too much continuation from here early on, it might take few days to decide what we will do and get ready for a good move into lower Value which maybe happen either from above the Edge or once we hold under it long enough and change trend on 2hr and 4hr Frames.

S&P 500 INDEX | Institutional Technical Analysis Masterpiece🔥 US500 S&P 500 INDEX | Institutional Technical Analysis Masterpiece | 6,843.7 🔥
📈 ELITE MULTI-TIMEFRAME BREAKDOWN | NOVEMBER 3-7, 2025 TRADING ROADMAP 📈
Current Level: 6,843.7 | Analysis Date: November 1, 2025, 00:54 UTC+4
Hello, TradingView community! 👋 The S&P 500 has been on an absolute tear, closing the week at a staggering 6,843.7 . The big question on everyone's mind is: Are we witnessing a final euphoric push before a correction, or is this simply a pause before the next leg up? This week, from November 3rd to 7th, will be critical.
Let's break down the multi-timeframe picture, blending classic theories with modern indicators to build a comprehensive trading plan for both intraday and swing traders. 🧠
═══════════════════════════════════════════════════════════════════
🎯 MARKET INTELLIGENCE EXECUTIVE SUMMARY
The S&P 500 stands at 6,843.7 , navigating a historic technical confluence zone that will determine the market's trajectory through year-end 2025. Our algorithmic and classical analysis fusion reveals bullish continuation potential with measured risk parameters. This week presents asymmetric opportunities as institutional positioning, technical patterns, and macro catalysts align for potentially explosive moves.
Critical Support Infrastructure: 🛡️
Immediate Floor: 6,820 - 6,830 (Algorithmic bid zone)
Secondary Base: 6,800 - 6,810 (Institutional accumulation)
Major Support: 6,750 - 6,770 (Weekly pivot nexus)
Ultimate Defense: 6,700 - 6,720 (Psychological fortress)
Resistance & Target Architecture: 🎯
First Ceiling: 6,860 - 6,870 (Intraday supply)
Secondary Wall: 6,900 - 6,910 (Round number magnet)
Breakout Zone: 6,950 - 6,970 (Pattern objective)
Major Extension: 7,000 - 7,020 (Psychological milestone)
═══════════════════════════════════════════════════════════════════
📊 WEEKLY TIMEFRAME (1W) - MACRO MARKET STRUCTURE
Elliott Wave Grand Architecture: 🌊
We're positioned in Minor Wave 3 of Intermediate Wave (5) within the secular bull market. The impulsive structure projects targets at 7,100-7,200 based on Fibonacci extensions. Critical validation: maintaining above 6,720 preserves the bullish count.
Primary Count: Wave 3 of (5) targeting 7,100
Alternative: Wave B of expanded flat, risk below 6,650
Invalidation: Weekly close below 6,600
Time projection: Completion by late November
Wyckoff Accumulation Schematic: 📚
Phase D - Markup Beginning
- Preliminary Supply (PSY): 6,920 tested
- Buying Climax (BC): 6,950 rejection
- Automatic Reaction (AR): 6,750 hold
- Last Point of Support (LPS): Current 6,843
- Sign of Strength (SOS): Pending above 6,870
Ichimoku Cloud Mastery: ☁️
Tenkan-sen: 6,815 (9-period support)
Kijun-sen: 6,780 (26-period base)
Senkou A: 6,850 (cloud top resistance)
Senkou B: 6,720 (cloud bottom support)
Chikou Span: Clear above price (bullish)
Cloud status: Thick and ascending
Advanced Harmonic Patterns: 🦋
Developing Bullish Gartley with precision ratios:
- XA leg: 6,500 to 6,950 (450 points)
- AB retracement: 0.618 at 6,672 ✅
- BC extension: Testing 0.786 at 6,845 (current)
- D completion: 0.786 XA at 6,850-6,870
- Target upon completion: 7,050-7,100
═══════════════════════════════════════════════════════════════════
📉 DAILY TIMEFRAME (1D) - SWING TRADING COMMAND CENTER
Japanese Candlestick Mastery: 🕯️
Yesterday's Doji Star at resistance signals equilibrium. Today's action critical:
- Close above 6,860 = Three White Soldiers continuation
- Close below 6,820 = Evening Star reversal warning
- Current bias: Neutral-bullish pending confirmation
Master Pattern Recognition:
Cup and Handle formation nearing completion:
- Cup low: 6,650 (October)
- Cup high: 6,920 (Recent peak)
- Handle forming: 6,820-6,870 range
- Breakout target: 7,190 (270-point measured move)
- Volume requirement: 25% above 20-day average
Bollinger Bands Configuration: 📊
Upper Band: 6,875 (immediate resistance)
Middle Band (20-SMA): 6,810 (dynamic support)
Lower Band: 6,745 (oversold boundary)
Band Width: Expanding (volatility increasing)
%B Indicator: 0.68 (upper half, bullish bias)
RSI Multi-Timeframe Analysis:
Daily RSI: 59 (room for upside)
Hidden bullish divergence vs price action
Support trend line from September intact
Resistance at 70 provides 11-point runway
═══════════════════════════════════════════════════════════════════
⚡ 4-HOUR TIMEFRAME (4H) - TACTICAL EXECUTION FRAMEWORK
Gann Theory Application: 📐
Current Gann Angles:
1x1: 6,825 (45-degree support)
2x1: 6,850 (current resistance)
1x2: 6,790 (major support)
Square of 9: 6,889 (next target)
Gann Box: 6,750-6,950 range
Time cycles: Nov 5 critical date
Dow Theory Confirmation Checklist: ✅
Primary Trend: Bullish (new highs achieved)
Secondary Trend: Consolidation/Correction
Volume Confirmation: Accumulation on dips
Breadth Analysis: 65% stocks above 50-DMA
Sector Rotation: Technology leading (bullish)
Transportation Confirmation: Pending
Moving Average Symphony:
- EMA 8: 6,838 (ultra-short support)
- EMA 21: 6,825 (short-term support)
- EMA 50: 6,810 (medium support)
- SMA 100: 6,785 (strong support)
- SMA 200: 6,750 (major trend support)
Pattern Alert: 🚨
Ascending Triangle resolution imminent:
- Horizontal resistance: 6,860-6,870
- Rising support: 6,820-6,830
- Apex convergence: November 4
- Breakout projection: 6,950+
═══════════════════════════════════════════════════════════════════
🎪 1-HOUR TIMEFRAME (1H) - PRECISION TRADING LABORATORY
Micro Pattern Development: 🔬
Double Bottom forming at 6,825:
- First bottom: 6,823 (10:00 UTC)
- Second bottom: 6,826 (14:00 UTC)
- Neckline resistance: 6,855
- Pattern target: 6,885 (30-point move)
VWAP Trading Matrix:
Daily VWAP: 6,841
Weekly VWAP: 6,825
Monthly VWAP: 6,795
Upper Band 1: 6,858 (first resistance)
Upper Band 2: 6,875 (second resistance)
Lower Band 1: 6,824 (first support)
Lower Band 2: 6,807 (second support)
Support & Resistance Precision Grid:
R4: 6,890 (Major resistance)
R3: 6,875 (Daily upper BB)
R2: 6,860 (Pattern neckline)
R1: 6,850 (Immediate resistance)
PIVOT: 6,843.7 (Current Price)
S1: 6,835 (Micro support)
S2: 6,825 (VWAP support)
S3: 6,810 (Major support)
S4: 6,795 (Monthly VWAP)
═══════════════════════════════════════════════════════════════════
⚡ 30-MINUTE TIMEFRAME (30M) - SCALPING COMMAND POST
Microstructure Analysis: 🎯
Bull Flag pattern developing:
- Pole: 6,810 to 6,855 (45 points)
- Flag consolidation: 6,835-6,845
- Breakout trigger: 6,846
- Target: 6,890 (45-point measured move)
Volume Profile Intelligence: 📊
POC (Point of Control): 6,837
VAH (Value Area High): 6,848
VAL (Value Area Low): 6,828
HVN (High Volume Node): 6,835-6,840
LVN (Low Volume Node): 6,855-6,860 (breakout zone)
Scalping Execution Zones:
Buy Zones:
• Zone 1: 6,835-6,838 (POC test)
• Zone 2: 6,828-6,831 (VAL support)
• Zone 3: 6,820-6,823 (Strong bid)
Sell Zones:
• Zone 1: 6,848-6,851 (VAH resistance)
• Zone 2: 6,858-6,861 (Supply zone)
• Zone 3: 6,868-6,871 (Major resistance)
═══════════════════════════════════════════════════════════════════
🏃 15-MINUTE & 5-MINUTE HYPERSPEED SCALPING
15-Minute Lightning Analysis: ⚡
Wedge pattern near apex:
- Upper trendline: 6,847
- Lower trendline: 6,839
- Breakout direction: 70% probability upward
- Quick target: 6,855 (+12 points)
- Stop: 6,835 (-8 points)
5-Minute Algorithmic Signals:
Long Entry Conditions:
RSI(5) < 30 AND Price > VWAP = BUY
MACD crossover AND Volume > Average = BUY
Price touches EMA(20) from above = BUY
Short Entry Conditions:
RSI(5) > 70 AND Price < VWAP = SELL
MACD crossunder AND High volume = SELL
Price rejected at resistance = SELL
Exit Rules:
Take profit: 8-10 points
Stop loss: 5-6 points
Time stop: 15 minutes max hold
Session Volatility Map: 🕐
Asian: 10-15 point range (quiet)
London Open: 20-30 point expansion
NY Premarket: 25-35 point volatility
NY Open: 40-50 point moves
NY Afternoon: 20-30 point consolidation
═══════════════════════════════════════════════════════════════════
📅 WEEKLY STRATEGIC FORECAST (NOVEMBER 3-7, 2025)
Monday, November 3: 🚀
Opening gap probability: 60% bullish
Strategy: Buy weakness to 6,830, target 6,870
Key levels: Support 6,820, Resistance 6,880
Expected range: 50 points
Tuesday, November 4: 🗳️
Election Day - Extreme volatility expected
Strategy: Straddle/strangle positions
Potential range: 6,750-6,920 (170 points!)
VIX spike likely above 25
Wednesday, November 5: 💥
Post-election directional resolution
Strategy: Trade the breakout aggressively
Bullish above 6,880 → Target 6,950
Bearish below 6,800 → Target 6,720
Thursday, November 6: 📊
FOMC minutes and economic data
Strategy: Fade first move, trade reversal
Expected consolidation: 6,850-6,900
Options gamma concentration: 6,875
Friday, November 7: 🎯
Weekly options expiration dynamics
Strategy: Theta decay trades around 6,850
Pin risk: 6,850 strike concentration
Weekly close above 6,870 = Bullish next week
═══════════════════════════════════════════════════════════════════
⚖️ INSTITUTIONAL RISK MANAGEMENT PROTOCOLS
Intraday Risk Framework: 🛡️
Position sizing: 0.5-1% risk per trade
Risk-Reward: Minimum 1:2.5 ratio
Daily loss limit: -2% portfolio max
Consecutive losses: 3 max, then pause
Profit trailing: 60% of maximum gain
Breakeven stop: At 10-point profit
Scaling strategy: 3 entries maximum
Swing Position Architecture: 💼
Core position: 50% at 6,820-6,830
Add-on levels: 25% at 6,800, 25% at 6,780
Stop loss: Below 6,750 (all positions)
Target 1: 6,900 (25% exit)
Target 2: 6,950 (35% exit)
Target 3: 7,000 (25% exit)
Runner: 7,050+ (15% hold)
═══════════════════════════════════════════════════════════════════
🔴 RISK SCENARIOS & CIRCUIT BREAKERS
Bearish Invalidation Levels: 🐻
15-min close below 6,835 = Micro caution
Hourly close below 6,820 = Intraday bearish
4H close below 6,800 = Swing bearish shift
Daily close below 6,750 = Trend reversal risk
Weekly close below 6,700 = Major bear signal
Tail Risk Considerations: 🦢
• Geopolitical shock (100+ point gap risk)
• Fed policy surprise (2-3% moves)
• Tech earnings disasters (sector rotation)
• Credit event contagion (systemic risk)
• AI bubble concerns (valuation reset)
═══════════════════════════════════════════════════════════════════
💎 ELITE CONFLUENCE TRADING ZONES
Premium Buy Zone: ✅
6,820-6,830
(Multi-timeframe support + Fibonacci 61.8% + VWAP + Moving average cluster)
Optimal Sell Zone: ❌
6,870-6,880
(Resistance confluence + Pattern targets + Round number + Options barrier)
Breakout Trigger: 🚀
6,870-6,875
(Triangle apex + Bollinger Band + Volume breakout zone)
═══════════════════════════════════════════════════════════════════
🏆 MASTER TRADER'S FINAL VERDICT
The S&P 500 at 6,843.7 presents a high-conviction bullish opportunity with exceptional risk-reward dynamics. Technical confluence across multiple timeframes, combined with constructive market internals and seasonal factors, supports upside continuation toward 6,900-6,950 initially, with 7,000+ potential.
Top 3 Highest Probability Trades: 🎯
Swing Long: 6,820-6,830 → Target: 6,950 (RR 1:4)
Breakout Long: Above 6,870 → Target: 6,920 (RR 1:3)
Scalp Long: VWAP 6,841 → Target: 6,855 (RR 1:2.5)
Trading Wisdom: 🧠
Position for probability, not possibility. Size for survival, not home runs. The best traders are risk managers who happen to trade.
"Markets can remain irrational longer than you can remain solvent. Trade the chart, not the opinion!" 💡
═══════════════════════════════════════════════════════════════════
📍 ACTIONABLE INTELLIGENCE SUMMARY
Bull market intact above 6,750. Accumulate dips toward 6,820. Target 7,000 by month-end. Risk management is paramount during election week volatility.
Trade with discipline. Prosper with patience. 💰
═══════════════════════════════════════════════════════════════════
#SPX #SP500 #US500 #TechnicalAnalysis #Trading #StockMarket #Indices #DayTrading #SwingTrading #ElliottWave #Wyckoff #HarmonicPatterns #OptionsTrading #VIX #MarketStructure #OrderFlow #InstitutionalTrading #AlgorithmicTrading #TradingView #MarketForecast #SPY #ES_F
🔔 Follow for Institutional-Grade Analysis | Precision • Discipline • Profits 📊
Disclaimer: This analysis is educational only. Trading carries substantial risk of loss. Past performance does not guarantee future results. Always conduct independent research and employ proper risk management.

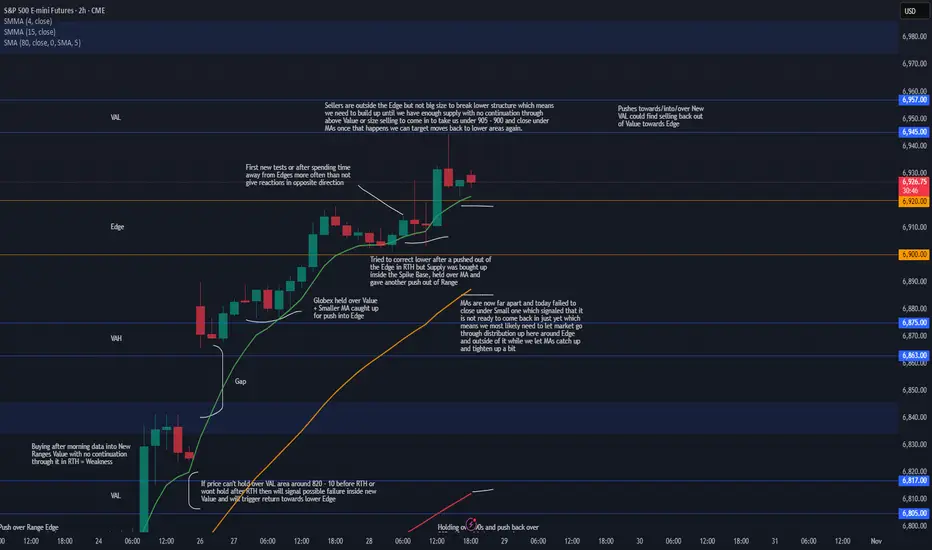
Week 10.26 - 10.31 Updated after GAPSunday Globex gapped up and held over Value which when MAs caught up gave us pushes into upper Edge. Edge areas often act as reversal spots on first tests or after we spend time away from them which it tried to do today but we had good enough buying inside the Spike Base and smaller MA which took in the supply and gave a rotation out of Edge, as we saw price got into VAL and reversed without holding.
There really is no reason for this gap over the weekend and pretty much everyone knows it will be filled but what market showed us today is that we are not ready to come in to start the process for gap fill yet, we have no size operating up here with it being Month End and FOMC tomorrow, FOMC may shake things up BUT we may need to let market balance some up here around Edge and out of it before we can build up the supply and at the same time let MAs catch up to tighten up some to give us a better correction back in.
For now we can see price hold in and out of Edge with pushes towards above VAL and maybe even pushes into/over it BUT careful looking for too much continuation into new Value as we have sellers over the Edge and MAs are far which means any pushes towards/into/over could find their way back out of Value towards lower Edge and eventually once we have enough supply or Volume we can see a push back into/under lower Edge that wont come back out and instead either continue or start holding under to start the process to move for lower targets. For that we would need to be under 905 - 900 area or be able to catch good entry above the Edge and ride it in once market is ready for that.
To see acceptance in this new Range and see more strength we would need to see Medium MA catch up and get over the Edge to provide better support when price pushes into new Value so that it can push in and hold around VAL, until then Small MA acts as Support but it is not something to build big positions on. For now I will be focusing on reversal shorts until market can hold under Hourly MAs and under Intraday VWAP to give better continuation trades lower, I will most likely avoid longs here as they are very choppy and by waiting for good short entries eventually one of them will be the one that will take us back under the Edge and maybe even continue into lower Value so want to be ready for it unless we see strength inside this new Range and good holds over around above VAL.
We have month end coming up and FOMC tomorrow, FOMC is always important but Month end might be more of a mover this time around, being at ATHs so far extended away from MAs on Daily and GAP below we could see profit taking last few days which could give us the pressure to head back under the Edge which would also take stops to add extra pressure for when everyone will be trying to get out so will be watching for that either after FOMC or Thursday/Friday.
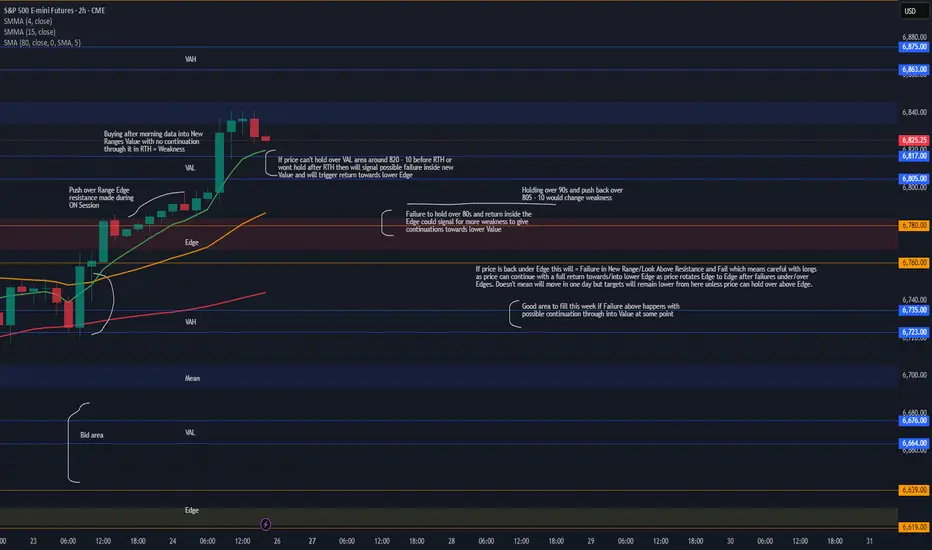
Week 10.26 - 10.31 PrepLast Week :
Last week Sunday Globex opened up inside Value over all the hourly and daily MAs signaling trend change from Fridays ON Flush and RTH Return to Value. Price pushed outside of Value before RTH and we got a push into Edge Resistance area which then gave a two day consolidation that failed back into Value after build up instead of pushing higher.
Hourly/Daily MAs below provided support as we didn't have enough volume to change the trend, instead price again rotated over the MAs and grinded higher into Resistance. Thursday Globex price grinded over resistance on low Volume and held over key area which brought in more buyers with morning Data giving it a push into new Ranges Value where those buyers could sell the product. If we had strength in new range we would have continued with buying into RTH to push price at least over New Ranges Mean but instead we stalled and closed with a rejection away from the Mean to end the Day.
This Week :
Pushes which are made on low volume and in ON hours over/under KEY areas like range tops/bottoms especially if they proved to be good resistance/support areas previously are very likely to fail and return back at least to the initial scene of the crime which looks to be the area under 780s after Thursdays Close.
Of course anything can happen and price may hold/accept in new range and we can start building up inside it to then visit higher targets later but we have been seeing topping patterns in this areas at/under 800s for quite some time and this weak push over the resistance is something to be careful with as market may be ready for correction to our HTF trend to finally start after very long run up with this being sort of blow off top move.
We will have to see how the price will open/hold Sunday Globex but things are pretty straight forward from here, if we cannot hold over/around Smaller Hourly's MAs over 820 - 10 area into or after RTH then this will signal failure in New Value which can trigger next steps to show failure in New Range and from there step by step could trigger a move back for lower MAs, back into/under Edge and eventually we would target lower targets like VAL / Move Into Value, from there we have to be careful because IF we actually go through Trend Change on Hourlys up here this time around then what we could see is holds that may seem like support but with changed trend market could continue giving continuation/holds/continuations lower as Failure in New Range can trigger a return all the way back into Previous Ranges Lower Edge. Does not mean it will or will not happen in one week but will eventually get there as long as price holds under upper Edge.
IF this happens then I would also warn about trend changing for a bit longer than what everyone is used to already as we may target even lower correction areas but that is HTF trend change with HTF Targets I have recently posted Daily Outlook which shows those areas. Careful with slower down days as if trend changes we would still be getting buying/covering on the way down so it may not just sell off quick and instead have more of leak lower days unless there is high volume.
For us to continue with strength and show acceptance in this new range we either need to Open and continue holding/pushing through New Value or at least hold over 780 - 90s on pull back with any dips into it having strong reaction away which would take us back over 805 - 10 area if we don't get that then we need to expect weakness.
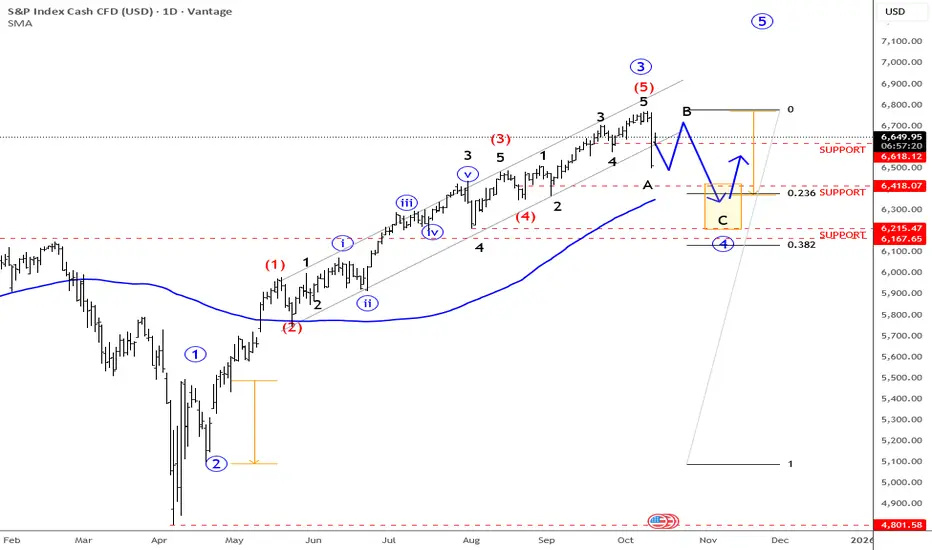
SP500: Breaks Out Of Channel, Steps Into Wave Four I hope you had a nice weekend despite that nasty turn lower on stocks we saw on Friday. As you know, the move came after Trump threatened to impose new tariffs on China, following China’s own restrictions and tighter export controls on rare earth metals, which are crucial for the tech sector. We’ve seen this story before back in April, and if tariffs come back into focus again, traders will likely react with fear — so it’s not a surprise we saw such a strong drop in stocks on Friday.
Normally, markets are most sensitive when this kind of news first hits, and then they tend to stabilize afterward. What’s interesting, though, is that despite the strong sell-off in stocks, the dollar index didn’t show the kind of sharp upside reaction you’d usually expect. So I’m wondering if stocks can find some support, but seems like this can be only wave B rally, since we are in the middle of wave four retracement. Keep in mind there is an open gap lower on futures.
Big supports is at 6400 and 6200.
Grega
Day 42 — Trading Only S&P Futures | +$821 While SickDay 42 of Trading Only S&P Futures is wrapped up with +$821 across all accounts.
Even while battling the flu, I stuck to the process: waited for price to hit MOB, took the clean play, and locked in early. The rest of the day was more about protecting focus than chasing trades.
🔑 Key Levels for Tomorrow
Above 6745 = Stay Bullish
Below 6715 = Flip Bearish
📰 News Highlights
S&P 500 closes above 6,700 on bets of limited shutdown impact

Day 35 — Trading Only S&P Futures | SPX Hits RecordDay 35 of Trading Only S&P Futures is complete!
Today was one of the smoother days. We opened with a bullish structure signal and a clean backtest near the MOB. From there, the market ripped higher. I didn’t catch the full move but I did nail the initial push, which gave me space to step away for most of the day.
Later in the afternoon, I tried shorting with a tight stop and got clipped. Reentered closer to 6755 resistance, and that short worked out well, closing the day +$849.90.
🔑 Key Levels for Tomorrow
Above 6705 = Remain Bullish
Below 6690 = Flip Bearish
📰 News Highlights
The S&P 500 just ended at a new record for the 28th time this year.

Day 30 — Trading Only S&P Futures | One-Month MarkDay 30 of Trading Only S&P Futures is in the books!
I started the day a little rough, down -100 from an overnight trade, but patience paid off. Watching NQ DD buy signals kept me from forcing shorts early, and SPX gamma levels showed 6620 as the top. Once we hit it, I shorted and played the range for steady gains, finishing with a clean MOB bounce for +196.94.
Big milestone here — 30 straight days of trading only the S&P Futures. The consistency is starting to show, and the lessons are stacking up fast.
📰 News Highlights
VIX jumped 6% while the market gained 0.5% — an odd divergence worth watching.
🔑 Key Levels for Tomorrow=
Above 6645 = Remain Bullish
Below 6635 = Flip Bearish

Day 29 — Trading Only S&P Futures | From Red to GreenWelcome to Day 29 of Trading Only S&P Futures!
The day started bearish, and my early shorts worked — until the market began spiking up and flipping bullish. Some of those positions hit stop-loss, so I stepped back and waited.
At 6605 gamma resistance, I shorted again with conviction and rode the reversal back into positive territory, finishing the day at +91.81.
This was a good reminder to not overstay trades when conditions are choppy, and to wait for the high-probability levels to do the heavy lifting.
📰 News Highlights
U.S. SEPTEMBER MICHIGAN 5-YEAR EXPECTED INFLATION RISES 3.9%; EST. 3.4%; PREV. 3.5%
🔑 Key Levels for Tomorrow
Above 6565 = Remain Bullish
Below 6535 = Flip Bearish

Day 27 — Trading Only S&P Futures | 20pt Win & Bottom CatchWelcome to Day 27 of Trading Only S&P Futures!
Started the day red due to overnight trades, but once the session opened, everything lined up perfectly. I waited for resistance after spotting multiple X7 sell signals, shorted the top, and caught a 20-point move down to MOB. From there, I flipped long, and later caught the market bottom with the help of Bia’s analysis.
The result? A smooth +385 day — clean reads, clean execution.
📰 News Highlights
S&P 500, NASDAQ eke out record closing highs after tame PPI inflation data
🔑 Key Levels for Tomorrow
Above 6515 = Remain Bullish
Below 6500 = Flip Bearish

Day 25 — Trading Only S&P Futures | Gold’s Rally Raises FlagsWelcome to Day 25 of Trading Only S&P Futures!
Today started strong with an overnight short and continued by taking longs at major support levels. With the FOMC blackout period in effect, I leaned bullish but stayed selective, waiting for the 5-min MOB to hit before entering. That trade paid off and I wrapped the day at +264.83.
Still, there’s a cautionary note: gold just hit a record high above $3,633/oz, and that could be signaling underlying stress in the markets. Something to keep an eye on as we move forward.
🔑 Key Levels for Tomorrow
Above 6480 = Remain Bullish
Below 6465 = Flip Bearish
📰 News Highlights
SPOT GOLD EXTENDS GAINS, LAST UP 1.3% TO HIT A RECORD HIGH OF $3,633.65/OZ

08/1/25 Trade Journal, and ES_F Stock Market analysis EOD accountability report: +440
Sleep: 6 hours
Overall health: Good
VX Algo System Signals from (9:30am to 2pm)
— 9:30 AM Market Structure flipped bearish on VX Algo X3!
— 10:12 AM VXAlgo ES X1 Buy signal
— 10:20 AM VXAlgo NQ X1 Buy Signal
—12:30 PM Market Structure flipped bullish on VX Algo X3!
— 1:00 PM Market Structure flipped bearish on VX Algo X3!
— 1:50 PM VXAlgo ES X1 Buy signal,
— 3:00 PM Market Structure flipped bullish on VX Algo X3!**
What’s are some news or takeaway from today? and What major news or event impacted the market today?
Market range expanded a lot today, we dropped over 100 points today and sometimes i forget to adjust my bracket orders to go for 10 -15 points take profits when the volatility is so high. But overall, it was a good day, I knew to be patient as market was wild and sometimes you want to just snipe a few trades and call it a day before you get caught on the wrong side.
The great thing about big moves is that it will eventually hit a major level and it will react really well, you just have to wait for it.
a great question is will the market recover? Or is going back down to April prices?
News
*STOCKS TUMBLE TO END THE WEEK, VIX SPIKES AS SOFT JOBS DATA STOKE ECONOMIC JITTERS
What are the critical support levels to watch?
--> Above 6330= Bullish, Under 6310= Bearish

DIYWallSt Trade Journal: $531 Profit & Navigating Volatile Morn**07/21/25 Trade Journal, and ES_F Stock Market analysis **
EOD accountability report: +531.25
Sleep: 6 hours
Overall health: worked on the newsletter last night and didn't get much sleep.
** VX Algo System Signals from (9:30am to 2pm) **
— 9:30 AM VXAlgo NQ X3 Buy
— 9:42 AM Market Structure flipped bullish on VX Algo X3!
— 10:40 AM VXAlgo ES X1 Sell Signal
— 12:42 PM VXAlgo ES X1 Buy signal
**What’s are some news or takeaway from today? and What major news or event impacted the market today? **
market moved very well this morning after bullish market structure signal, but because it was so violent, it was hard to hold that position for long.
throughout the rest of the day, it moved extremely slow and eventually formed a double top and came all the way down to market opening price lol.
**News**
*FED CHAIR POWELL HIT WITH CRIMINAL REFERRAL BY HOUSE GOP TRUMP ALLY - FOXNEWS
**What are the critical support levels to watch?**
--> Above 6339= Bullish, Under 6320= Bearish
Video Recaps -->https://www.tradingview.com/u/WallSt007/#published-charts

DIYWallSt Trade Journal:$238 Lessons From Monthly Expiration07/18/25 Trade Journal, and ES_F Stock Market analysis
EOD accountability report: +238.75
Sleep: 5. hours
Overall health: Was working late last night and didn't get much sleep.
VX Algo System Signals from (9:30am to 2pm)
— 8:30 AM Market Structure flipped bullish on VX Algo X3!
— 10:30 AM Market Structure flipped bearish on VX Algo X3!
— 11:10 AM VXAlgo ES X1 Buy signal (didn't work that well)
— 12:10 PM VXAlgo NQ X1DD Sell Signal
— 12:19 PM Market Structure flipped bullish on VX Algo X3!
What’s are some news or takeaway from today? and What major news or event impacted the market today?
Today was monthly expiration for options and we got a lot of X7 Sell signals but structure was bullish so I tried to take a long at MOB and got burned. Flipped bearish and started shorting the rest of the day and ended up making money back.
News
*US STOCKS MOVE LOWER AFTER REPORT SAYS TRUMP PUSHES FOR 15-20% MINIMUM TARIFF ON ALL EU GOODS
What are the critical support levels to watch?
--> Above 6335= Bullish, Under 6315= Bearish
Video Recaps -->https://www.tradingview.com/u/WallSt007/#published-charts

DIYWallSt Trade Journal: How I Navigated Powell Firing Rumors & 07/16/25 Trade Journal, and ES_F Stock Market analysis
EOD accountability report: +428.75
Sleep: 7 hours
Overall health: Good
VX Algo System Signals from (9:30am to 2pm)
— 4:17 AM Market Structure flipped bullish
— 9:50 AM Market Structure flipped bearish
— 12:00 PM VXAlgo NQ X3 Buy Signal
— 1:02 PMMarket Structure flipped bullish
What’s are some news or takeaway from today? and What major news or event impacted the market today?
Today was a crazy trading day with a bunch of wild moves because Trump said they were going to fire Powell and then cancelled the threat.
Overall health and sleep have been good this week and our trading balance is reflecting that.
News
— 10:30 AM *SCOTT BESSENT: “FORMAL PROCESS” TO REPLACE FED CHAIR POWELL UNDERWAY
— 12:11 PM
*TRUMP ASKED IF HE WILL FIRE POWELL: NOT PLANNING ON DOING ANYTHING
What are the critical support levels to watch?
--> Above 6290= Bullish, Under 6280= Bearish
Video Recaps -->https://www.tradingview.com/u/WallSt007/#published-charts

DIYWallSt Trade Journal: Perfect Morning Signals & Rate Cut bets07/15/25 Trade Journal, and ES_F Stock Market analysis
EOD accountability report: +404.50
Sleep: 7 hours
Overall health: Good
VX Algo System Signals from (9:30am to 2pm)
— 8:41 AM Market Structure flipped bullish on VX Algo X3!
— 9:33 AM VXAlgo ES X1 Sell Signal (triple sell)
— 9:40 AM Market Structure flipped bearish on VX Algo X3!
— 1:20 PM VXAlgo ES X1 Buy signal (triple buy)
What’s are some news or takeaway from today? and What major news or event impacted the market today?
We got great signals at the start of the day and that really helped with today's trading. I had some meetings today and stufff to take care of so i decided to lock out the funded account around noon and called a day.
News
— 9:54 AM
*TRADERS STICK TO BETS ON SEPTEMBER FED RATE CUT AFTER INFLATION REPORT
What are the critical support levels to watch?
--> Above 6295= Bullish, Under 6285= Bearish
Video Recaps -->https://www.tradingview.com/u/WallSt007/#published-charts

DIYWallSt Trade Journal:The Importance of Your First Trade **07/14/25 Trade Journal, and ES_F Stock Market analysis **
EOD accountability report: +158.75
Sleep: 7 hours
Overall health: Good
** VX Algo System Signals from (9:30am to 2pm) **
— 8:00 AM Market Structure flipped bullish on VX Algo X3!
— 10:30 AM VXAlgo NQ X1DD Buy Signal
— 11:50 AM VXAlgo ES X1 Sell Signal
— 1:00 PM VXAlgo NQ X1DD Buy Signal
**What’s are some news or takeaway from today? and What major news or event impacted the market today? **
I need to really be careful with my first trade and making sure it is a high probability trade, otherwise a bad early start is likely to ruin my whole day.
News
— 1:42 PM *TRUMP TO UNVEIL $70 BILLION IN AI AND ENERGY INVESTMENTS
— 4:08 PM *S&P 500 ENDS HIGHER AS STOCKS RISE AFTER TRUMP SAYS OPEN TO DEALS ON TARIFFS
**What are the critical support levels to watch?**
--> Above 6295= Bullish, Under 6285= Bearish
Video Recaps -->https://www.tradingview.com/u/WallSt007/#published-charts

DIYWallSt Trade Journal: Missed Entry & Climbing Back From Loss **07/11/25 Trade Journal, and ES_F Stock Market analysis **
EOD accountability report: -46.25
Sleep: 5 hours
Overall health: Good
** VX Algo System Signals from (9:30am to 2pm) 3/3 success**
— 9:41 AM Market Structure flipped bearish on VX Algo X3!
— 10:15 AM VXAlgo ES X7 Buy signal,
— 10:23 AM Structure flipped bullish
— 11:30 AM VXAlgo ES X3DD Sell Signal
**What’s are some news or takeaway from today? and What major news or event impacted the market today? **
I was a little busy this morning and missed the chance to short the market at MOB with Bearish market structure at 9:30, so I had to wait for the next chance but when i shorted the MOB on the move up, the X7 buy signal came out and pushed market structure bullish.
Ultimately If i had a better entry on my short, I would have been okay, but since i shorted early, i got stopped at at 6306 and it ended up dropping right after that. So the day actually started pretty bad and i was -300 from there and was just trying to climb back and forth the next few hours.
News
*LATEST TARIFF THREATS COULD DELAY RATE CUTS, CHICAGO FED’S GOOLSBEE SAYS - WSJ
**What are the critical support levels to watch?**
--> Above 6290= Bullish, Under 6280= Bearish
Video Recaps -->https://www.tradingview.com/u/WallSt007/#published-charts

DIYWallSt Trade Journal: Starting Down $400 & Patience Pays Off 07/09/25 Trade Journal, and ES_F Stock Market analysis
EOD accountability report: -271
Sleep: 4.5 hours
Overall health: Good
VX Algo System Signals from (9:30am to 2pm) 4/4 success
10:00 AM VXAlgo ES X1 Sell Signal
10:36 AM VXAlgo ES X3 Sell Signal
11:00 AM Market Structure flipped bearish on VX Algo X3!
1:33 PM Market Structure flipped bullish on VX Algo X3!
What’s are some news or takeaway from today? and What major news or event impacted the market today?
I took some short positions overnight and got caught in the big push up this morning and started the day with -400, I was very tempted to go big and tried to trade it back but decided it was better off just to wait for a better day to recover the account instead.
Consider yesterday was a big manipulation day and today was another one but squeezing to the upside for a rug pull downwards.
News
*(US) FOMC JUN MINUTES: COUPLE OF PARTICIPANTS NOTED THEY WOULD BE OPEN TO CONSIDERING A RATE CUT AS SOON AS THE JULY MEETING IF DATA EVOLVE AS THEY EXPECTED (Bowman and Waller have said as much since the FOMC meeting)
What are the critical support levels to watch?
--> Above 6290= Bullish, Under 6280= Bearish
Video Recaps -->https://www.tradingview.com/u/WallSt007/#published-charts

07/08/25 Trade Journal, and ES_F Stock Market analysis EOD accountability report: +220
Sleep: 7 hours
Overall health: Good
VX Algo System Signals from (9:30am to 2pm) 4/4 success
— 9:30 AM Market Structure flipped bullish on VX Algo X3! :check:
— 10:30 AM VXAlgo NQ X1 Buy Signal :check:
— 12:24 PM Market Structure flipped bullish on VX Algo X3! :check:
— 1:30 PM Market Structure flipped bearish on VX Algo X3! :check:
What’s are some news or takeaway from today? and What major news or event impacted the market today?
After taking losses, I usually set a lock out on my account after $200 profit to build back small wins and confidence. so luckily I was locked out pretty early today and avoided most of the market whipsaw. But on days like these, if you don't walk away after you make money, you could eventually get triggered and tilted by the whipsaw. a lot of orb traders probably died today.
News
*HOWARD LUTNICK ON TARIFFS: EXPECT ANOTHER 15-20 LETTERS TO GO OUT OVER THE NEXT 2 DAYS- CNB
*Trump announces 50% tariff on copper imports, threatens 200% tariff on pharmaceuticals and maybe chips
What are the critical support levels to watch?
--> Above 6280= Bullish, Under 6260= Bearish
Video Recaps -->https://www.tradingview.com/u/WallSt007/#published-charts

DIYWallSt Trade Journal: Why Price Action Beats News **07/02/25 Trade Journal, and ES_F Stock Market analysis **
EOD accountability report: +763
Sleep: 4.5 hours
Overall health: sleep deprived
** VX Algo System Signals from (9:30am to 2pm) 4/4 success**
— 9:57 AM Market Structure flipped bullish on VX Algo X3! :check:
— 10:30 AM Market Structure flipped bullish on VX Algo X3! :check:
— 11:10 AM VXAlgo ES X1 Sell Signal :x:
**What’s are some news or takeaway from today? and What major news or event impacted the market today? **
You can't trade on news, the only thing that matters in day trading is price action.
Bad news can still make the market go up.
News
The U.S. economy lost 33,000 jobs in June, as per ADP, badly missing forecasts for a gain of 99,000.
MICROSOFT TO LAY OFF AS MANY AS 9,000 EMPLOYEES
Tesla’s NASDAQ:TSLA Q2 deliveries miss consensus expectations
**What are the critical support levels to watch?**
--> Above 6250= Bullish, Under 6240= Bearish
Video Recaps -->https://www.tradingview.com/u/WallSt007/#published-charts

DIYWallSt Trade Journal: Why Traders Are Rotating from Nasdaq to**07/01/25 Trade Journal, and ES_F Stock Market analysis **
EOD accountability report: +1160
Sleep: 5 hours
Overall health: Need to catch up on sleep again
** VX Algo System Signals from (9:30am to 2pm) 4/4 success**
9:39 AM Market Structure flipped bullish on VX Algo X3! :check:
11:00 AM Market Structure flipped bearish on VX Algo X3 :check:
11:24 AM VXAlgo ES X1 Buy signal :check:
12:00 PM Market Structure flipped bullish on VX Algo X3! :check:
**What’s are some news or takeaway from today? and What major news or event impacted the market today? **
RTY and YM leading the way today
NQ lagging
Why is this?
The answer is, Simple Supply and Demand theory.
Money has to come from somewhere.
If Money is going to YM and RTY,
Money has to leave from NQ or ES or both.
There is not an infinite amount of money, So if one index is outperforming like crazy over the other. It must be draining from it
Why would it drain from NQ? Easy
Because NQ and ES already hit ATH,
YM and RTY has not hit ATH yet.
So people are selling NQ and buying YM because it is on Discount
News
N/A
**What are the critical support levels to watch?**
--> Above 6235= Bullish, Under 6210= Bearish
Video Recaps -->https://www.tradingview.com/u/WallSt007/#published-charts
