$ETC about to melt faces! Dino Coins Another great pump might come from this Dino Coin ETC!
Setup is clean, Volume is coming in, and the order of pumps is playing out. Dinos are next!
ETC is a great one for 20-60% Gains soon.
DYOR.
Etc

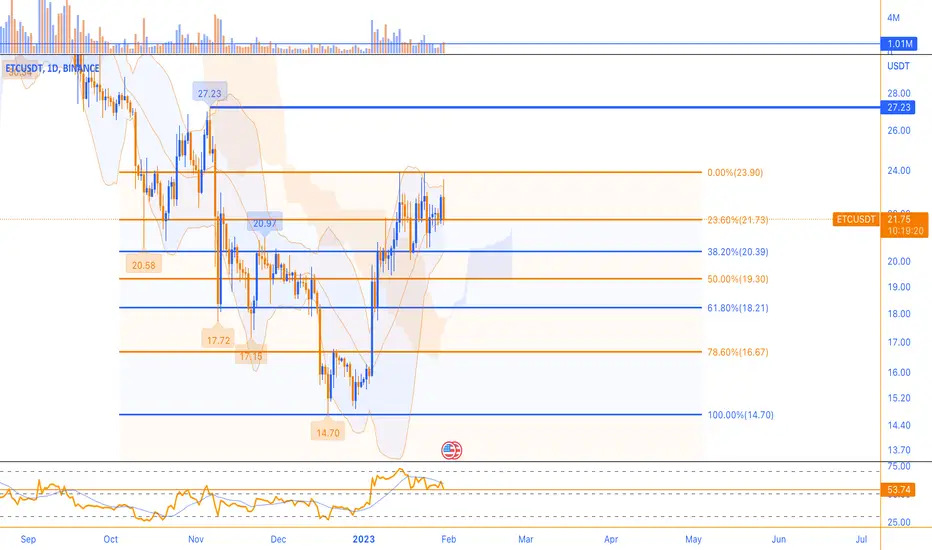
Ethereum Classic's top targets will be in the $27.23 rangeEthereum Classic's top targets will be in the $27.23 range if the price breaks through the $23.9 resistance. In the 4-hour timeframe, we can see the range trend, which can continue in the best case this week.
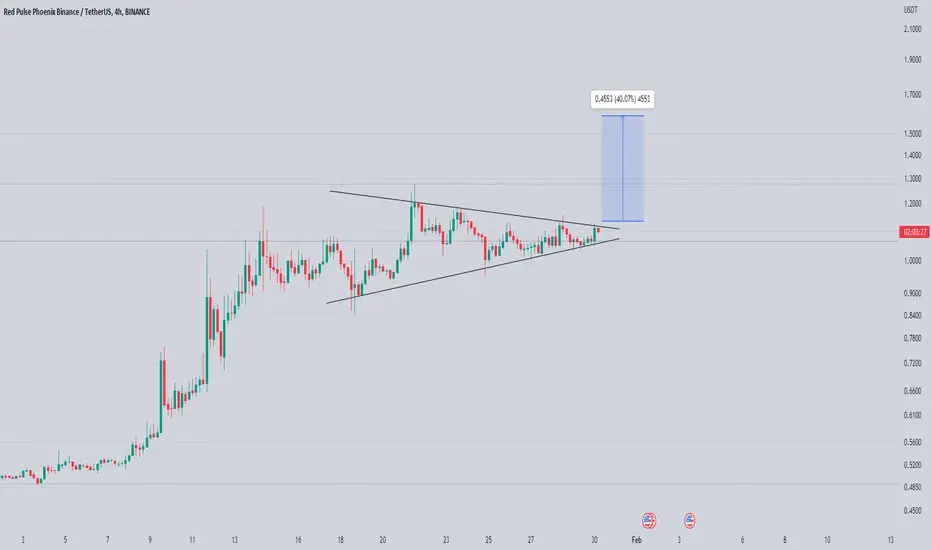
Phbusdt Formed Bulish Pennant formed Bulish Pennant In h4 timeframe
Incase Of breakout expecting Another 35 to 40% Bulish Move
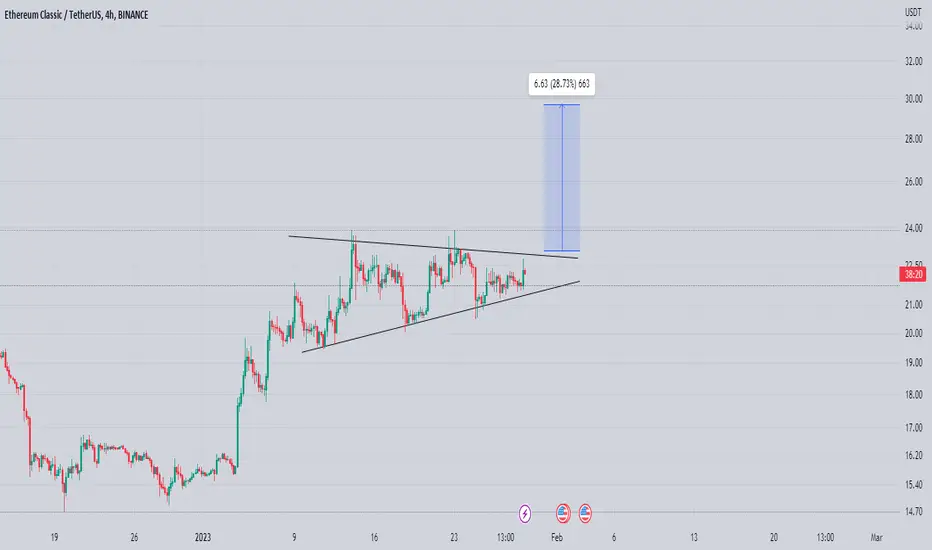
Etcusdt Forming Bulish Pennant Etcusdt Forming bulish Pennant In h4 Timeframe
Incase Of Breakout Expecting 25 To 30% Bulish Move
Entry Will Be Only valid after Breakout
ETC LONG SETUPHi, dear traders. how are you ? Today we have a viewpoint to BUY/LONG the ICP symbol.
For risk management, please don't forget stop loss and capital management
When we reach the first target, save some profit and then change the stop to entry
Comment if you have any questions
Thank You

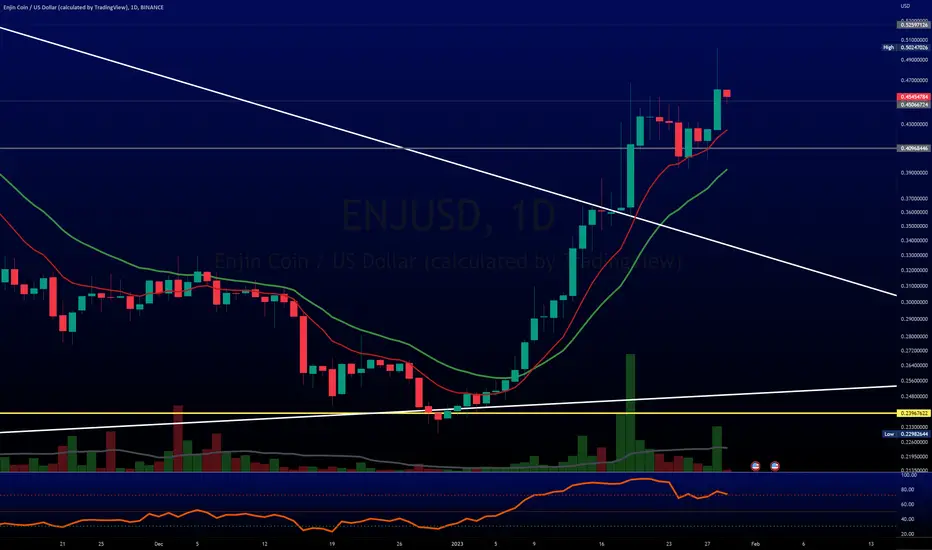
Reviewing post done day ago $ENJ $FARM $ETC moving#crypto that ran, sold off & basing
OR slow movers
SO FAR
$ETC closing in on 10%
$FARM up almost $2
$ENJ did 10%, look at volume!
Others are stagnant for the most part
#cryptotrading
E
$MKR $ETC $PYR $ENJ sold off bit, $FARM $LINK lagging, $DG SLOWLook for #crypto that have run, sold off & basing
Possible #Cryptos
$MKR
$ETC
$PYR
$ENJ
Slow movers
$FARM
$LINK
Hasn't moved
$DG
M

Since Jan 3 post: $ANT & $INJ up 50% $LTC 25% $ETC up 60%These have all done well
Some have done a lot better than others
$LTC 25%
$ETC 60%
$ANT 50%
$INJ 50%
#DEFI #ETC #LTC #litecoin #injection
A

MARKET BULL SEASON ( ALTCOIN SEASON )Crypto coins started to be discovered. Everyone wants to be rich. And this is why it is turning to altcoins instead of btc.
Especially the Shit coin Doge, Hot, Btt, Chz, etc. It will turn to pump coins. Season is PUMP season.
If the first areas are happy, the last ones will suffer great losses.
Sorry, these are the Facts.
You can wait for years. It is useful to be careful.
Because when they get what they want, they have nothing left to buy from you.
Sorry, Doge will finish the season with Btc.
For now, I see it as May 31, 2021.
Stay tuned, ahead. I'll share the exact dates.
Enjoy it very much on May 31st.
Pay attention especially on May 24th.
Hill Hunt will go out (ALL TIME High will come).
Look at the top selling. May some others win.
Getting out in the right place is most important.
This season is the season of disposal.
Move up, those who open Short can do a lot of damage.
When the bear season comes, we will lower the prices together.
Pay Attention to Your Stops.

ETC Long play incoming gainsEthereum Classic always makes nice rebounds in support zone. This means now it is good opportunity to take risk, because price in support zone from long term.
Consider to protect yourselfs and use stop loss if you trading it.
Expecting 3 major targets (on the chart) within next month.

ETHEREUM CLASSIC, a long term vision. ETCUSDT . UpdateHello guys, This is an update of previous analysis (blow link), we made our buy positions at the two points which we wanted and the trend has moved as we expected. For now you can manage your capital and profit until reaching the chosen target.
Good luck
If you like the idea, do not forget to support with a like and follow me for next analysis :)
Write your comment and opinion below for me

Btcusdt looking Weak Looks Like Btc want Some Correction In Shorter Tfs
Btc Was Following 50ema In From Last few days In H1 Recently 50Ema Broken
While Rsi Printed Massive bearish divergence
Now If we Look At Price Action Where Btc Forming Ascending channel Too NoW If Its Broken To Downside My Target Will Be 18700 Area
Always Wait For Confirmed breakout To Enter

✴️ Ethereum Classic Bullish Consolidation ContinuesThe last signal we looked at was the break above EMA100 for Ethereum Classic (ETCUSDT), this on Friday, 13-Jan-2023, se below:
Now we have four days already of prices staying above this level.
When a level is conquered, the main condition for confirmation is "staying above" said level.
Back in July 2022 when EMA100 was first conquered ETCUSDT consolidated for 7 days above this level before a major wave!
So far we are looking great...
On a drop, the relevant levels are as follows:
1- $20.90 for EMA100 and EMA10.
2- $19.50 for EMA21 and 0.382 Fib.
Remember the bigger picture, we are looking good.
Patience is key... Chances are we still have plenty of growth of ahead.
Namaste.

Flow Testing Trendline In H4 Timeframe Rsi Printed Bulish Divergence Incase Of breakout expecting Bulish Impulse
Entry Will Be Valid Only If Trendline Got cleared After Trendline Breakout Safe Stoploss Would Be Recent Low

✳️ Ethereum Classic To Resume Growing vs BitcoinEthereum Classic is one of the main altcoins that we track and we follow ETCUSDT and ETCBTC.
Each pair has its own peculiarities.
The long-term perspective is quite clear and this chart I shared for you before.
On the 9-Jan. a peak was hit, the initial breakout (wave 1) and now it seems that ETCBTC is going ready to resume its growth.
There will always be retraces and corrections, nothing moves straight up but the short- and mid-term perspective is up, up and up.
We have until late March green... This is only the beginning.
Namaste.

ETC Good Investement Assetthis one is interstingly good, why?
1200 Million LOT Contracts with positive Delta accumulation in 7/2022
and waiting for market pump
so just buy at 6$ level and wait
profit zones
14
40
70
if you wanna bet you can hold above 70

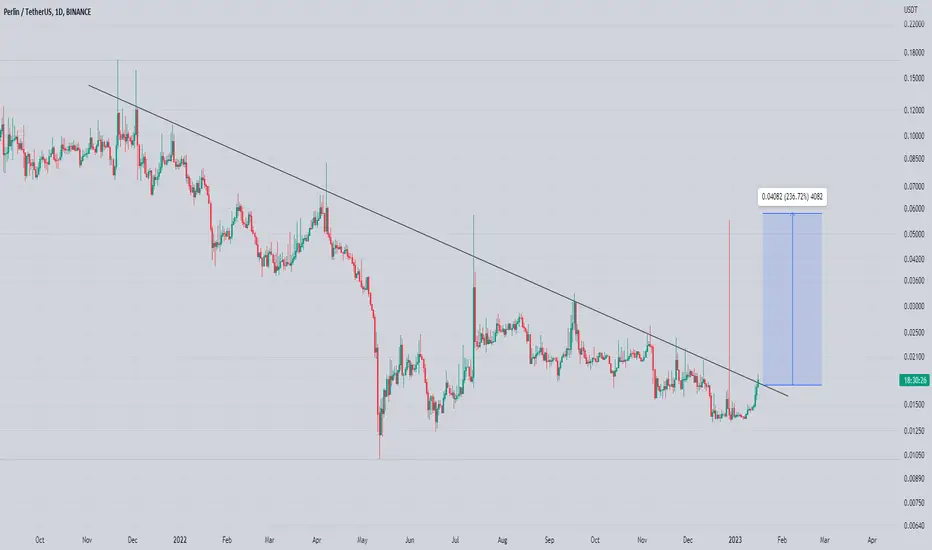
Perpusdt Breaking Trendline Breaking trendline In daily Timeframe incase Of Successful breakout expecting 150% to 180% bulish Wave
Keep In Mind Entry will Be Only valid Once Breakout confirmed
PLong
ETCUSDTBreaking Descending Channel In daily Timeframe
Rsi Printed Bulish divergence macd Crossover Also confirming Bulls Strength
Incase Of Breakout Expecting Massive Bounce (Keep In Mind Entry Will Be Only Valid After Confirmed Breakout)
Stoploss Can Be Placed Below Recent Low Its An Idea Not Financial Advice Dyor Before taking Any Action

ETC SCALP LONG SETUPHi, dear traders. how are you ? Today we have a viewpoint to BUY/LONG the ETC symbol.
For risk management, please don't forget stop loss and capital management
When we reach the first target, save some profit and then change the stop to entry
Comment if you have any questions
Thank You

ETC next Support and Resistance (daily)as you can see ETC has rejected from daily supply zone and also dynamic resistance,
I have mentioned demand zones in daily, it can bounce from demand zones,
I hope my analysis be useful for you and makes a good profit

✴️ Ethereum Above EMA100, Prepares Major Move (65-125%)Things change and when do so it happens fast and without warning but we cannot say that we didn't have any warnings... The charts were full of them.
In late December we became "excited" about the potential we saw in the Ethereum Classic chart... Waiting though was the only real action that took place.
The wait is over, we said and today Ethereum Classic is already trading above EMA100... There is no going back now but this is only the beginning, more growth is sure to happen in the months and weeks ahead.
In order to figure out what is coming to this market, this chart, to this altcoin pair, I look at was is happening with other pairs that moved ahead.
" What one does, the rest follows... "
For example, FetachAI went ahead and we can see it growing and growing, already trading above EMA300 and aiming even higher... That's what will happen with ETC as well.
$25-$27 is the EMA300 target but there can be more.
My main target from the current price is set now at $35 for a nice 65%.
Even $47 is possible since we are trading within a higher low and higher lows lead to higher highs.
See the previous charts for more and 'Related Ideas; below.
Namaste.
Previous charts:
✴️ FetchAI | 8-Dec-2022
✴️ Ethereum Classic | 20-Dec-2022

ETHEREUM Classic ETC price probably forms trend reversal patternThe price of ETCUSDT after a sharp price surge in July-August 2022 now has been in a protracted consolidation for 4 months.
However, there is a possibility that on the ETCUSD price chart market players can now form an "Inverted head and shoulders" reversal pattern
In the current impulse growth momentum, the ETC price can reach $19.5
If the reversal pattern will be fully formed as we have shown on the chart, the target for the growth of the Ethereum Classic price will rise to $25
_____________________
Did you like our analysis? Leave a comment, like, and follow to get more

ETCUSDTETCUSDT (4H Chart) Smart Money analysis
Snipe Trade
Max Leverage 10x
Always keep Stop loss
Follow Our Tradingview Account for More Technical Analysis Updates, | Like, Share and Comment Your thoughts
