#ETC/USDT The price is moving within an ascending channel#ETC
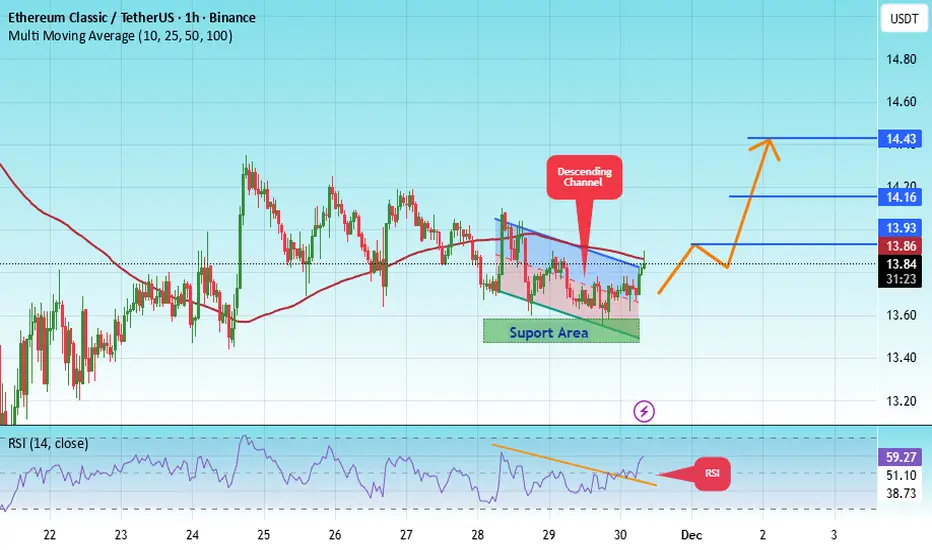
The price is moving in a descending channel on the 1-hour timeframe. It has reached the lower boundary and is heading towards breaking above it, with a retest of the upper boundary expected.
We have a downtrend on the RSI indicator, which has reached near the lower boundary, and an upward rebound is expected.
There is a key support zone in green at 13.86. The price has bounced from this zone multiple times and is expected to bounce again.
We have a trend towards stability above the 100-period moving average, as we are moving close to it, which supports the upward movement.
Entry price: 13.86
First target: 13.93
Second target: 14.16
Third target: 14.43
Don't forget a simple principle: money management.
Place your stop-loss below the support zone in green.
For any questions, please leave a comment.
Thank you.
Etclong
#ETC/USDT #ETC The price is moving within an ascending channel #ETC
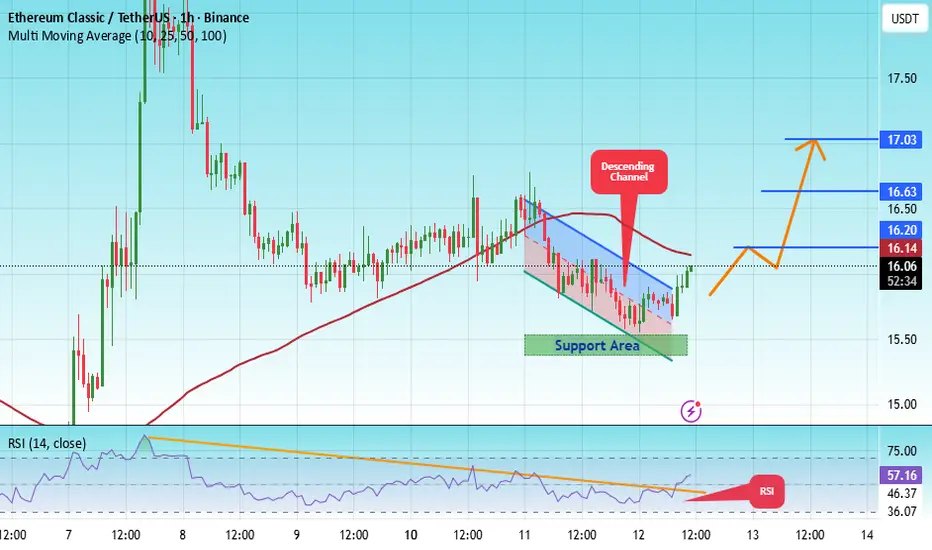
The price is moving within an ascending channel on the 1-hour timeframe and is adhering to it well. It is poised to break out strongly and retest the channel.
We have a downtrend line on the RSI indicator that is about to break and retest, which supports the upward move.
There is a key support zone in green at the 15.50 price, representing a strong support point.
We have a trend of consolidation above the 100-period moving average.
Entry price: 16.00
First target: 16.20
Second target: 16.63
Third target: 17.00
Don't forget a simple money management rule:
Place your stop-loss order below the green support zone.
Once you reach the first target, save some money and then change your stop-loss order to an entry order.
For any questions, please leave a comment.
Thank you.
#ETC/USDT Might Be Good Zone to Bounce From#ETC
The price is moving within an ascending channel on the 1-hour timeframe and is adhering to it well. It is poised to break out strongly and retest the channel.
We have a downtrend line on the RSI indicator that is about to break and retest, which supports the upward move.
There is a key support zone in green at 15.50, representing a strong support point.
We have a trend of consolidation above the 100-period moving average.
Entry price: 15.85
First target: 16.08
Second target: 16.32
Third target: 16.68
Don't forget a simple money management rule:
Place your stop-loss order below the support zone in green.
Once the first target is reached, save some money and then change your stop-loss order to an entry order.
For any questions, please leave a comment.
Thank you.

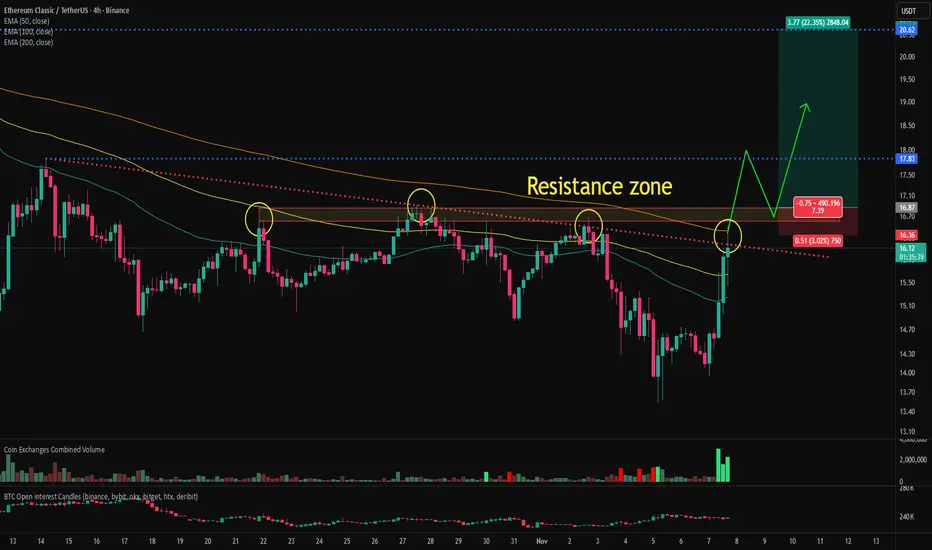
ETC(ehereum classic) chart analysis and bullish signalEthereum Classic is currently attempting to break above the 200-period moving average, a key resistance level, and a major supply zone on the 4-hour chart. Although it’s facing resistance at the moment, a decisive breakout through these overlapping resistance zones could provide an attractive long-entry opportunity with a favorable risk-to-reward ratio.
Given that this resistance area has rejected multiple breakout attempts in the past, the probability of a successful breakout this time appears relatively high.
The ETC/BTC chart has also cleared several major resistance levels, suggesting that ETC could follow a similar pattern to recent strong performers such as ZEC, DASH, and 1INCH.
The bullish alignment on the ETC/BTC chart also indicates that Ethereum Classic is outperforming Bitcoin.
If Ethereum Classic confirms a breakout above the resistance zone, I will share an updated analysis on the subsequent price outlook.
#ETC/USDT Might Be Good Zone to Bounce From#ETC
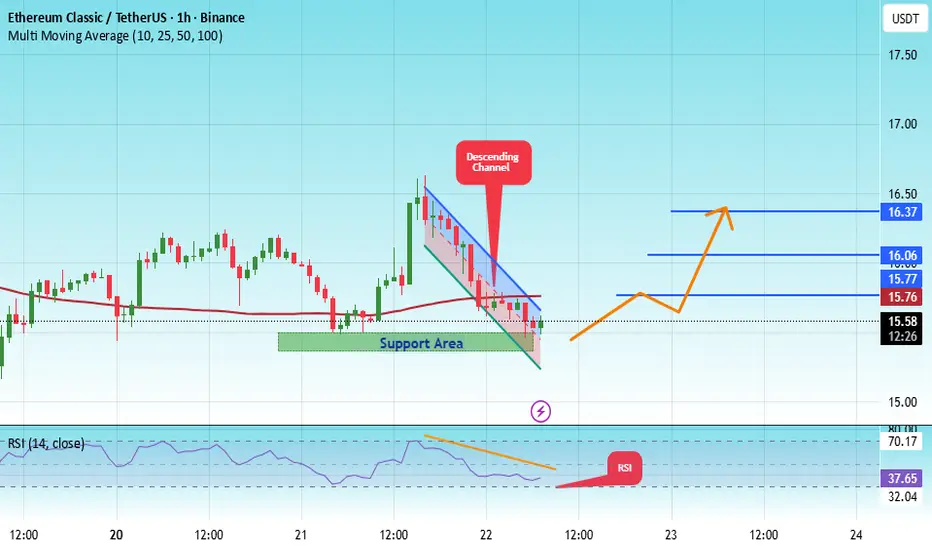
The price is moving within a descending channel on the 1-hour frame, adhering well to it, and is heading for a strong breakout and retest.
We have a bearish trend on the RSI indicator that is about to be broken and retested, which supports the upward breakout.
There is a major support area in green at 15.41, representing a strong support point.
We are heading for consolidation above the 100 moving average.
Entry price: 15.60
First target: 15.76
Second target: 16.06
Third target: 16.37
Don't forget a simple matter: capital management.
When you reach the first target, save some money and then change your stop-loss order to an entry order.
For inquiries, please leave a comment.
Thank you.
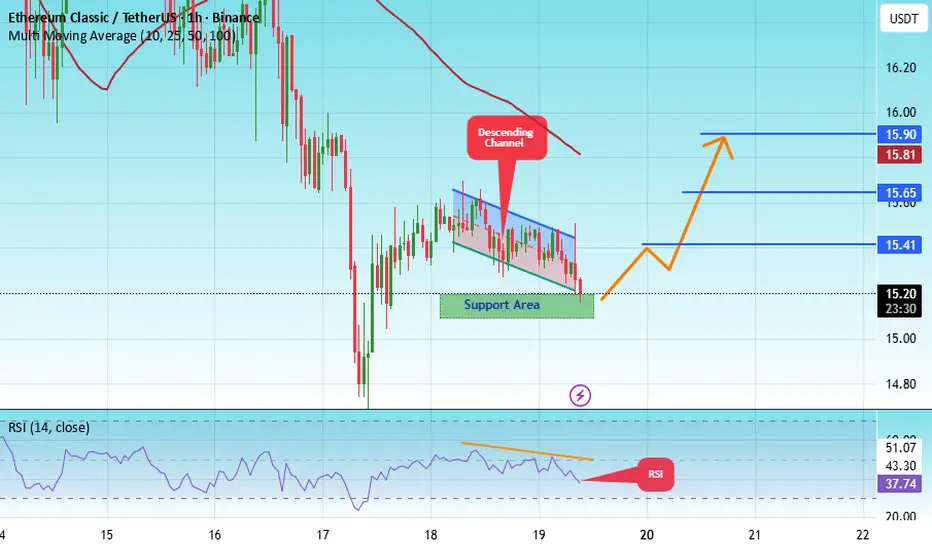
#ETC/USDT Might Be Good Zone to Bounce From#ETC
The price is moving within a descending channel on the 1-hour frame, adhering well to it, and is heading for a strong breakout and retest.
We have a bearish trend on the RSI indicator that is about to be broken and retested, which supports the upward breakout.
There is a major support area in green at 15.10, representing a strong support point.
We are heading for consolidation above the 100 moving average.
Entry price: 15.21
First target: 15.41
Second target: 15.65
Third target: 15.90
Don't forget a simple matter: capital management.
When you reach the first target, save some money and then change your stop-loss order to an entry order.
For inquiries, please leave a comment.
Thank you.
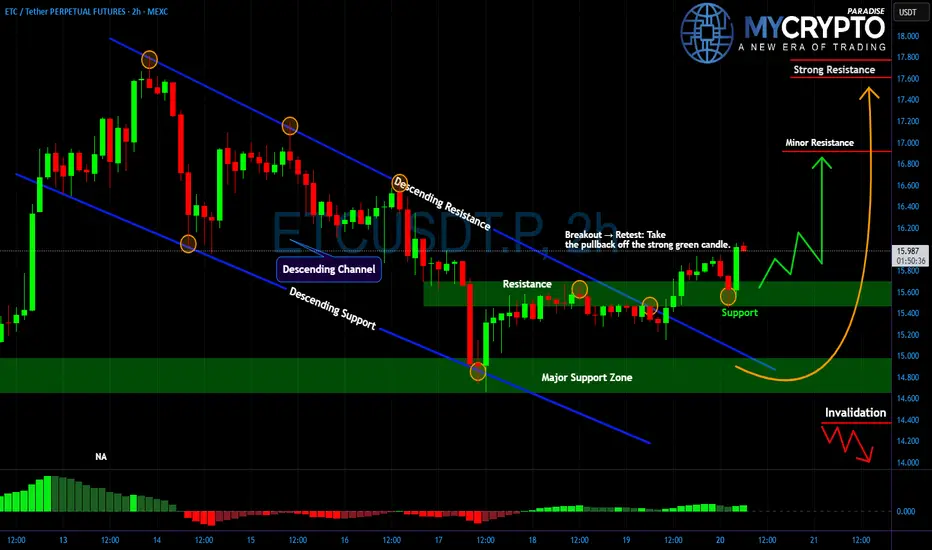
ETC Breakout Confirmed… But Will It Hold or Fake Out?Yello Paradisers, did you catch this clean breakout from the descending channel on ETCUSD just as we expected? If not, you might already be late to the first leg but the real move might still be ahead.
💎#ETCUSDT was trading inside a well-defined descending channel for days, respecting both trendline resistance and support beautifully. The market structure shifted when price broke above the upper boundary of this trend, followed by a textbook retest right at the $15.60 level turning former resistance into support.
💎This move was confirmed by a strong green bullish candle and an uptick in volume, hinting at momentum building up behind the bulls.
💎Currently, #ETC is holding above the key support zone $15.40–$15.80. If this zone holds firm, we expect the price to continue pushing toward the next resistance levels at $16.60 and $17.40. The $17.40 zone is especially important it marks a strong resistance that could either trigger a reversal or lead to an explosive breakout if flipped.
💎On the other hand, any clean breakdown below $15.40 followed by weakness would invalidate this bullish setup and likely drive price back to the $14.00 zone, so risk management is key.
Discipline, patience, robust strategies, and trading tactics are the only ways you can make it long-term in this market.
MyCryptoParadise
iFeel the success🌴
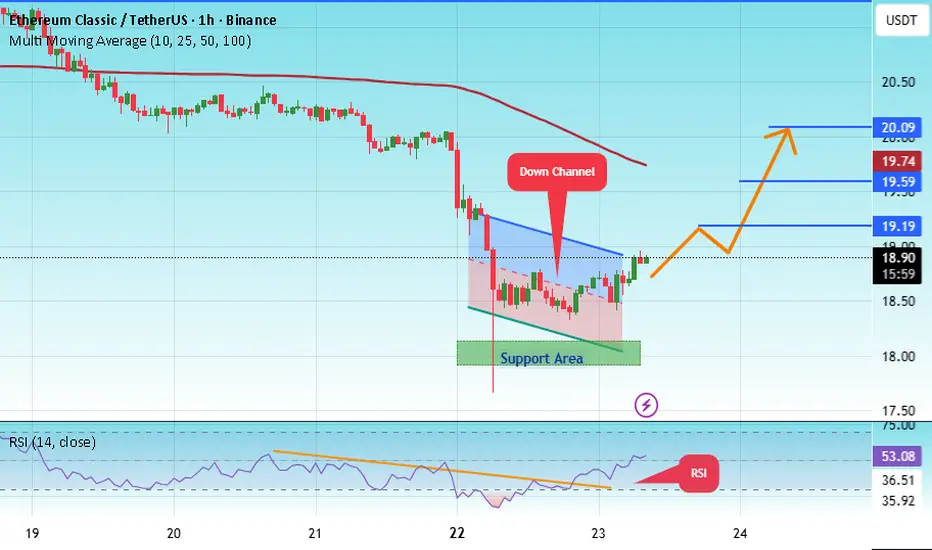
#ETC/USDT Might Be Good Zone to Bounce From#ETC
The price is moving within a descending channel on the 1-hour frame, adhering well to it, and is heading for a strong breakout and retest.
We have a bearish trend on the RSI indicator that is about to be broken and retested, which supports the upward breakout.
There is a major support area in green at 18.00, representing a strong support point.
We are heading for consolidation above the 100 moving average.
Entry price: 18.80
First target: 19.19
Second target: 19.60
Third target: 20
Don't forget a simple matter: capital management.
When you reach the first target, save some money and then change your stop-loss order to an entry order.
For inquiries, please leave a comment.
Thank you.
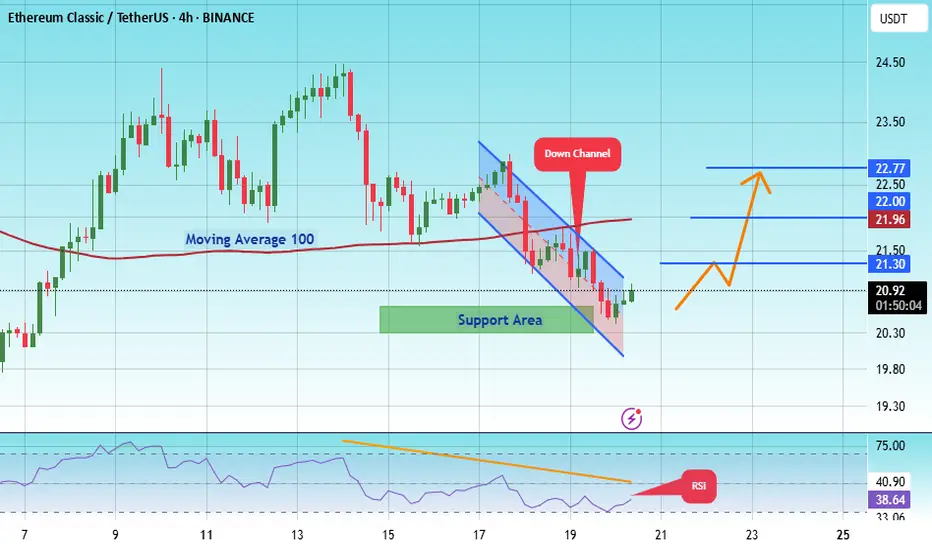
#ETC/USDT Might Be Good Zone to Bounce From#ETC
The price is moving within an ascending channel on the 1-hour frame, adhering well to it, and is on its way to breaking strongly upwards and retesting it.
We have support from the lower boundary of the ascending channel, at 20.00.
We have a downtrend on the RSI indicator that is about to break and retest, supporting the upside.
There is a major support area in green at 20.43, which represents a strong basis for the upside.
Don't forget a simple thing: ease and capital.
When you reach the first target, save some money and then change your stop-loss order to an entry order.
For inquiries, please leave a comment.
We have a trend to hold above the 100 Moving Average.
Entry price: 20.95
First target: 21.30
Second target: 22.00
Third target: 22.77
Don't forget a simple thing: ease and capital.
When you reach the first target, save some money and then change your stop-loss order to an entry order.
For inquiries, please leave a comment.
Thank you.
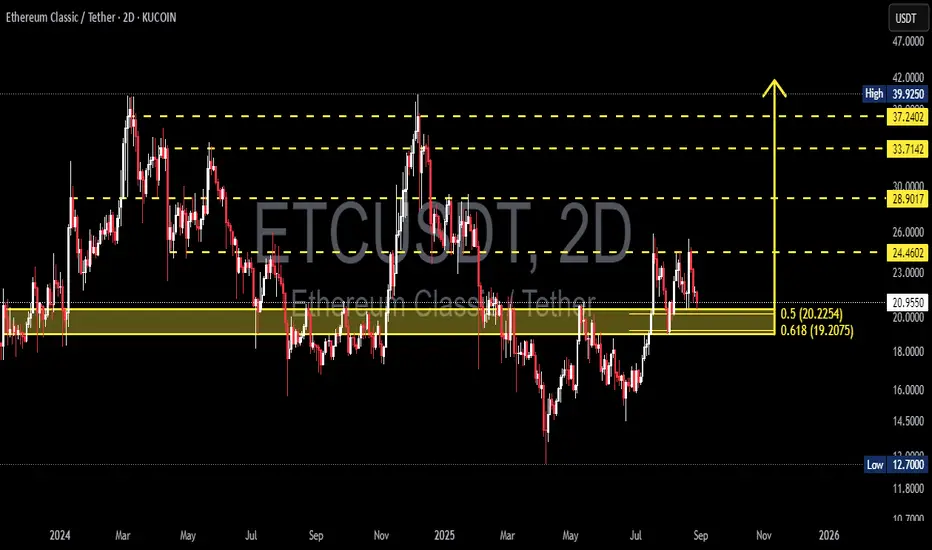
ETC/USDT — Testing Golden Pocket: Rebound or Breakdown?Ethereum Classic (ETC) is currently at a critical decision zone after being rejected around the 24.46 USDT resistance. The price has now pulled back into the Fibonacci golden pocket (0.5–0.618) at 20.22–19.20 USDT, a key support zone that previously acted as a major flip level (resistance → support).
This area carries heavy significance as it has served as a battleground for liquidity multiple times. The reaction here will likely determine whether ETC continues its mid-term bullish structure or slips back into a deeper bearish trend.
---
🔎 Market Structure & Pattern
Mid-term structure: ETC is trading within a wide range between the historical support of 12.70 and the upper resistance near 39.93.
Short-term focus: The 19.20–20.22 golden pocket is the decision point for the next move.
Bullish bias holds as long as this level remains intact.
Bearish risk emerges if the golden pocket fails, triggering a deeper breakdown.
---
🚀 Bullish Scenario
1. Strong rejection at the golden pocket with bullish reversal candles (engulfing / pin bar) → buyer confirmation.
2. Short-term target: 24.46 (nearest resistance).
3. Break and close above 24.46 on the 2D timeframe opens upside targets at 28.90 → 33.71 → 37.24 → 39.93.
4. Supporting signals: RSI holding above 50 + volume expansion on breakout.
---
⚠️ Bearish Scenario
1. Breakdown confirmed if the 2D candle closes below 19.20 → support failure.
2. Downside targets: 16.00 → 14.50 → 12.70 (historical low).
3. A weak bounce forming only a lower high below 24.46 would strengthen bearish continuation.
4. Confirmation: high volume on breakdown + strong bearish candles without lower wicks.
---
📝 Trader’s Notes
The golden pocket zone (19.20–20.22) is the decision point for the next macro move.
Aggressive traders may consider longs here with tight stops below 18.00.
Conservative traders should wait for a confirmed breakout above 24.46 before entering.
Risk management is crucial: aim for at least 1:2 risk-to-reward ratio.
---
📌 Key Levels
Support: 19.20–20.22
Nearest resistance: 24.46
Bullish targets: 28.90 → 33.71 → 37.24 → 39.93
Bearish targets: 16.00 → 14.50 → 12.70
#ETCUSD #EthereumClassic #ETC #CryptoAnalysis #Altcoin #TechnicalAnalysis #SupportResistance #Fibonacci #PriceAction #SwingTrade
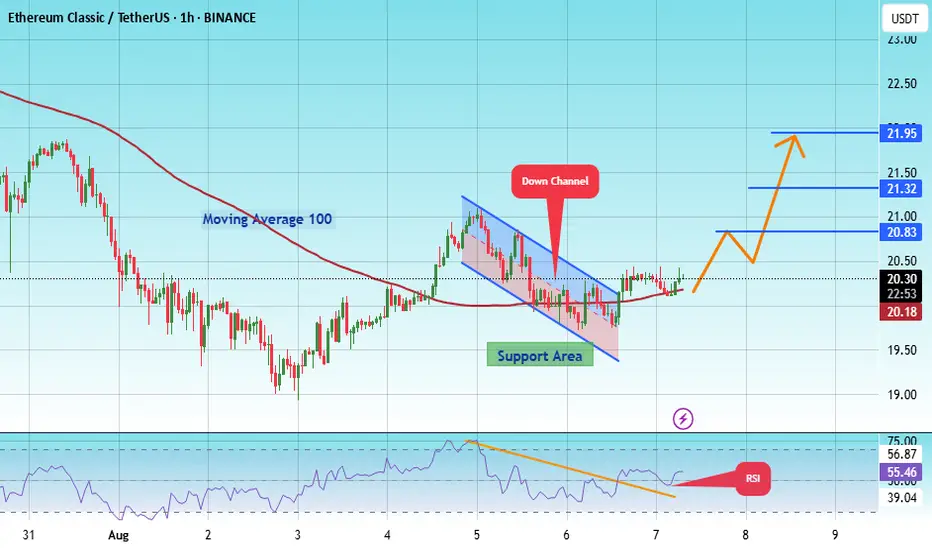
#ETC/USDT Might Be Good Zone to Bounce From#ETC
The price is moving within an ascending channel on the 1-hour frame, adhering well to it, and is on its way to breaking strongly upwards and retesting it.
We have support from the lower boundary of the ascending channel, at 19.61.
We have a downtrend on the RSI that is about to be broken and retested, supporting the upside.
There is a major support area in green at 19.34, which represents a strong basis for the upside.
Don't forget a simple thing: ease and capital.
When you reach the first target, save some money and then change your stop-loss order to an entry order.
For inquiries, please leave a comment.
We have a trend to hold above the 100 Moving Average.
Entry price: 20.30.
First target: 20.83.
Second target: 21.32.
Third target: 21.95.
Don't forget a simple thing: ease and capital.
When you reach the first target, save some money and then change your stop-loss order to an entry order.
For inquiries, please leave a comment.
Thank you.
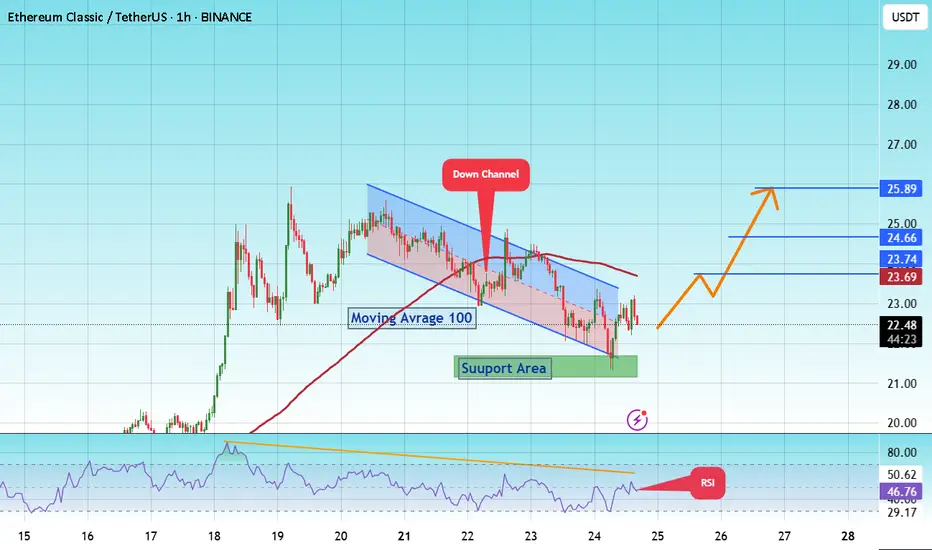
#ETC/USDT Forming Strong Bullish Potential#ETC
The price is moving within a descending channel on the 1-hour frame and is expected to break and continue upward.
We have a trend to stabilize above the 100 moving average once again.
We have a downtrend on the RSI indicator that supports the upward move with a breakout.
We have a support area at the lower boundary of the channel at 21.80, acting as strong support from which the price can rebound.
We have a major support area in green that pushed the price upward at 21.20.
Entry price: 22.50
First target: 23.70
Second target: 24.66
Third target: 25.90
To manage risk, don't forget stop loss and capital management.
When you reach the first target, save some profits and then change your stop order to an entry order.
For inquiries, please comment.
Thank you.
Ethereum Classic:Buying opportunity?hello friends 👋
Considering the price drop we had, you can see that buyers are coming in less and less in the support areas that we specified for you, and this can be a good signal to buy in these areas step by step with capital and risk management and move to the specified goals.
🔥Follow us for more signals🔥
*Trade safely with us*
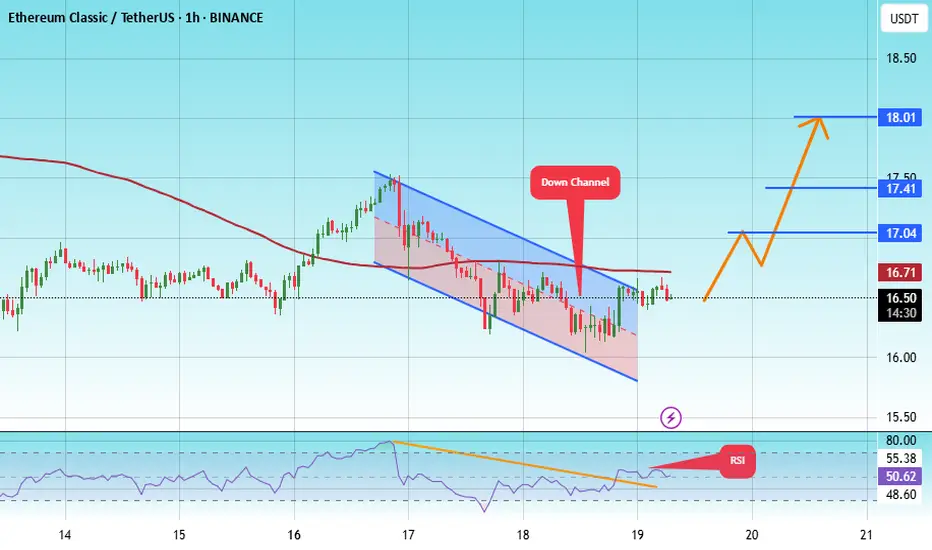
#ETC/USDT#ETC
The price is moving within a descending channel on the 1-hour frame, adhering well to it, and is heading towards a strong breakout and retest.
We are experiencing a rebound from the lower boundary of the descending channel. This support is at 16.
We are experiencing a downtrend on the RSI indicator, which is about to break and retest, supporting the upward trend.
We are heading for stability above the 100 moving average.
Entry price: 16.50
First target: 17
Second target: 17.50
Third target: 18
#ETC/USDT#ETC
The price is moving within a descending channel on the 1-hour frame and is expected to break and continue upward.
We have a trend to stabilize above the 100 moving average once again.
We have a downtrend on the RSI indicator that supports the upward move with a breakout.
We have a support area at the lower boundary of the channel at 16.50, which acts as strong support from which the price can rebound.
Entry price: 16.62
First target: 16.80
Second target: 17.00
Third target: 17.24

ETCUSDT: Breakdown or Bounce? A Critical Move Is Coming!Yello, Paradisers! Is ETCUSDT about to collapse further, or are the bulls ready to fight back? Let’s break it down!
💎#ETCUSDT remains in a strong downtrend, continuously rejecting the descending resistance and struggling to hold above key levels. Recently, the price tested the imbalance zone at $18.995 but got smacked down, a clear sign that sellers are still in control.
💎Adding further bearish confirmation, the 50 EMA has crossed below the 200 EMA, reinforcing the downside momentum. This classic death cross signals that sellers have the upper hand, increasing the probability of further declines.
💎If ETC retests the $18.995 supply zone and faces rejection again, expect another leg down toward $17.590 and potentially the major support at $16.576. A failure to find strong buying interest at these levels would confirm further downside continuation.
💎However, if ETC manages to break and hold above $18.995, it could signal strength. In this case, price may push toward $21.288, but it must first clear $19.288 with strong volume to invalidate the bearish setup. A confirmed breakout would shift momentum bullish, opening the door for a potential rally toward $22 and beyond.
Stay patient, Paradisers! The market always rewards discipline. If we see confirmation, we take action. If not, we wait. Trade smart, not fast! 🎖
MyCryptoParadise
iFeel the success 🌴

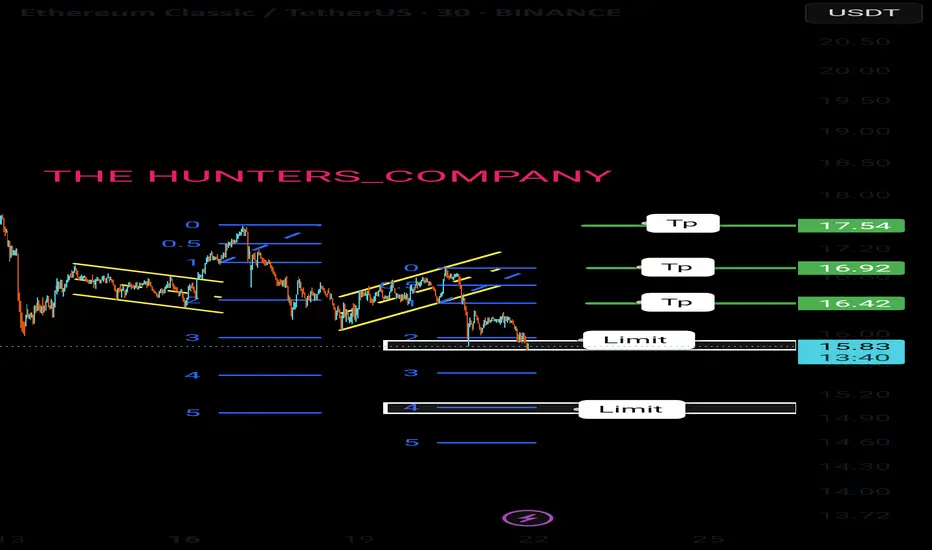
ETC LONGAnalysis:
We are currently observing an accumulation phase in the market as the price tests a significant support level. This area is crucial for determining if the market will rebound or break further down.
The monthly open is highlighted, showing that price action has been trading below this level.
A potential breakout to the upside is expected, with the conservative target set around $32. This aligns with previous resistance zones, where price has struggled to break above.
If the price breaks above the $32 mark, the next potential target would be near the PMH (Previous Monthly High) at around $40.
Trade Plan:
Buy at current price levels near $24.34 with a stop loss just below the support (around $21).
Target 1: $32 (Conservative Target)
Target 2: $40 (PMH)
Risk Management:
Keep stop-loss orders below the accumulation zone to limit risk in case of a breakdown.
Note:
This setup is based on technical analysis and assumes that the market continues to show signs of a bullish reversal. Keep track of broader market trends and adjust accordingly.

etc usdt"🌟 Welcome to Golden Candle! 🌟
We're a team of 📈 passionate traders 📉 who love sharing our 🔍 technical analysis insights 🔎 with the TradingView community. 🌎
Our goal is to provide 💡 valuable perspectives 💡 on market trends and patterns, but 🚫 please note that our analyses are not intended as buy or sell recommendations. 🚫
Instead, they reflect our own 💭 personal attitudes and thoughts. 💭
Follow along and 📚 learn 📚 from our analyses! 📊💡"

#ETC/USDT#ETC
The price is moving in an ascending channel on the 12-hour frame and is sticking to it to a large extent
We have a bounce from a major support area in green at 17.70
We have a downtrend on the RSI indicator that was broken upwards, which supports the upward trend
We have a trend to stabilize above the 100 moving average, which supports the upward trend
Entry price 18.40
First target 20.38
Second target 22.33
Third target 24.37

ETC ( Ethereum Classic ) tm:1hHello traders.
I hope you doing well.
These areas are based on my personal strategy and I will share it with you.
Open a sell position on the supply area or open a buy position on the demand area.
Your entry point, stop loss, and target point are based on money management and the amount of money in your trading account.
But I promise you that by trading in the areas of my trading strategy, you will definitely make a profit, because these areas, although they seem simple, are my experience of 8 years of learning and trading.
I hope you will achieve maximum continuous profit with me by using supply and demand areas.
Good luck traders.
Mohammad Goodarzi

#ETC/USDT#ETC
We have a bullish trend pattern on a 4-hour frame, the price moves based on it and adheres to its limits well
We have a tendency to stabilize above moving average 100
We have an uptrend on the RSI indicator that supports the price higher
Entry price is 26.00
The first goal is 27.87
Second goal 30.16
Third goal 32.15

ETC USDTETC Setup. After a confirmed breakout from the marked zone in green, we could take an entry at 36.10 Remember stop loss is your friend. Everything is on the chart.
Entry 36.10
S.L 33.02
T.P 1 37.76
T.P 2 40.56
T.P 3 44.03

ETC USDTETC Setup. After a confirmed breakout from the marked zone in green, we could take an entry at 32.57. Remember stop loss is your friend. Everything is on the chart.
Entry 32.57
S.L 30.69
T.P 1 34.72
T.P 2 36.89
T.P 3 38.67
