#ETC/USDT#ETC
The price is moving in an ascending channel on the 12-hour frame and is sticking to it to a large extent
We have a bounce from a major support area in green at 17.70
We have a downtrend on the RSI indicator that was broken upwards, which supports the upward trend
We have a trend to stabilize above the 100 moving average, which supports the upward trend
Entry price 18.40
First target 20.38
Second target 22.33
Third target 24.37
ETCUSD

Target-1: $ 50ETC- Trade Plan (No. (1))
Short-term overview
Bias: Bullish
Trade entry: $ 23 -$ 25
Stop level: $ 20
Target-1: $ 50
Target-2: $ 77
Appendix: Oct 29, 2024
Fundamental:

Something has changed! The SEC gives us the chance ...We may have new ATH
Technical Section:
In logical terms, the chart tells us that the market is at the start of a new trend (should be an automatic buy for us). The next move, will be sharp.

Ethereum Classic (ETC) +3000%I bet 3% of my deposit that ETC will grow following ETH in this cycle. Start - launch of ETH ETF
Let's go

Ready to explode higherChance favors the prepared mind (Louis Pasteur).
Are You Ready?
Trade Plan:
Long-term overview
Bias: Bullish
Date: 29 Nov 2024
Price: $ 2633
Structure: 5-3-5 (Inverted)
Trade entry: $ 2633
Target-1: $ 5775
Target-2: $ 6900
Stop: $ 2000

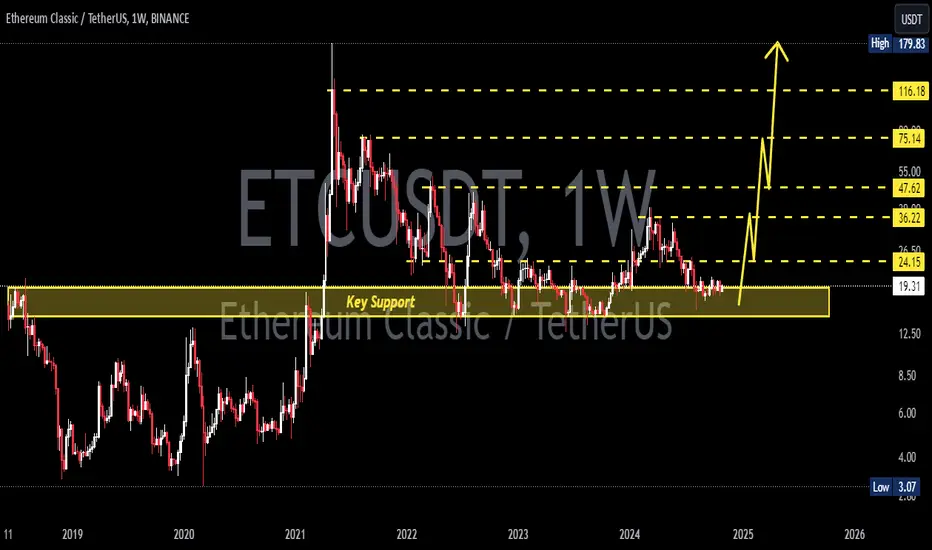
ETCUSDTETC ~ 1W
#ETC So far it continues to maintain this support block. Buy in stages here. with a target of at least 20%++ from here.
Bullish Surge Ahead? Key Levels ETC Must Hold to Skyrocket!ETC/USDT Analysis
ETC (Ethereum Classic) is in a down trend after making high in March and trading within a descending channel. The price is consolidating between support zone Purple at $16.48 to $17.19 and resistance zone Blue at $20.90 to $21.56.
Bullish Scenario
For a convincing breakout, ETC needs to surpass the resistance zone Blue at $20.90 to $21.56. If it manages to break and hold above this level, it could attract further buying interest.
In this bullish path, the next major resistance zone to watch is at $24.74 to $25.36 in Yellow. Breaking through this could set the stage for a move towards the resistance zone in Pink at $29.72 to $30.46 .
Look for strong bullish candles with increasing volume to confirm a breakout, minimizing the risk of a false move.
Bearish Scenario
If ETC fails to sustain above support zone Purple at $16.48 to $17.19 and shows signs of weakening, sellers may attempt to push the price lower.
A break below the Pink support zone could expose ETC to further downside risks, with the next significant support around $14.48.
A breakdown below $14.48 could accelerate the decline, potentially challenging even lower support levels and indicating a bearish trend continuation.
As long as ETC maintains support above $16.48 - $17.19, the bulls retain a chance to initiate a rally. However, a break below this zone could signal increasing bearish pressure, with significant downside potential if lower supports are tested.
Everything is marked on the chart

Bitcoin Buy Opportunity After Strong Confirmation Signal!We are watching for an excellent buy opportunity on Bitcoin! If the daily candle closes above the green rectangle, this will be a clear signal to enter a buy trade. The stop loss will be placed below the red rectangle, with take profit set at the blue rectangle.
Stay tuned for more updates, and if you need a personalized analysis on any financial asset, feel free to contact me in private!

ETC — August 2024 ATHBITFINEX:ETCUSD is not a clone of BITSTAMP:ETHUSD , but a continuation of the original Ethereum launched in 2015, which The Ethereum Foundation forked away from by launching a new protocol one year later in 2016.
Applications on BITFINEX:ETCUSD have been operating uninterrupted for a year longer than on Ethereum™, making ETC the longest-running and most reliable Smart Contract Platform.
This analysis suggests that BITFINEX:ETCUSD is likely to reach all-time high in August 2024.
NFA. DYOR.

ETCUSDTETC ~ 1W
#ETC If you have Conviction on this coin,. This is a great time to start buying again. So far this support block has been able to withstand selling pressure on sellers. this proves the Buyer is stronger.

Ehthereum classic📊 #ETCUSDT
⏱ TIME: 1D
📝Two suitable buying ranges have been specified (purple box) and the price is expected to move up from these two ranges.
⭕️risk:MID
📍The initial buying limit: 14.5$ AND 13$
📌TP1: 20%
📌TP2: 40%

ETC Price Update in 3-Day TimeframeETC has precisely hit the entry range between $14.7 and $16.4. The current price is $19.38, which is a 24% increase from the lower range.
The rebound, along with the RSI, indicates a bullish divergence. If the price continues to stay bullish, we are likely to see ETC reaching the $30 range very soon.
The targets remain the same, with primary support at $18 and lower support at $14.7.
DYOR. NFA.
Please hit the like button to support my content and share your thoughts in the comment section. Feel free to request any chart analysis you’d like to see!
Thank you!
#PEACE

ETC/USDT Trading ScenarioAfter reaching a local high of $39.65, the price of ETC sharply corrected to $18.15, a drop of over 50%. According to the volume profile, the price fell into a local accumulation zone near the Point of Control (POC), from which a reversal movement began. Additionally, there was a third touch of the descending support level. In the current price range, buying the asset is appealing both for adding to a long-term portfolio and for a speculative trade, with potential to close the position around the resistance level of $39.65.

ETC/USD Main trend. Fractal cyclic structureLogarithm. Time frame 1 week. The main trend.
Duplicated on the exchange OKX, a little added to understand the logic and accuracy, as on the exchange poloniex, there is no liquidity. If something happens to have an idea on a more liquid exchange. As this cryptocurrency is interesting.
Major trend. Channel. Publication 01 2023
Linear Now in Moment.
Local now at the moment.
Locally. Let me remind you that from the main zone of the cryptocurrency set (horizontal channel) the average price is now exactly +84%. Compared to other assets, during the transition from the accumulation phase to the participation phase (Dow), the price did not increase very much compared to other cryptocurrencies. That is, a conditionally lagging asset.
A triangle is forming . In a localized rising set trend. From this zone, about 40-50% left to the rounded bottom resistance zone (final accumulation phase).
Then it will be business as usual, on stocks or liquid cryptocurrencies. Breakout of resistance, perhaps not immediately, but that's not the point. After breakout, consolidation, then re test and news negative/positive. Confirmation, and the beginning of strong, conditionally irrevocable impulsive movements into the zone of “news perspective of this blockchain”.
This is when ETH will be above or near $10,000. This will be its first consolidation — a partial reset before being pulled into the final reset (distribution) price zone. In this consolidation, not up to the maximum prices, the progenitor of expensive ether, that is, ETC, as before, will surprise everyone with an aggressive news background. With a high degree of probability, all speculative games, as in the last cycle during pumping, will be “slightly wavy”. Don't forget to sell and don't be greedy...
For those who are not traders at all. So which of the hamsters has iron balls, throw in a couple of hundred dollars and forget it, conditional retention without trading for 9, 13 and 19 months. Sold in 3 parts (optional). But, if you don't sell, you will get scared between these market pumping “time zones” and sell everything during the “fear”. If there is profit in advance, then it “warms the soul” and the feeling of lost profits will not play a cruel joke.
Money management. Leave a third of the invested money in dollars, for additional purchases, in case there is a spill in the market (only 1 significant, sharp, unexpected). Ignore everything else, there will be enough coins to earn money. If the dollars are not spent and the price flies away, do not buy crypto candy wrappers, but buy a gift for your loved ones.
I am sure that many hamsters , when a trend allows absolutely everyone to make money, will imagine that they are real traders and decide to increase the number of coins. I am 99.9% sure that on futures (your psychology is known in advance) if you take inadequate risks, you will lose all coins up to half the maximum price.
⚠️ Adequately evaluate your skills and behavior . Therefore, for some people who are relatively poor but want to become rich, very quickly, it is better not to trade or even be interested in the market until the market is in the distribution cycle, that is, the highs (late 2024 and 2025). Otherwise, each local peak (as always) in a growing trend will be perceived as the end, and when the end comes, on the contrary, as not yet a maximum.

Target-3 = $ 300
Chart pattern on monthly. I really like using higher time frames.
Target-1 = $ 45
Target-2 = $ 95
Target-3 = $ 300
MACD (Daily Timeframe, Buy signal):
Backdrop:

ETC ( Ethereum Classic ) tm:1hHello traders.
I hope you doing well.
These areas are based on my personal strategy and I will share it with you.
Open a sell position on the supply area or open a buy position on the demand area.
Your entry point, stop loss, and target point are based on money management and the amount of money in your trading account.
But I promise you that by trading in the areas of my trading strategy, you will definitely make a profit, because these areas, although they seem simple, are my experience of 8 years of learning and trading.
I hope you will achieve maximum continuous profit with me by using supply and demand areas.
Good luck traders.
Mohammad Goodarzi

Ethereum Classic ETC 300$ on bullrun cycleOn my chart you can see accumulation phase from 12$ to 50$ , price can't broke the support level 12$ since January 2022. Also there are one more accumulation inside with range 12$ to 26$ which continues from December 2022 - 1 year of accumulation phase. On lower timeframe you can see how price works with lower liquidity and also leave compression of liqiudities which will be the fuel for bullish movement, the same view was on previous bullrun. If you enter right now and wait a time , you can easily hold ETC before ATH happen, it will be 10x from enter. The same situation with ETC/BTC and ETC/ETH , price works well with lower liquidity . Also miners can't mining ETH and a lot of people decided mining Ethereum Classic , also I believe ETH can help his brother ETC to pump coin . MAX marketcap of ETC was 14b, and that time when Litecoin had 22b, Chainlink - 20b.

#ETC/USDT#ETC
We have a bullish trend pattern on a 4-hour frame, the price moves based on it and adheres to its limits well
We have a tendency to stabilize above moving average 100
We have an uptrend on the RSI indicator that supports the price higher
Entry price is 26.00
The first goal is 27.87
Second goal 30.16
Third goal 32.15

Ethereum Classic 💚 ETC price will be $100 👇When will CRYPTOCAP:ETC be at $100? We'll talk a little later...)
And now about what happened yesterday with the ETH ETF.
In short, it was accepted, but not completely...
That is, sooner or later, ETH ETFs will be accepted by the form of S-1s and another gateway will open for the infusion of “big capital” into the crypto market.
Therefore:
🔹The long-term outlook is also realistic and works well
By the way, for those who don't know, the firstborn in the quarreling #Ethereum family was CRYPTOCAP:ETC which was surpassed in all respects in development by its fork - CRYPTOCAP:ETH
⌛ From history, the #ETCUSDT price has been holding in protracted consolidations for a long time, accumulating positions and eventually organizing a powerful growth trend.
Now, the support zone for the #ETCUSD price is $28.70-30.00.
If they hold it, then the blue scenario becomes more than realistic with an intermediate or final point of $100 per #ETC

ETC Double Top This BME:ETC Double top plus Fair Value Gap will play out BIG from here🔥
Waiting for the Blood Bath🩸
My short targets and sl is mentioned on the chart. Good Luck💵
#dyor #nfa #aqeelonline

ETC USDTETC Price Update
If the price holds this support zone from 22.84 to 24.09 we could take some entry and if it drops from hear then we do DCA at the next level at 19.14.
there is less chance that it will drop from here.
T.P 1 29.68
T.P 2 34.87
T.P 3 39.63
T.P 4 45.41

ETCUSDT Bullish Opportunity with XABCD Harmonic PatternOverview:
ETC/USDT has exhibited the formation of an XABCD harmonic pattern, coinciding with price action nearing a crucial support zone. This confluence suggests a potential bullish reversal from point D, indicating favorable trading opportunities for market participants.
Key Technical Observations:
1. XABCD Harmonic Pattern: The chart analysis reveals the emergence of an XABCD harmonic pattern, characterized by distinct price swings that conform to Fibonacci ratios. This pattern indicates a potential reversal zone, with point D signaling a probable shift in market direction.
2. Key Support Area: Price action has approached a significant support area, enhancing the likelihood of a bullish rebound. The convergence of the harmonic pattern and the support zone strengthens the validity of the anticipated bullish move.
Trade Recommendations:
- Entry: Consider initiating a long position near 32.8150, aligning with the anticipated bullish reversal at point D of the harmonic pattern.
- Stop Loss: Implement a stop-loss order at approximately 31.1750 to mitigate potential losses in case of adverse price movements.
- Take Profit Targets:
1. TP-1: Set the first take-profit level at 34.5800 to secure profits as the price advances in the bullish direction.
2. TP-2: Aim for the second take-profit level at 36.1933 to capitalize on further upward momentum.
3. TP-3: Consider a third take-profit target at 37.8760 to maximize returns as the bullish trend potentially extends.
Risk Management:
Maintain prudent risk management practices by adhering to the specified stop-loss level and adjusting position sizes according to individual risk tolerance. Periodically reassess the market conditions to adapt trading strategies accordingly.
Conclusion:
In summary, the technical analysis of ETC/USDT suggests a favorable outlook for bullish opportunities, supported by the formation of an XABCD harmonic pattern and price action nearing a critical support area. Traders are advised to consider the provided trade setup, incorporating appropriate risk management measures to optimize potential returns while safeguarding against downside risks.

ETC/USD Main trend. Channel.Logarithm. Time frame 1 week. The main trend. Idea for understanding where the price is in the main trend.
Linear chart for clarity and understanding of local cycles.
Secondary trend
ETC/USD Secondary trend. Downtrend channel. Pivot zones.
