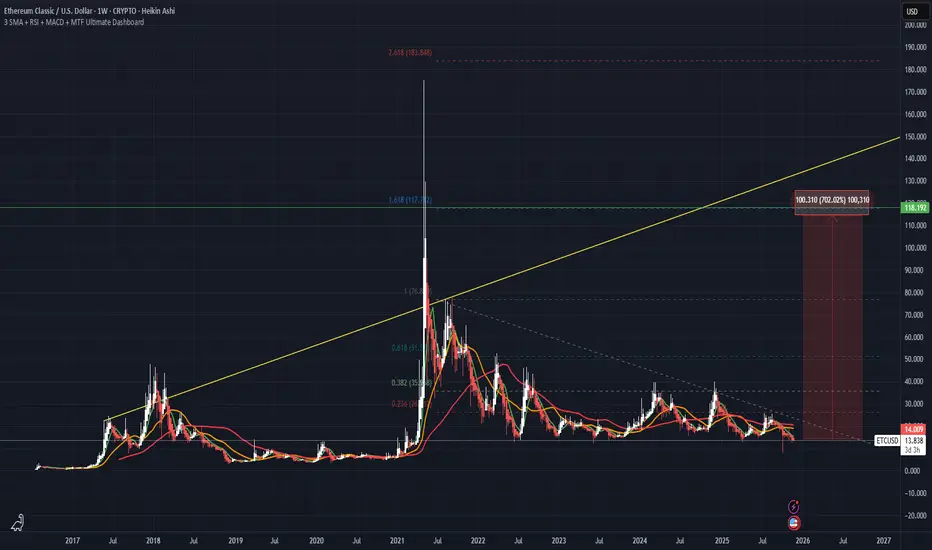
ETCUSD - Upside Potential 700% (Check ETCETH also)Hi.
Considering the low price and decent fundamentals, ETC is a good entry.
Not a trading advice.
Thanks
Gex
ETCUSDC
ETCUSDT — The Final Defense Zone Before a Major Move?Ethereum Classic (ETC) is once again standing at its final line of defense — the multi-year support zone between 16.40–13.50, which has successfully absorbed selling pressure several times since 2021.
This area is not just a price range; it’s a psychological stronghold that separates the potential for a massive rebound from the risk of a full-scale breakdown.
For more than three years, ETC has been forming a range-base accumulation structure, where every dip into this zone has triggered strong buying interest.
However, each rally has also failed to create higher highs — a clear signal that supply pressure remains dominant in the mid-term structure.
At this point, the market is in equilibrium — a tension zone between buyers defending the historical base and sellers pressing for continuation.
The next decisive move will be determined right here, inside the yellow block.
---
Bullish Scenario — Reclaim and Rally
If price holds above 16.40 and manages to close a weekly candle above 20.94 with strong buying volume, ETC could begin a structural reversal toward 24.95 and 36.85.
Such a move would confirm that the capitulation phase has ended and that a new accumulation cycle is underway.
Key confirmations:
Weekly close above 20.94
Higher low formed above 16.4
Rising weekly volume
Upside targets:
24.95 → 36.85 → 48.30
---
Bearish Scenario — Breakdown of the Base
Failure to defend the zone, especially with a weekly close below 13.50, would confirm a breakdown of the multi-year base.
This could trigger a new distribution phase, with potential downside targets at 11.00, 8.00, and possibly a wick toward 7.00 as liquidity gets swept.
Key confirmations:
Weekly close below 13.50
Failed retest (support turns to resistance)
Increasing sell volume
Downside targets:
11.20 → 8.00 → potential liquidity sweep near 7.00
---
Pattern Structure
Range Base Accumulation: multi-year accumulation between 13–36 since 2021.
Descending Structure: a series of lower highs, showing continuous supply pressure.
Liquidity Sweep: a deep wick to the 7.0 area indicates previous stop-hunts and possible smart-money accumulation.
Decision Point: 16.4–13.5 remains the make-or-break level that will define ETC’s long-term direction.
---
Conclusion
ETC is at a major decision point after years of sideways consolidation.
If the support holds, the asset could trigger a macro reversal and join the next major crypto bull cycle.
But if it breaks down, the fall could be steep — as liquidity below this zone is thin.
The 16.4–13.5 zone is the last line between hope and capitulation.
Watch the weekly close — that’s where the next big move will be decided.
---
#ETC #ETCUSDT #EthereumClassic #CryptoAnalysis #SwingTrading #TechnicalAnalysis #SupportResistance #WeeklyChart #CryptoBreakout #MarketStructure

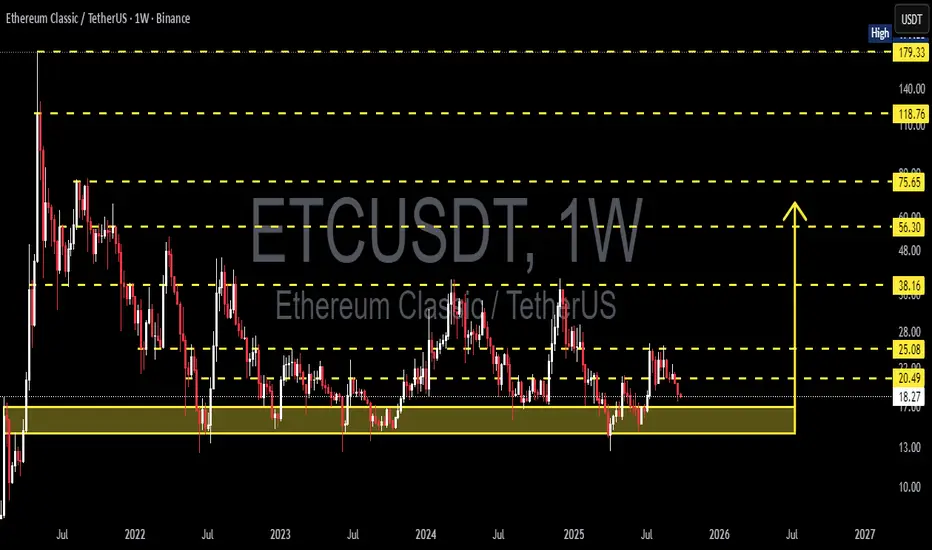
ETC/USDT — Major Support Retest, Breakout or Breakdown?🔎 Current Market Outlook
Current price: ~20.49 USDT
Price is approaching the critical support zone at 17–14 USDT (highlighted yellow).
This area has acted as a multi-year demand zone since 2021, where buyers repeatedly defended the level and triggered rebounds.
However, ETC has consistently failed to break major resistance levels, forming lower highs within a prolonged sideways range.
This makes the 17–14 zone a decision point: will buyers once again absorb supply and push for a rebound, or will sellers finally break the structure and trigger a deeper bearish trend?
---
📐 Market Structure & Price Pattern
1. Major Support Zone (17–14 USDT):
Tested multiple times since 2021.
Holding above → suggests strong accumulation.
Breaking below → could end the long-term sideways trend.
2. Key Resistance Levels:
25.08 USDT → first resistance to watch for breakout.
38.16 USDT → medium-term resistance.
56.30 & 75.65 USDT → major long-term supply zones.
Higher targets: 118.76 & 179.33 USDT (only relevant in a super bullish cycle).
3. Price Pattern:
Large sideways structure with lower highs.
Repeated tests of 17–14 → showing this demand zone is still crucial for market direction.
---
🐂 Bullish Scenario (If Buyers Defend)
Confirmation: Weekly close above 25.08 with strong volume.
Implication: Signals a new higher high on the weekly timeframe.
Targets:
TP1 → 38.16
TP2 → 56.30
TP3 → 75.65
Key Note: As long as 17–14 holds, ETC remains in accumulation territory with potential for a strong rebound in the next bullish phase.
---
🐻 Bearish Scenario (If Sellers Break Through)
Confirmation: Weekly close below 14 USDT.
Implication: Multi-year demand zone is invalidated.
Targets: Without solid support below, price could drop towards the psychological 10 USDT level or even lower.
Warning: A breakdown here would mark the end of the long-term sideways phase and trigger a deeper bearish leg.
---
🎯 Trading Strategy & Risk Management
1. Conservative Approach:
Wait for breakout >25.08 → enter long.
Targets: 38.16–56.30.
Stop loss below 22.
2. Aggressive Approach (buy the zone):
Enter within 17–14.
Stop loss below 14.
First target 25.08, scale out at 38.16.
3. Short Setup:
Only valid if weekly close <14 (confirmed breakdown).
Short-term target: 12 → 10 USDT.
⚠️ Note: This is a high risk/reward zone. Position sizing and clear stop-loss levels are critical.
---
✨ Conclusion
The 17–14 USDT support zone is ETC’s lifeline.
Holding above → accumulation continues, with rebound potential toward 25.08 → 38.16.
Breaking below 14 → long-term bearish breakdown with risk of a sharp decline.
Breakout above 25.08 → the first real trigger of a bullish trend reversal.
ETC is at a make-or-break moment. Traders should closely watch how weekly candles react around 17–14.
---
#ETC #EthereumClassic #Crypto #Altcoins #TechnicalAnalysis #PriceAction #SwingTrade #SupportResistance #CryptoAnalysis #ChartPatterns
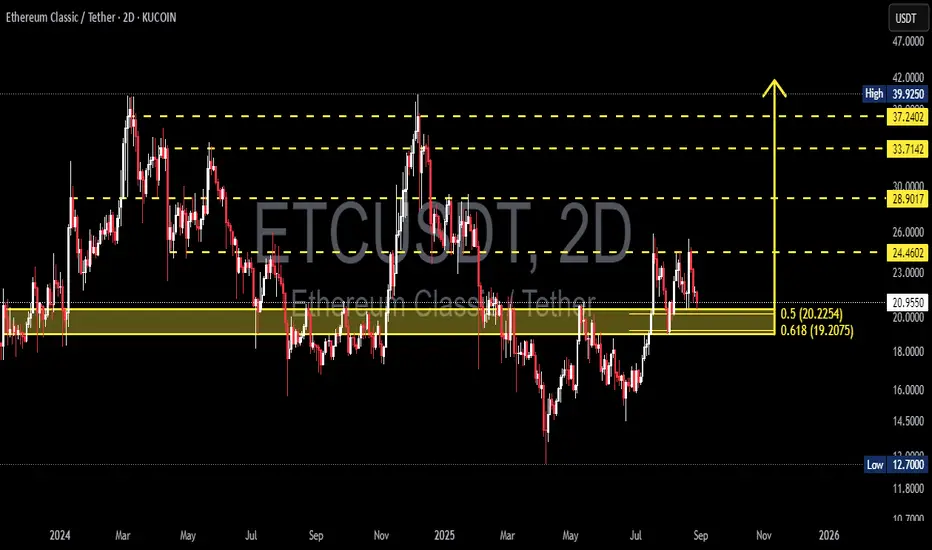
ETC/USDT — Testing Golden Pocket: Rebound or Breakdown?Ethereum Classic (ETC) is currently at a critical decision zone after being rejected around the 24.46 USDT resistance. The price has now pulled back into the Fibonacci golden pocket (0.5–0.618) at 20.22–19.20 USDT, a key support zone that previously acted as a major flip level (resistance → support).
This area carries heavy significance as it has served as a battleground for liquidity multiple times. The reaction here will likely determine whether ETC continues its mid-term bullish structure or slips back into a deeper bearish trend.
---
🔎 Market Structure & Pattern
Mid-term structure: ETC is trading within a wide range between the historical support of 12.70 and the upper resistance near 39.93.
Short-term focus: The 19.20–20.22 golden pocket is the decision point for the next move.
Bullish bias holds as long as this level remains intact.
Bearish risk emerges if the golden pocket fails, triggering a deeper breakdown.
---
🚀 Bullish Scenario
1. Strong rejection at the golden pocket with bullish reversal candles (engulfing / pin bar) → buyer confirmation.
2. Short-term target: 24.46 (nearest resistance).
3. Break and close above 24.46 on the 2D timeframe opens upside targets at 28.90 → 33.71 → 37.24 → 39.93.
4. Supporting signals: RSI holding above 50 + volume expansion on breakout.
---
⚠️ Bearish Scenario
1. Breakdown confirmed if the 2D candle closes below 19.20 → support failure.
2. Downside targets: 16.00 → 14.50 → 12.70 (historical low).
3. A weak bounce forming only a lower high below 24.46 would strengthen bearish continuation.
4. Confirmation: high volume on breakdown + strong bearish candles without lower wicks.
---
📝 Trader’s Notes
The golden pocket zone (19.20–20.22) is the decision point for the next macro move.
Aggressive traders may consider longs here with tight stops below 18.00.
Conservative traders should wait for a confirmed breakout above 24.46 before entering.
Risk management is crucial: aim for at least 1:2 risk-to-reward ratio.
---
📌 Key Levels
Support: 19.20–20.22
Nearest resistance: 24.46
Bullish targets: 28.90 → 33.71 → 37.24 → 39.93
Bearish targets: 16.00 → 14.50 → 12.70
#ETCUSD #EthereumClassic #ETC #CryptoAnalysis #Altcoin #TechnicalAnalysis #SupportResistance #Fibonacci #PriceAction #SwingTrade
Ethereum Classic (ETC) forming bullish Shark for upto 10% pumpHi dear friends, hope you are well and welcome to the new update on Ethereum Classic (ETC) with US Dollar pair.
Our last trade of ETC was below:
Now on a 4-hr time frame, ETC is about to complete a bullish Shark move for another bullish reversal move soon.
Note: Above idea is for educational purpose only. It is advised to diversify and strictly follow the stop loss, and don't get stuck with trade

ETC ETHEREUM CLASSIC Ready for Breakout - ETCBTC ETCUSDTETC ETHEREUM CLASSIC Ready for Breakout - ETCBTC ETCUSDT
