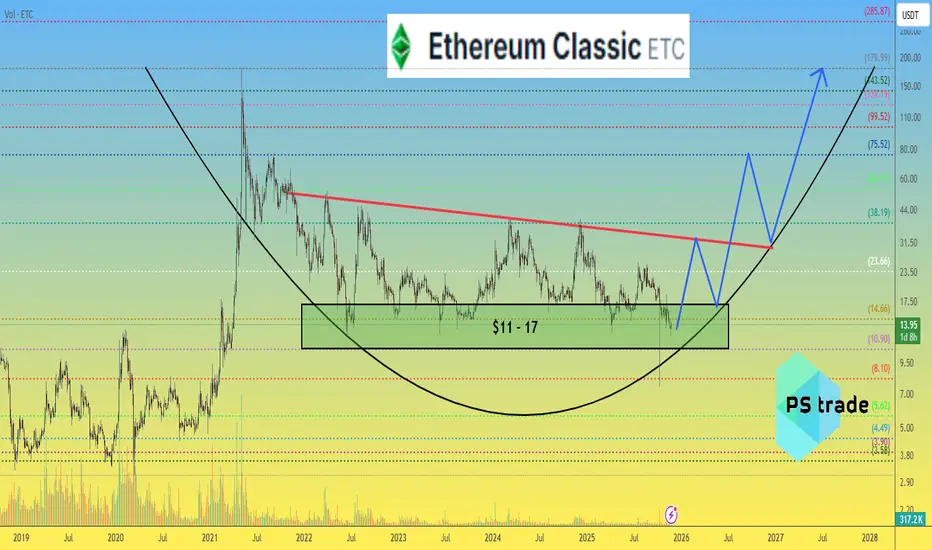
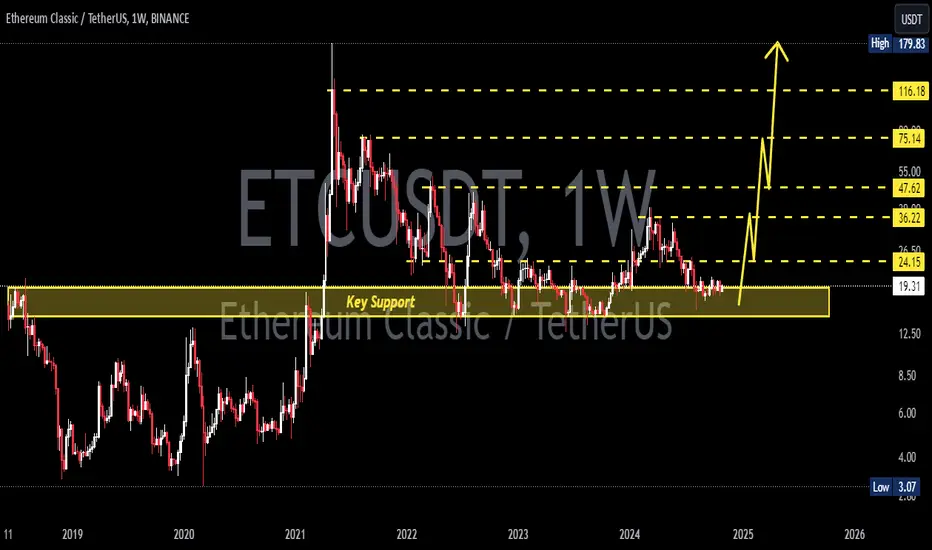
Ethereum Classic ETC price analysis#ETC continues to respect a well-defined multi-year support range at $11–17, which has historically served as a base for upward expansions.
Key resistance levels to watch:
• $32 • $75 • $180
The current market capitalization of $2.15B suggests that even a 2x–5x-10x appreciation would be noticeable for chart analysts, but insufficient to shift broader market dynamics.
Nevertheless, #ETC remains relevant for traders monitoring undervalued legacy assets with long accumulation phases.
Question:
Do you consider OKX:ETCUSDT a viable mid-cycle opportunity, or is its structural momentum too weak for strong upside continuation?
______________
◆ Follow us ❤️ for daily crypto insights & updates!
🚀 Don’t miss out on important market moves
🧠 DYOR | This is not financial advice, just thinking out loud
ETCUSDTPERP
ETCUSDT — The Final Defense Zone Before a Major Move?Ethereum Classic (ETC) is once again standing at its final line of defense — the multi-year support zone between 16.40–13.50, which has successfully absorbed selling pressure several times since 2021.
This area is not just a price range; it’s a psychological stronghold that separates the potential for a massive rebound from the risk of a full-scale breakdown.
For more than three years, ETC has been forming a range-base accumulation structure, where every dip into this zone has triggered strong buying interest.
However, each rally has also failed to create higher highs — a clear signal that supply pressure remains dominant in the mid-term structure.
At this point, the market is in equilibrium — a tension zone between buyers defending the historical base and sellers pressing for continuation.
The next decisive move will be determined right here, inside the yellow block.
---
Bullish Scenario — Reclaim and Rally
If price holds above 16.40 and manages to close a weekly candle above 20.94 with strong buying volume, ETC could begin a structural reversal toward 24.95 and 36.85.
Such a move would confirm that the capitulation phase has ended and that a new accumulation cycle is underway.
Key confirmations:
Weekly close above 20.94
Higher low formed above 16.4
Rising weekly volume
Upside targets:
24.95 → 36.85 → 48.30
---
Bearish Scenario — Breakdown of the Base
Failure to defend the zone, especially with a weekly close below 13.50, would confirm a breakdown of the multi-year base.
This could trigger a new distribution phase, with potential downside targets at 11.00, 8.00, and possibly a wick toward 7.00 as liquidity gets swept.
Key confirmations:
Weekly close below 13.50
Failed retest (support turns to resistance)
Increasing sell volume
Downside targets:
11.20 → 8.00 → potential liquidity sweep near 7.00
---
Pattern Structure
Range Base Accumulation: multi-year accumulation between 13–36 since 2021.
Descending Structure: a series of lower highs, showing continuous supply pressure.
Liquidity Sweep: a deep wick to the 7.0 area indicates previous stop-hunts and possible smart-money accumulation.
Decision Point: 16.4–13.5 remains the make-or-break level that will define ETC’s long-term direction.
---
Conclusion
ETC is at a major decision point after years of sideways consolidation.
If the support holds, the asset could trigger a macro reversal and join the next major crypto bull cycle.
But if it breaks down, the fall could be steep — as liquidity below this zone is thin.
The 16.4–13.5 zone is the last line between hope and capitulation.
Watch the weekly close — that’s where the next big move will be decided.
---
#ETC #ETCUSDT #EthereumClassic #CryptoAnalysis #SwingTrading #TechnicalAnalysis #SupportResistance #WeeklyChart #CryptoBreakout #MarketStructure

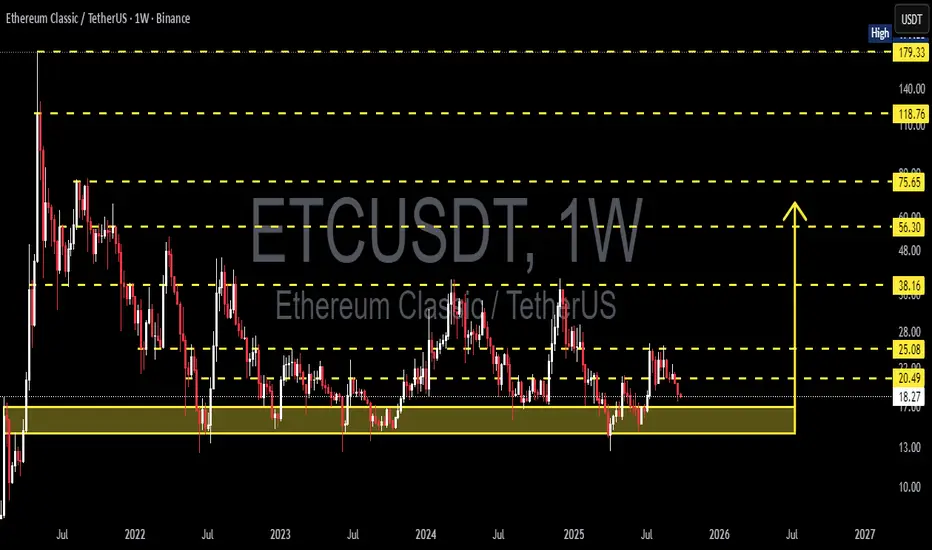
ETC/USDT — Major Support Retest, Breakout or Breakdown?🔎 Current Market Outlook
Current price: ~20.49 USDT
Price is approaching the critical support zone at 17–14 USDT (highlighted yellow).
This area has acted as a multi-year demand zone since 2021, where buyers repeatedly defended the level and triggered rebounds.
However, ETC has consistently failed to break major resistance levels, forming lower highs within a prolonged sideways range.
This makes the 17–14 zone a decision point: will buyers once again absorb supply and push for a rebound, or will sellers finally break the structure and trigger a deeper bearish trend?
---
📐 Market Structure & Price Pattern
1. Major Support Zone (17–14 USDT):
Tested multiple times since 2021.
Holding above → suggests strong accumulation.
Breaking below → could end the long-term sideways trend.
2. Key Resistance Levels:
25.08 USDT → first resistance to watch for breakout.
38.16 USDT → medium-term resistance.
56.30 & 75.65 USDT → major long-term supply zones.
Higher targets: 118.76 & 179.33 USDT (only relevant in a super bullish cycle).
3. Price Pattern:
Large sideways structure with lower highs.
Repeated tests of 17–14 → showing this demand zone is still crucial for market direction.
---
🐂 Bullish Scenario (If Buyers Defend)
Confirmation: Weekly close above 25.08 with strong volume.
Implication: Signals a new higher high on the weekly timeframe.
Targets:
TP1 → 38.16
TP2 → 56.30
TP3 → 75.65
Key Note: As long as 17–14 holds, ETC remains in accumulation territory with potential for a strong rebound in the next bullish phase.
---
🐻 Bearish Scenario (If Sellers Break Through)
Confirmation: Weekly close below 14 USDT.
Implication: Multi-year demand zone is invalidated.
Targets: Without solid support below, price could drop towards the psychological 10 USDT level or even lower.
Warning: A breakdown here would mark the end of the long-term sideways phase and trigger a deeper bearish leg.
---
🎯 Trading Strategy & Risk Management
1. Conservative Approach:
Wait for breakout >25.08 → enter long.
Targets: 38.16–56.30.
Stop loss below 22.
2. Aggressive Approach (buy the zone):
Enter within 17–14.
Stop loss below 14.
First target 25.08, scale out at 38.16.
3. Short Setup:
Only valid if weekly close <14 (confirmed breakdown).
Short-term target: 12 → 10 USDT.
⚠️ Note: This is a high risk/reward zone. Position sizing and clear stop-loss levels are critical.
---
✨ Conclusion
The 17–14 USDT support zone is ETC’s lifeline.
Holding above → accumulation continues, with rebound potential toward 25.08 → 38.16.
Breaking below 14 → long-term bearish breakdown with risk of a sharp decline.
Breakout above 25.08 → the first real trigger of a bullish trend reversal.
ETC is at a make-or-break moment. Traders should closely watch how weekly candles react around 17–14.
---
#ETC #EthereumClassic #Crypto #Altcoins #TechnicalAnalysis #PriceAction #SwingTrade #SupportResistance #CryptoAnalysis #ChartPatterns
ETCUSDT 1W Analysis ETC ~ 1W Analysis
#ETC Buy back in increments from here with a short term target of at least 20%+ and a long term target of $80

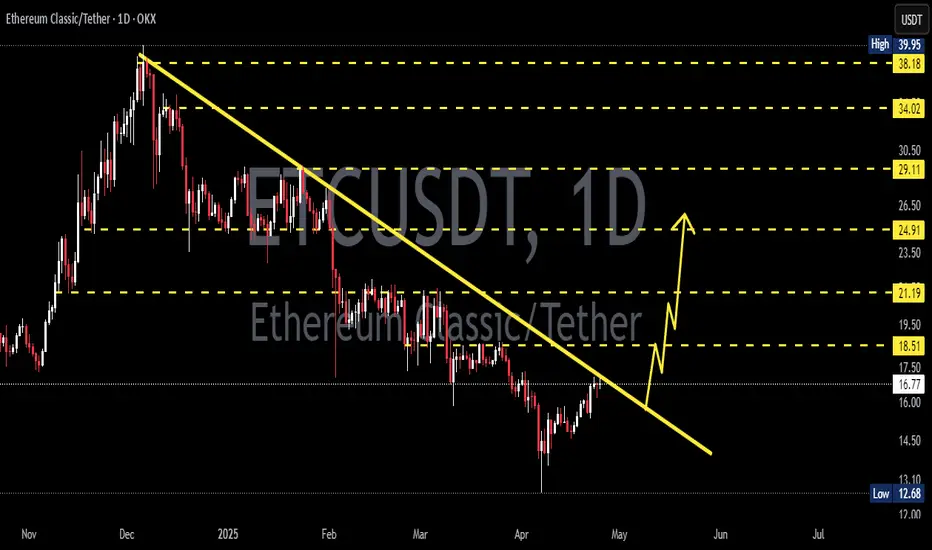
ETCUSDT 1D AnalysisETC ~ 1D Analysis
#ETC Buy incrementally on this support block with a short term target of at least 15%+ from here.

ETCUSDT 1D AnalysisETC ~ 1D Analysis
#ETC Buy after successfully penetrating this resistant line with a large volume, a minimum target of 10%+.
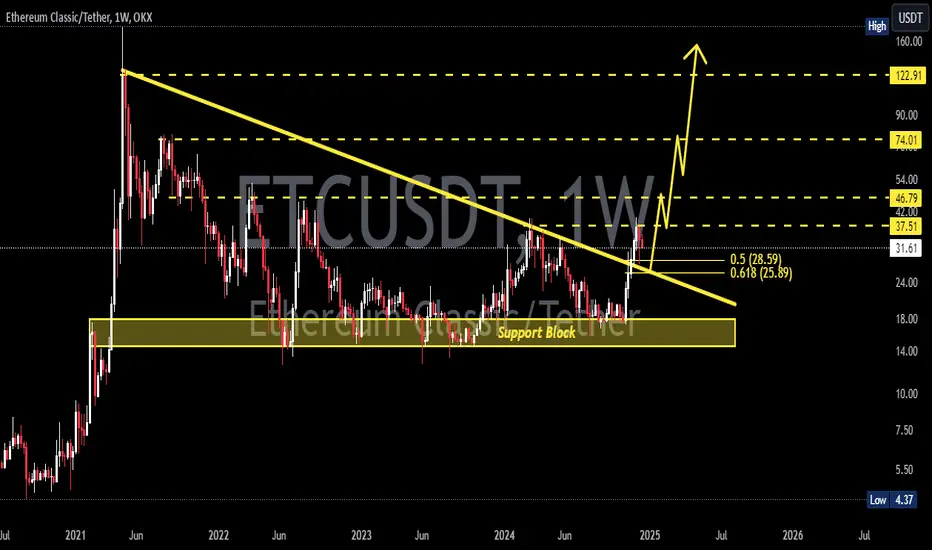
ETCUSDT 1WETC ~ 1W Analysis
#ETC Buy gradually from here if you still have a Conviction on this Coin with a minimum target of 20%+

ETCUSDT 1WETC Update ~ 1W
#ETC Entering the Bullish phase., If you still have Conviction on this coin,. Buy gradually on this Golden Fibonacci. With a minimum target of 20%++
Ethereum Classic ETC price is just starting to riseGod willing, we will be able to see CRYPTOCAP:ETC at $50 in this growth wave
Then a slight correction and a possible breakout of the OKX:ETCUSDT price to storm $100
At the moment, the #EthereumClassic price is forming a pattern very similar to the one that #Dogecoin used to form, don't you think? 👇
_____________________
Did you like our analysis? Leave a comment, like, and follow to get more

#ETC/USDT#ETC
The price is moving in an ascending channel on the 12-hour frame and is sticking to it to a large extent
We have a bounce from a major support area in green at 17.70
We have a downtrend on the RSI indicator that was broken upwards, which supports the upward trend
We have a trend to stabilize above the 100 moving average, which supports the upward trend
Entry price 18.40
First target 20.38
Second target 22.33
Third target 24.37

ETCUSDTETC ~ 1W
#ETC So far it continues to maintain this support block. Buy in stages here. with a target of at least 20%++ from here.
Ethereum Classic 💚 ETC price will be $100 👇When will CRYPTOCAP:ETC be at $100? We'll talk a little later...)
And now about what happened yesterday with the ETH ETF.
In short, it was accepted, but not completely...
That is, sooner or later, ETH ETFs will be accepted by the form of S-1s and another gateway will open for the infusion of “big capital” into the crypto market.
Therefore:
🔹The long-term outlook is also realistic and works well
By the way, for those who don't know, the firstborn in the quarreling #Ethereum family was CRYPTOCAP:ETC which was surpassed in all respects in development by its fork - CRYPTOCAP:ETH
⌛ From history, the #ETCUSDT price has been holding in protracted consolidations for a long time, accumulating positions and eventually organizing a powerful growth trend.
Now, the support zone for the #ETCUSD price is $28.70-30.00.
If they hold it, then the blue scenario becomes more than realistic with an intermediate or final point of $100 per #ETC

ETCUSDT Bullish Opportunity with XABCD Harmonic PatternOverview:
ETC/USDT has exhibited the formation of an XABCD harmonic pattern, coinciding with price action nearing a crucial support zone. This confluence suggests a potential bullish reversal from point D, indicating favorable trading opportunities for market participants.
Key Technical Observations:
1. XABCD Harmonic Pattern: The chart analysis reveals the emergence of an XABCD harmonic pattern, characterized by distinct price swings that conform to Fibonacci ratios. This pattern indicates a potential reversal zone, with point D signaling a probable shift in market direction.
2. Key Support Area: Price action has approached a significant support area, enhancing the likelihood of a bullish rebound. The convergence of the harmonic pattern and the support zone strengthens the validity of the anticipated bullish move.
Trade Recommendations:
- Entry: Consider initiating a long position near 32.8150, aligning with the anticipated bullish reversal at point D of the harmonic pattern.
- Stop Loss: Implement a stop-loss order at approximately 31.1750 to mitigate potential losses in case of adverse price movements.
- Take Profit Targets:
1. TP-1: Set the first take-profit level at 34.5800 to secure profits as the price advances in the bullish direction.
2. TP-2: Aim for the second take-profit level at 36.1933 to capitalize on further upward momentum.
3. TP-3: Consider a third take-profit target at 37.8760 to maximize returns as the bullish trend potentially extends.
Risk Management:
Maintain prudent risk management practices by adhering to the specified stop-loss level and adjusting position sizes according to individual risk tolerance. Periodically reassess the market conditions to adapt trading strategies accordingly.
Conclusion:
In summary, the technical analysis of ETC/USDT suggests a favorable outlook for bullish opportunities, supported by the formation of an XABCD harmonic pattern and price action nearing a critical support area. Traders are advised to consider the provided trade setup, incorporating appropriate risk management measures to optimize potential returns while safeguarding against downside risks.

Ethereum Classic ETC price is starting to grow?Looking at the ETCUSDT chart, we can assume that the almost 3-year downward trend in the ETC price is coming to an end.
As long as the ETCUSD price is above $18-20 , it is in an upward trend.
The medium-term target is $65-75 per 1 Ethereum Classic
_____________________
Did you like our analysis? Leave a comment, like, and follow to get more

ETC/USDT shows signs of strength for a potential breakout.I anticipate the price to breach the trendline resistance, possibly resulting in a 15-30% upward movement in the short term. Let's monitor closely.
This idea is for educational purposes only and not financial advice. Always conduct your research before making any trading decisions.

ETCUSDTBINANCE:ETCUSDT SHORT IDEA
⚠️Note:
In this type of signals, only the entry point and trade direction are specified, and stop loss and target are not determined.
If you are interested in entering these signals, please provide a stop loss and a logical market-based target.
"Daily crypto market analyses I provide are personal opinions & not financial advice. Trading carries risks, so do your own research & seek advisor's help."
Don't forget to like and comment

ETCUSDTThe current situation of Ethereum Classic is as follows:
In general and in the long term, the trend is bearish, but in the medium and short term, we have seen a strong bullish trend that brought the price from the bottom of the descending channel to the top of the channel in less than 20 days.
Now we are witnessing a price decline from the top of the channel.
In my opinion, the $18 price level can be a suitable area to open a long position with the target being the top of the channel.
But why $18?
In this area, we have both the 0.5 Fibonacci retracement level and a region with high liquidity, which I have indicated on the chart with a blue box.
⚠️"Daily crypto market analyses I provide are personal opinions & not financial advice. Trading carries risks, so do your own research & seek advisor's help."
Don't forget to like and comment

Ethereum Classic ETC price remembered that it can growOver the past week, many "old" altcoins have mentioned that in addition to the ability to "constantly fall", there is another function - "price growth"
Recently, we have been updated many ideas for coins and have shown good growth: BCHUSDT, LTCUSDT, SOLUSDT, COMPUSDT and others, which can be found in our profile, and today we will talk about ETCUSDT
Buyers ETC need to make one more upward impulse for the ETC price to finally break through the first echelon of sellers' defense.
Above $24-25, there is a major cluster of shorts' stop orders, breaking through which the ETCUSD price can easily reach $26.50
And after this we will have to see which scenario the Ethereum Classic price will follow: the red or blue scenario.
_____________________
Did you like our analysis? Leave a comment, like, and follow to get more

April for ETCAscending triangle breakout successfully and first target is 24 . If 24 resistance breaks then next target will be 30. If price breaks down the Red line then there are chances that price will not pump soon.

ETC/USDT will soon present a buying opportunity."Etcusdt
The price of ETC/USDT might go up soon because it's forming a bullish Symmetrical pattern on the daily chart.
But on the 4-hour chart, there's a bearish pattern which suggests the price might drop before going up. it's possible that the price could drop more before going up.
"I am expecting a small price drop at the moment, and my preferred buying zone is the area that I've marked on the chart."
Please keep in mind that our ideas are based on our experience and knowledge, and may not be completely accurate as the market is always unpredictable and anything can happen at any time. It is essential to conduct your own research and use your own knowledge when trading. If you are happy with our work, join us

My idia etcusdt trend direction checkhi Choose the buying and selling area for Etcusdt this is my aidi

ETHEREUM Classic ETC price probably forms trend reversal patternThe price of ETCUSDT after a sharp price surge in July-August 2022 now has been in a protracted consolidation for 4 months.
However, there is a possibility that on the ETCUSD price chart market players can now form an "Inverted head and shoulders" reversal pattern
In the current impulse growth momentum, the ETC price can reach $19.5
If the reversal pattern will be fully formed as we have shown on the chart, the target for the growth of the Ethereum Classic price will rise to $25
_____________________
Did you like our analysis? Leave a comment, like, and follow to get more

$ETC #ETC | LTF SHORTThe lower bound of red box most probably will work as resistance so i looking at bearish breakers around $18.98 . If the price loses red box, the price may dump more than we expect.
Have a nice week!
