ETCUSDT — The Final Defense Zone Before a Major Move?Ethereum Classic (ETC) is once again standing at its final line of defense — the multi-year support zone between 16.40–13.50, which has successfully absorbed selling pressure several times since 2021.
This area is not just a price range; it’s a psychological stronghold that separates the potential for a massive rebound from the risk of a full-scale breakdown.
For more than three years, ETC has been forming a range-base accumulation structure, where every dip into this zone has triggered strong buying interest.
However, each rally has also failed to create higher highs — a clear signal that supply pressure remains dominant in the mid-term structure.
At this point, the market is in equilibrium — a tension zone between buyers defending the historical base and sellers pressing for continuation.
The next decisive move will be determined right here, inside the yellow block.
---
Bullish Scenario — Reclaim and Rally
If price holds above 16.40 and manages to close a weekly candle above 20.94 with strong buying volume, ETC could begin a structural reversal toward 24.95 and 36.85.
Such a move would confirm that the capitulation phase has ended and that a new accumulation cycle is underway.
Key confirmations:
Weekly close above 20.94
Higher low formed above 16.4
Rising weekly volume
Upside targets:
24.95 → 36.85 → 48.30
---
Bearish Scenario — Breakdown of the Base
Failure to defend the zone, especially with a weekly close below 13.50, would confirm a breakdown of the multi-year base.
This could trigger a new distribution phase, with potential downside targets at 11.00, 8.00, and possibly a wick toward 7.00 as liquidity gets swept.
Key confirmations:
Weekly close below 13.50
Failed retest (support turns to resistance)
Increasing sell volume
Downside targets:
11.20 → 8.00 → potential liquidity sweep near 7.00
---
Pattern Structure
Range Base Accumulation: multi-year accumulation between 13–36 since 2021.
Descending Structure: a series of lower highs, showing continuous supply pressure.
Liquidity Sweep: a deep wick to the 7.0 area indicates previous stop-hunts and possible smart-money accumulation.
Decision Point: 16.4–13.5 remains the make-or-break level that will define ETC’s long-term direction.
---
Conclusion
ETC is at a major decision point after years of sideways consolidation.
If the support holds, the asset could trigger a macro reversal and join the next major crypto bull cycle.
But if it breaks down, the fall could be steep — as liquidity below this zone is thin.
The 16.4–13.5 zone is the last line between hope and capitulation.
Watch the weekly close — that’s where the next big move will be decided.
---
#ETC #ETCUSDT #EthereumClassic #CryptoAnalysis #SwingTrading #TechnicalAnalysis #SupportResistance #WeeklyChart #CryptoBreakout #MarketStructure
Etcusdtsignal

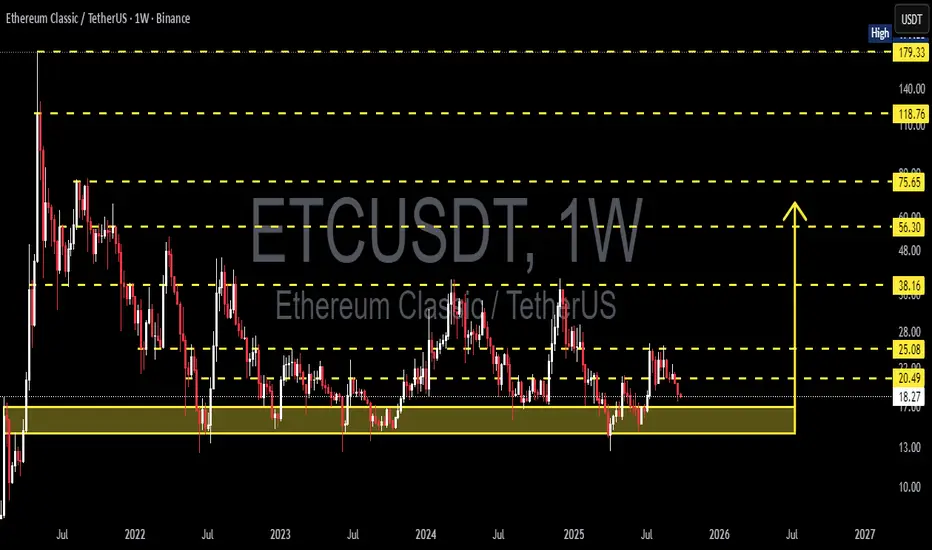
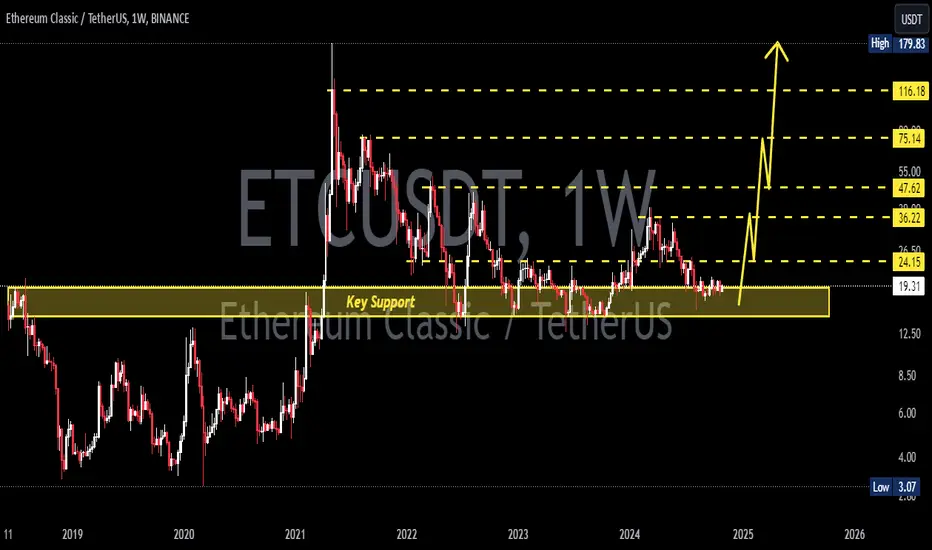
ETC/USDT — Major Support Retest, Breakout or Breakdown?🔎 Current Market Outlook
Current price: ~20.49 USDT
Price is approaching the critical support zone at 17–14 USDT (highlighted yellow).
This area has acted as a multi-year demand zone since 2021, where buyers repeatedly defended the level and triggered rebounds.
However, ETC has consistently failed to break major resistance levels, forming lower highs within a prolonged sideways range.
This makes the 17–14 zone a decision point: will buyers once again absorb supply and push for a rebound, or will sellers finally break the structure and trigger a deeper bearish trend?
---
📐 Market Structure & Price Pattern
1. Major Support Zone (17–14 USDT):
Tested multiple times since 2021.
Holding above → suggests strong accumulation.
Breaking below → could end the long-term sideways trend.
2. Key Resistance Levels:
25.08 USDT → first resistance to watch for breakout.
38.16 USDT → medium-term resistance.
56.30 & 75.65 USDT → major long-term supply zones.
Higher targets: 118.76 & 179.33 USDT (only relevant in a super bullish cycle).
3. Price Pattern:
Large sideways structure with lower highs.
Repeated tests of 17–14 → showing this demand zone is still crucial for market direction.
---
🐂 Bullish Scenario (If Buyers Defend)
Confirmation: Weekly close above 25.08 with strong volume.
Implication: Signals a new higher high on the weekly timeframe.
Targets:
TP1 → 38.16
TP2 → 56.30
TP3 → 75.65
Key Note: As long as 17–14 holds, ETC remains in accumulation territory with potential for a strong rebound in the next bullish phase.
---
🐻 Bearish Scenario (If Sellers Break Through)
Confirmation: Weekly close below 14 USDT.
Implication: Multi-year demand zone is invalidated.
Targets: Without solid support below, price could drop towards the psychological 10 USDT level or even lower.
Warning: A breakdown here would mark the end of the long-term sideways phase and trigger a deeper bearish leg.
---
🎯 Trading Strategy & Risk Management
1. Conservative Approach:
Wait for breakout >25.08 → enter long.
Targets: 38.16–56.30.
Stop loss below 22.
2. Aggressive Approach (buy the zone):
Enter within 17–14.
Stop loss below 14.
First target 25.08, scale out at 38.16.
3. Short Setup:
Only valid if weekly close <14 (confirmed breakdown).
Short-term target: 12 → 10 USDT.
⚠️ Note: This is a high risk/reward zone. Position sizing and clear stop-loss levels are critical.
---
✨ Conclusion
The 17–14 USDT support zone is ETC’s lifeline.
Holding above → accumulation continues, with rebound potential toward 25.08 → 38.16.
Breaking below 14 → long-term bearish breakdown with risk of a sharp decline.
Breakout above 25.08 → the first real trigger of a bullish trend reversal.
ETC is at a make-or-break moment. Traders should closely watch how weekly candles react around 17–14.
---
#ETC #EthereumClassic #Crypto #Altcoins #TechnicalAnalysis #PriceAction #SwingTrade #SupportResistance #CryptoAnalysis #ChartPatterns
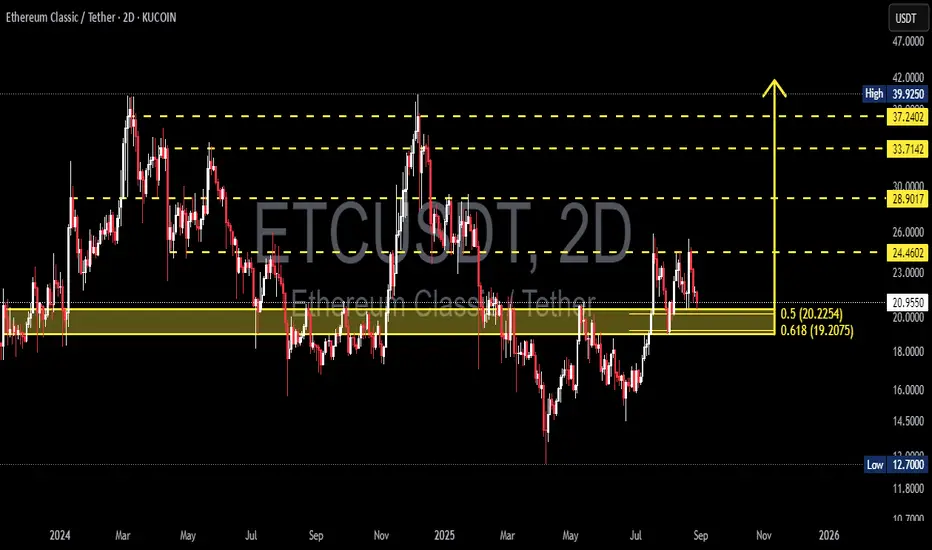
ETC/USDT — Testing Golden Pocket: Rebound or Breakdown?Ethereum Classic (ETC) is currently at a critical decision zone after being rejected around the 24.46 USDT resistance. The price has now pulled back into the Fibonacci golden pocket (0.5–0.618) at 20.22–19.20 USDT, a key support zone that previously acted as a major flip level (resistance → support).
This area carries heavy significance as it has served as a battleground for liquidity multiple times. The reaction here will likely determine whether ETC continues its mid-term bullish structure or slips back into a deeper bearish trend.
---
🔎 Market Structure & Pattern
Mid-term structure: ETC is trading within a wide range between the historical support of 12.70 and the upper resistance near 39.93.
Short-term focus: The 19.20–20.22 golden pocket is the decision point for the next move.
Bullish bias holds as long as this level remains intact.
Bearish risk emerges if the golden pocket fails, triggering a deeper breakdown.
---
🚀 Bullish Scenario
1. Strong rejection at the golden pocket with bullish reversal candles (engulfing / pin bar) → buyer confirmation.
2. Short-term target: 24.46 (nearest resistance).
3. Break and close above 24.46 on the 2D timeframe opens upside targets at 28.90 → 33.71 → 37.24 → 39.93.
4. Supporting signals: RSI holding above 50 + volume expansion on breakout.
---
⚠️ Bearish Scenario
1. Breakdown confirmed if the 2D candle closes below 19.20 → support failure.
2. Downside targets: 16.00 → 14.50 → 12.70 (historical low).
3. A weak bounce forming only a lower high below 24.46 would strengthen bearish continuation.
4. Confirmation: high volume on breakdown + strong bearish candles without lower wicks.
---
📝 Trader’s Notes
The golden pocket zone (19.20–20.22) is the decision point for the next macro move.
Aggressive traders may consider longs here with tight stops below 18.00.
Conservative traders should wait for a confirmed breakout above 24.46 before entering.
Risk management is crucial: aim for at least 1:2 risk-to-reward ratio.
---
📌 Key Levels
Support: 19.20–20.22
Nearest resistance: 24.46
Bullish targets: 28.90 → 33.71 → 37.24 → 39.93
Bearish targets: 16.00 → 14.50 → 12.70
#ETCUSD #EthereumClassic #ETC #CryptoAnalysis #Altcoin #TechnicalAnalysis #SupportResistance #Fibonacci #PriceAction #SwingTrade
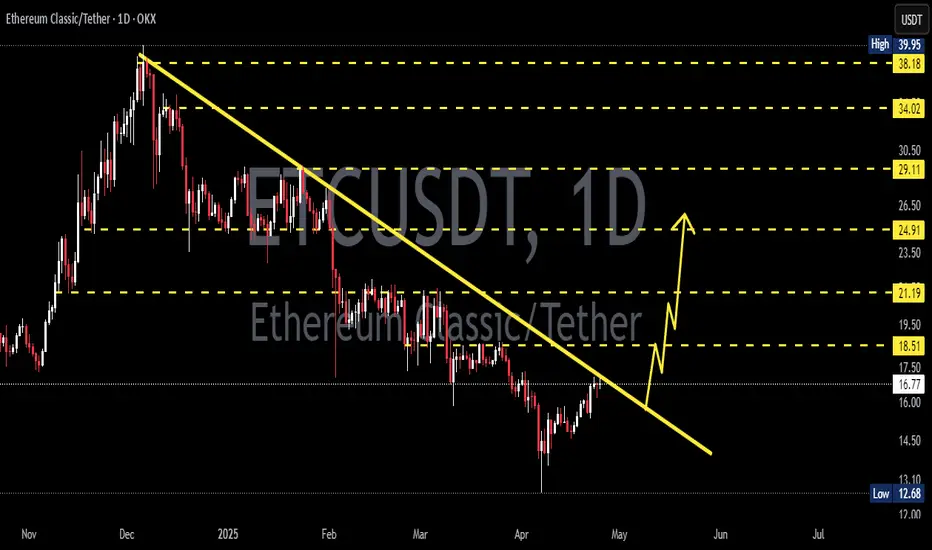
ETCUSDT 1D AnalysisETC ~ 1D Analysis
#ETC Buy incrementally on this support block with a short term target of at least 15%+ from here.

ETCUSDT 1D AnalysisETC ~ 1D Analysis
#ETC Buy after successfully penetrating this resistant line with a large volume, a minimum target of 10%+.
ETCUSDT 1WETC ~ 1W Analysis
#ETC Buy gradually from here if you still have a Conviction on this Coin with a minimum target of 20%+

ETCUSDT 1WETC Update ~ 1W
#ETC Entering the Bullish phase., If you still have Conviction on this coin,. Buy gradually on this Golden Fibonacci. With a minimum target of 20%++
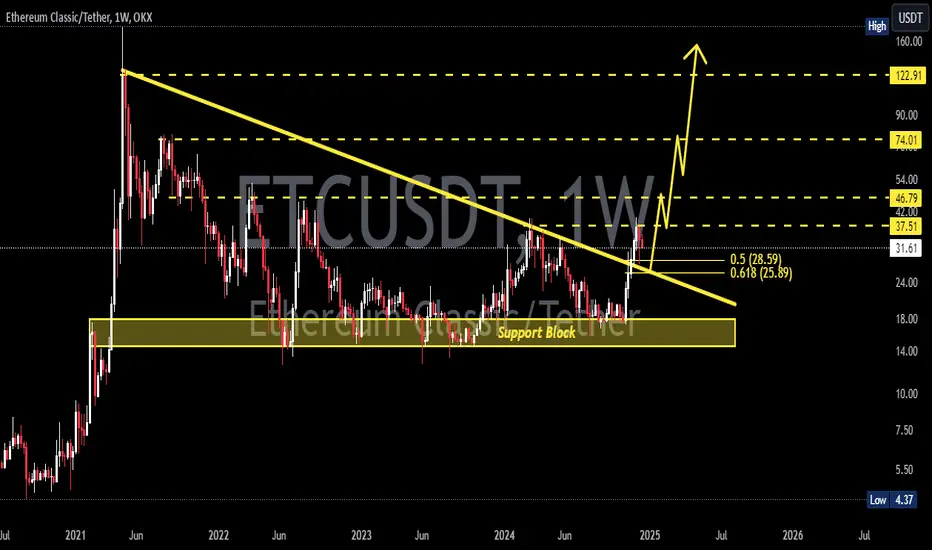
ETCUSDTETC ~ 1W
#ETC So far it continues to maintain this support block. Buy in stages here. with a target of at least 20%++ from here.
ETCUSDTETC ~ 1W
#ETC If you have Conviction on this coin,. This is a great time to start buying again. So far this support block has been able to withstand selling pressure on sellers. this proves the Buyer is stronger.

ETC Holders! FOLLOW ME~!Good day, friends!
This is ESS team.
Let's see the ETCUSDT.
If Candle is supported by the lower GREEN uptrend line, We expect that candle breaks through the RED long-term downtrend line.
The waves that supported the lower GREEN uptrend line have broken through the downtrend line in the past.
If it fails to break through the RED long-term downtrend line this time, It may be expected to rise after accumulation from the ORANGE uptrend line.

ETCUSDT Bullish Opportunity with XABCD Harmonic PatternOverview:
ETC/USDT has exhibited the formation of an XABCD harmonic pattern, coinciding with price action nearing a crucial support zone. This confluence suggests a potential bullish reversal from point D, indicating favorable trading opportunities for market participants.
Key Technical Observations:
1. XABCD Harmonic Pattern: The chart analysis reveals the emergence of an XABCD harmonic pattern, characterized by distinct price swings that conform to Fibonacci ratios. This pattern indicates a potential reversal zone, with point D signaling a probable shift in market direction.
2. Key Support Area: Price action has approached a significant support area, enhancing the likelihood of a bullish rebound. The convergence of the harmonic pattern and the support zone strengthens the validity of the anticipated bullish move.
Trade Recommendations:
- Entry: Consider initiating a long position near 32.8150, aligning with the anticipated bullish reversal at point D of the harmonic pattern.
- Stop Loss: Implement a stop-loss order at approximately 31.1750 to mitigate potential losses in case of adverse price movements.
- Take Profit Targets:
1. TP-1: Set the first take-profit level at 34.5800 to secure profits as the price advances in the bullish direction.
2. TP-2: Aim for the second take-profit level at 36.1933 to capitalize on further upward momentum.
3. TP-3: Consider a third take-profit target at 37.8760 to maximize returns as the bullish trend potentially extends.
Risk Management:
Maintain prudent risk management practices by adhering to the specified stop-loss level and adjusting position sizes according to individual risk tolerance. Periodically reassess the market conditions to adapt trading strategies accordingly.
Conclusion:
In summary, the technical analysis of ETC/USDT suggests a favorable outlook for bullish opportunities, supported by the formation of an XABCD harmonic pattern and price action nearing a critical support area. Traders are advised to consider the provided trade setup, incorporating appropriate risk management measures to optimize potential returns while safeguarding against downside risks.

ETC/USDT Keep an eye on this support. Bounce or Break down ??💎 ETC's market trajectory recently has garnered significant attention. A week ago, ETC successfully breached a key resistance level and is currently in a retesting phase at what was previously a resistance, now serving as support.
💎 If this retesting proves to be valid and ETC bounces off this support level, it could signal an extension of its upward movement, probability challenging the strong supply and bearish Order Block (OB) areas.
💎 However, should ETC fail to maintain this support level, it might indicate a false breakout. In such a scenario, ETC's price could revert to a downward trajectory, possibly reaching the demand area around $18.7 to gather momentum for a potential bounce.
💎 In the event of such a downturn, ETC would be perceived as reentering a bearish phase due to the false breakout. For a bullish resurgence, ETC would need to reclaim and consolidate above the $24 support level. If ETC aims to resume its upward journey and reach projected targets, maintaining this level is crucial. Conversely, a breach of the $18.7 demand level could lead to further decline, potentially driving ETC towards a more substantial support area.

ETC target 2612h time frame
-
ETC is breaking and retesting the bottom triangle and getting support at 0.5 Fibonacci Retracement. Considering the symmetrical structure and previous highs, there are lots resistance zones which will provide pressure for price. However, we can still set a trading plan woth good risk to reward ratio here.
TP: 26 / 38
SL: 17.295

ETC target 3812h time frame
-
ETC is still under the downtrend so far.
The best entry is wait for breakout and retest the structure.
TP: 38
SL: 16.8

ETCUSDT Elliott Waves AnalysisHello friends.
Please support my work by clicking the LIKE button👍(If you liked). Also i will appreciate for ur activity. Thank you!
Everything on the chart. (update)
Nothing has changed, still waiting for upward movement.
Entry: market and lower
Target: 27 - 30 - and maybe even 35(not sure)
after first target reached move ur stop to breakeven
Stop: ~15.8 (depending of ur risk). ALWAYS follow ur RM .
RR: 1 to 4
risk is justified
Good luck everyone!
Follow me on TRADINGView, if you don't want to miss my next analysis or signals.
It's not financial advice.
Dont Forget, always make your own research before to trade my ideas!
Open to any questions and suggestions.

ETCUSDT Elliott Waves Analysis (Local Setup)Hello friends.
Please support my work by clicking the LIKE button👍(If you liked). Also i will appreciate for ur activity. Thank you!
Everything on the chart.
Entry: market and lower
Target: 27 - 30 - and maybe even 35(not sure)
after first target reached move ur stop to breakeven
Stop: ~15.2 (depending of ur risk). ALWAYS follow ur RM .
RR: 1 to 3
risk is justified
Good luck everyone!
Follow me on TRADINGView, if you don't want to miss my next analysis or signals.
It's not financial advice.
Dont Forget, always make your own research before to trade my ideas!
Open to any questions and suggestions.

ETCUSDT Elliott Waves AnalysisHello friends.
Please support my work by clicking the LIKE button👍(If you liked). Also i will appreciate for ur activity. Thank you!
Everything on the chart. (update)
we almost completed upward impulse, after correction will be continuation of growth.
Entry: market and lower (entry from my last analysis was 19$)
Targets: 35 - 45 - 55
MAIN TARGET ZONE: 50-60$
after first target reached move ur stop to breakeven
Stop: ~13 (depending of ur risk). ALWAYS follow ur RM .
Risk/Reward: 1 to 7
risk is justified
Good luck everyone!
Follow me on TRADINGView, if you don't want to miss my next analysis or signals.
It's not financial advice.
Dont Forget, always make your own research before to trade my ideas!
Open to any questions and suggestions.

ETCUSDT Elliott Waves AnalysisHello friends.
Please support my work by clicking the LIKE button👍(If you liked). Also i will appreciate for ur activity. Thank you!
Everything on the chart. (update)
Almost nothing has changed from my last idea,
We complicated the corrective structure to a double zigzag (wxy).
Entry: market and lower
Target: 27 - 37 - 55
MAIN TARGET ZONE: 50-60$
after first target reached move ur stop to breakeven
Stop: ~13 (depending of ur risk). ALWAYS follow ur RM .
Risk/Reward: 1 to 7
risk is justified
Good luck everyone!
Follow me on TRADINGView, if you don't want to miss my next analysis or signals.
It's not financial advice.
Dont Forget, always make your own research before to trade my ideas!
Open to any questions and suggestions.

ETCUSDT Elliott Waves AnalysisHello friends.
Please support my work by clicking the LIKE button👍(If you liked). Also i will appreciate for ur activity. Thank you!
Everything on the chart.
Entry: market and lower
Target: 40 - 50 - 60
after first target reached move ur stop to breakeven
Stop: ~15 (depending of ur risk). ALWAYS follow ur RM .
Risk/Reward: 1 to 5
risk is justified
Good luck everyone!
Follow me on TRADINGView, if you don't want to miss my next analysis or signals.
It's not financial advice.
Dont Forget, always make your own research before to trade my ideas!
Open to any questions and suggestions.

Trading opportunity for ETCUSDTBased on technical factors there is a long position in :
📊 ETCUSDT
🔵 Long Now 25.82
🧯 Stop loss 24.02
🏹 Target 1 28.20
🏹 Target 2 31.50
💸Capital : 1%
We hope it is profitable for you ❤️
Please support our activity with your likes👍 and comments📝

ETC/USDT HAS POTENTIAL TO PUMP 100%!Hi guys, This is CryptoMojo, One of the most active trading view authors and fastest-growing communities.
Do consider following me for the latest updates and Long /Short calls on almost every exchange.
I post short mid and long-term trade setups too.
Let’s get to the chart!
I have tried my best to bring the best possible outcome in this chart, Do not consider it as financial advice.
Welcome to this ETC/USDT update. ETC looks very promising here.
Long ETC/USDT
Entry range:- CMP and more up to $37.50
Target:- 100%
SL:- $35
This chart is likely to help you in making better trade decisions if it did consider upvoting this chart.
Would also love to know your charts and views in the comment section.
Thank you

ETCUSDT Analysis (perspective a couple of months)Hello friends.
Please support my work by clicking the LIKE button👍(If you liked). Also i will appreciate for ur activity. Thank you!
Everything on the chart.
Upward movement from the current price or through 20$.
Entry: market and lower
Target: 30 - 40 - 60
after first target reached move ur stop to breakeven
Stop: (depending of ur risk). ALWAYS follow ur RM .
risk is justified
Good luck everyone!
Follow me on TRADINGView, if you don't want to miss my next analysis or signals.
It's not financial advice.
Dont Forget, always make your own research before to trade my ideas!
Open to any questions and suggestions.

ETCUSDT AnalysisHello friends.
Please support my work by clicking the LIKE button(If you liked).Thank you!
Everything on the chart.
open pos: market and lower
target: 62 - 72 - 88
after first target reached move ur stop to breakeven
stop: ~under 43 (depending of ur risk). ALWAYS follow ur RM .
risk/reward 1 to 5
risk is justified
Good luck everyone!
Follow me on TRADINGView, if you don't want to miss my next analysis or signals.
It's not financial advice.
Dont Forget, always make your own research before to trade my ideas!
Open to your questions or suggestions.
