TradeCityPro | MNT Testing Key Levels for Bullish Breakout👋 Welcome to TradeCityPro!
In this analysis, I want to review MNT, a Layer-2 Ethereum project with a $3.4 billion market cap, currently ranked 31st on CoinMarketCap.
⏳ 4-Hour Timeframe
On the 4-hour timeframe, this coin has been in a downtrend, and after reaching 0.9596, it entered a range phase.
✔️ Currently, a range box has formed between 0.9596 and 1.1207, and the price is reacting to the top of the box at 1.1207.
💥 On the RSI, we have a very important resistance level at 65.80.
🔔 A break of this level on the RSI would confirm the entry of bullish momentum, and in this case, we can open a long position after the 1.1207 level is broken.
✨ Breaking 1.1207 will be the first confirmation of the bullish trend for MNT, and the coin could initiate an upward wave.
🧩 This upward movement could continue toward 1.3478.
⚖️ However, if the price gets rejected at 1.1207 and moves back toward 0.9596, we can open a short position after breaking the 0.9596 support level.
📝 Final Thoughts
Stay calm, trade wisely, and let's capture the market's best opportunities!
This analysis reflects our opinions and is not financial advice.
Share your thoughts in the comments, and don’t forget to share this analysis with your friends! ❤️
Ethereumecosystem

TradeCityPro | POL Near Key Trigger in Ongoing Downtrend👋 Welcome to TradeCity Pro!
In this analysis, I’ll review POL, one of Ethereum’s Layer-2 ecosystem projects, currently ranked 52nd on CoinMarketCap with a market cap of $1.41 billion.
⏳ 4-Hour Timeframe
POL is currently in a downtrend on the 4-hour timeframe and is now moving inside a corrective range within that trend.
🔔 This downtrend continued until the 0.1311 support zone, and after reaching this level, the price began a corrective move upward, retracing up to 0.1391.
📊 Throughout this correction, volume has been decreasing, which is expected and also confirms that sellers still have control of the overall trend.
✨ Given the bearish trend and volume confirmation, opening a short position remains the more logical strategy for now.
💥 On the RSI, we have a support level at 39.60.
A break below this level would be the first sign of a new bearish wave beginning.
📉 The main short trigger on POL is 0.1311.
If this trigger breaks with increasing volume, the downtrend can easily continue.
🧩 For long positions, it’s too early, the market needs to show a clear trend reversal first.
To confirm a reversal, the price must stabilize above 0.1391 and form a higher high and higher low above this zone.
⭐ However, if buying volume begins to increase inside the current range and bullish candles become stronger than the bearish ones, the chances of a trend reversal rise — and in that scenario, a break of 0.1391 can act as an early long trigger.
📝 Final Thoughts
Stay calm, trade wisely, and let's capture the market's best opportunities!
This analysis reflects our opinions and is not financial advice.
Share your thoughts in the comments, and don’t forget to share this analysis with your friends! ❤️

TradeCityPro | POL Faces Crucial Resistance Test👋 Welcome to TradeCity Pro!
In this analysis, I’m going to review POL, one of Ethereum’s Layer 2 projects, currently ranked #48 on CoinMarketCap with a market capitalization of $1.87 billion.
⌛️ 4-Hour Timeframe
On the 4-hour chart, after finding support around 0.1590, this coin formed a high at 0.1724 and has since made its first bullish move after breaking that level.
✔️ Right now, price is facing resistance around 0.1836, a zone it has already tested twice—each time getting rejected.
✨ If 0.1836 breaks, we can look for a long position, with the next resistance area sitting around 0.2046.
📊 یFor short positions, I’ll wait until the structure turns bearish before acting. At the moment, the short trigger is at 0.1724, but the main confirmation of a downtrend would only come after a break below 0.1590.
📝 Final Thoughts
Stay calm, trade wisely, and let's capture the market's best opportunities!
This analysis reflects our opinions and is not financial advice.
Share your thoughts in the comments, and don’t forget to share this analysis with your friends! ❤️

TradeCityPro | AAVE: Trendline Squeeze, Breakout Loading👋 Welcome to TradeCity Pro!
In this analysis, I want to review the AAVE coin for you—one of the lending projects in the Ethereum ecosystem, currently ranked 32 on CoinMarketCap with a market cap of $3.36 billion.
⏳ 4H Timeframe
On the 4-hour timeframe, this coin started a downtrend after being rejected from the 301.39 zone and, together with a descending trendline, has been moving downward.
✔️ Price has now reached it again, faked it once, and is still ranging around this trendline.
✨ If the trendline is broken and price holds above its trigger, it can begin an upward move.
⚡️ The trigger we have to confirm the start of this move is the 234.24 zone. With the break of this trigger, we can also use it to open a long position.
📊 The next resistance levels this coin has are 261.25 and 302.18, each of which can be used as the next trigger for a long position.
💥 For a short position, the main floor that has formed is 202.86. A break of this level will be a very good trigger for a short position.
📝 Final Thoughts
Stay calm, trade wisely, and let's capture the market's best opportunities!
This analysis reflects our opinions and is not financial advice.
Share your thoughts in the comments, and don’t forget to share this analysis with your friends! ❤️

TradeCityPro | PENDLE: Near Breakout From Descending Trendline👋 Welcome to TradeCity Pro!
In this analysis, I want to review the PENDLE coin for you — one of the projects in the Ethereum ecosystem, currently ranked 93rd on CoinMarketCap with a market cap of $858.76 million.
📅 Daily Timeframe
On the daily timeframe, this coin has formed two trendlines. The main trendline is the long-term ascending trendline that the price has respected for a long time, while the second is a continuation descending trendline — if broken, the previous bullish move can resume.
✨ Since the overall trend is bullish, the continuation trendline is currently more important for us, because breaking it would confirm the continuation of the uptrend.
🔍 This trendline formed after the price reached the 5.732 level and made a fake breakout.
📊 The breakout trigger for this trendline is currently at 5.344. Breaking this level can provide an opportunity to open a long position on PENDLE.
🛒 For spot purchases, this same 5.344 trigger can be used, but the 5.732 level would be a much safer confirmation for a spot entry.
✅ The main confirmation of bullish continuation in higher cycles will come after breaking 6.857.
🎲 It’s important to note that any bullish breakout must be accompanied by an increase in volume, otherwise the move could easily turn out to be fake.
⚡️ If the ascending trendline breaks, the trigger for this breakdown is at 4.431. Breaking this level is not an ideal short trigger, but if the price stabilizes below it, you can consider activating your stop-loss in case you’ve already bought the coin in spot.
🧩 The next support levels in case of further decline are 3.741 and 3.017.The momentum trigger on the RSI is at 39.16.
📝 Final Thoughts
Stay calm, trade wisely, and let's capture the market's best opportunities!
This analysis reflects our opinions and is not financial advice.
Share your thoughts in the comments, and don’t forget to share this analysis with your friends! ❤️

TradeCity Pro | CRV Testing Key Support Zone for Trend Reversal👋 Welcome to TradeCity Pro!
In this analysis, I will be reviewing the CRV coin, one of the popular DEXs, with a market cap of $954 million, currently ranked 81 on CoinMarketCap.
📅 Daily Timeframe
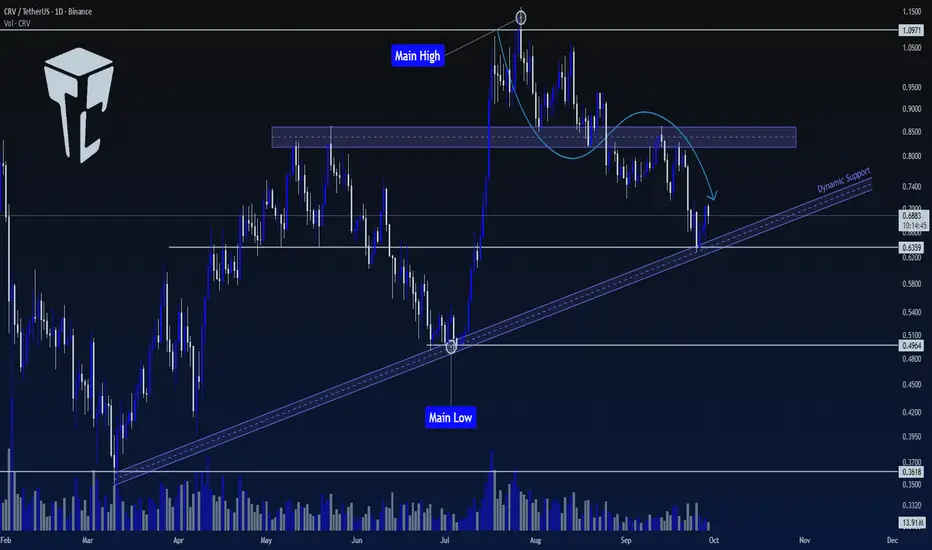
In the daily timeframe, this coin is in an uptrend with a trendline, and the price has currently reached it.
🔍 In higher cycles, the trend of this coin is bullish. However, in lower cycles, after being rejected from 1.0971, a downward movement has started, and it has corrected to the 0.6359 level.
✔️ This level is currently overlapping with the trendline and forms an important support zone.
✨ If this PRZ zone breaks, we can confirm the bearish reversal for CRV, and a short position can be opened. This trigger is one of the first signals for a trend change, and the main trend change will be confirmed after breaking 0.4964.
📈 For a long position, we will have to wait until a proper bullish structure is formed. If the price moves sharply, we will confirm the bullish trend after stabilization above the zone.
❌ Disclaimer ❌
Trading futures is highly risky and dangerous. If you're not an expert, these triggers may not be suitable for you. You should first learn risk and capital management. You can also use the educational content from this channel.
Finally, these triggers reflect my personal opinions on price action, and the market may move completely against this analysis. So, do your own research before opening any position.
TradersCity Pro | ARB Set for Pump After Pullback to Support👋 Welcome to TradersCity Pro!
In this analysis, I want to review the ARB coin for you. One of the most popular Ethereum Layer 2s, with a market cap of $2.83 billion, currently ranked 43rd on CoinMarketCap.
📅Daily timeframe
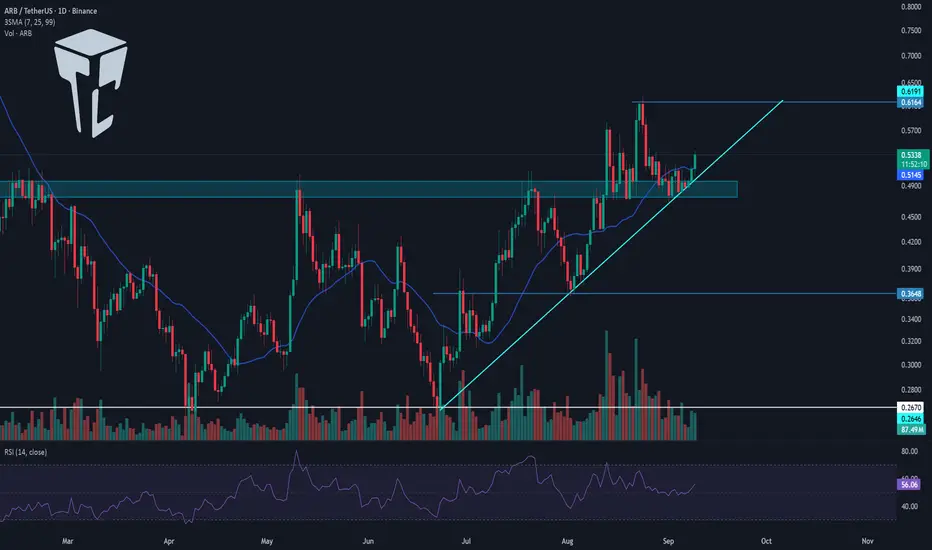
On the daily chart, this coin has been in an uptrend along with a trendline and has managed to break through an important resistance zone.
🔔 At the moment, the price is in a correction and pullback phase toward that zone. It reacted to the trendline and bounced upward. The RSI oscillator has also bounced from the 50 level, and if it continues upward, it has room to bring more bullish momentum into this coin.
✔️ The last two candles we had were strong green candles with high volume, showing buyer strength. If today’s candle can hold above the SMA25, the price can move toward 0.6164.
📊 The main bullish move will start after breaking the 0.6164 zone, but the area where support was confirmed is already a very important PRZ. It’s not a bad idea to look for long triggers from this support area on lower timeframes.
⌛️ 4-hour timeframe
On the 4-hour chart, the first long trigger we had — the breakout of 0.5146 — was activated, and the price has so far made a short leg up to 0.5376.
🔍 The 0.5376 zone can be the next long trigger. The negative point here is that the price is in the middle of a bullish leg. These kinds of triggers usually have a lower win rate because they rely on market momentum, and whenever that momentum fades, the chance of getting stopped out rises sharply.
💥 On the other hand, RSI is entering the Overbought zone, which is a strong momentum signal and could help this bullish move continue.
💼 My suggestion: if you already have long positions on this coin or others, it’s not very logical to open a new one here, since this trigger is considered risky. But if you don’t have a position, entering on a breakout of 0.5376 isn’t bad, as RSI entering Overbought could trigger a sharp move upward.
⚠️ Just keep in mind: this trigger belongs to the risky setups, so you should manage your risk on this coin more carefully than on others.
📝 Final Thoughts
Stay calm, trade wisely, and let's capture the market's best opportunities!
This analysis reflects our opinions and is not financial advice.
Share your thoughts in the comments, and don’t forget to share this analysis with your friends! ❤️
TradeCityPro | APT: Testing Momentum After Key Breakout👋 Welcome to TradeCity Pro!
In this analysis, I want to review the APT coin for you. This coin belongs to the Aptos project, which is one of Ethereum’s Layer 2 solutions.
⚡️ APT, with a market cap of $3.6 billion, is currently ranked 32 on CoinMarketCap.
⏳ 4-Hour Timeframe
As you can see in the 4-hour timeframe, after finding support at the 4.687 zone, the price made a very sharp bullish move and reached 5.708. After an initial rejection, it has now managed to stabilize above this level.
🔍 If this bullish move continues, we could see another upward leg, with the next resistance at 6.047. If this level breaks, the price could move up to 6.752.
✔️ There’s a very important RSI ceiling at 80.76, which has consistently caused rejections after sharp upward moves. If the price aims for another bullish wave, this level will be critical and could mark the top of the move.
⭐ A breakout above this level seems unlikely for now, since 80.76 is a very high reading for the RSI oscillator, and the chance of it breaking is quite low. But if it does happen, we could see an extremely sharp and unusual move.
🔽 As for a bearish scenario and short positions, we currently need to wait for a trend reversal. If the breakout above 5.708 turns out to be fake and the price starts moving downward, we can look for a trigger in a lower timeframe to enter.
🔑 But keep in mind that short positions in these market conditions are very, very risky. And if you do open such a position, make sure to secure profits frequently with small risk-to-reward setups.
📝 Final Thoughts
This analysis reflects our opinions and is not financial advice.
Share your thoughts in the comments, and don’t forget to share this analysis with your friends! ❤️

TradeCityPro | LDO: Watching for Breakout in DeFi Leader’s Range👋 Welcome to TradeCity Pro!
In this analysis, I’m going to review the LDO coin — one of the well-known DeFi projects within the Ethereum ecosystem with a significantly high TVL.
✔️ This project’s token currently has a market cap of $748 million, placing it at rank 86 on CoinMarketCap.
⏳ 4-Hour Timeframe
As you can see on the 4-hour chart, after a downtrend, LDO formed a bottom around the 0.676 zone and managed to rally up to 0.868.
🔍 Currently, the price is consolidating below that resistance in a ranging box. A breakout from either direction of the box could determine the next trend.
⭐ If the box breaks upward and the 0.868 level is breached, we can consider the prior downtrend over, and the price would be forming a new bullish structure. However, there is another resistance at 0.904 right above, and there’s a possibility of rejection from that level after the 0.868 breakout.
📈 For a long position, I personally plan to enter upon the breakout of 0.868. While it’s possible that the price might reverse from 0.904, I prefer having an earlier entry and using a more accessible trigger.
🔽 On the other hand, if the box breaks to the downside, the price might revisit the 0.676 support and potentially start a new bearish leg in line with the longer-term downtrend.
📉 The first short trigger is the break of 0.818 (the lower boundary of the box), but there’s another minor support at 0.795, which may cause a bounce.
👀 I personally prefer to wait for the 0.795 level to break for a short entry, given that market momentum is currently bullish, and I prefer a more reliable trigger for shorts.
📊 Volume within this range has been decreasing, which is normal in such consolidation phases. The longer the price stays in this range, the lower the volume tends to be — and typically, a breakout will lead to a sharper move.
The RSI oscillator also has a support zone at 43.17. If this level is broken, it could signal incoming bearish momentum and increase the probability of a downside breakout.
📝 Final Thoughts
This analysis reflects our opinions and is not financial advice.
Share your thoughts in the comments, and don’t forget to share this analysis with your friends! ❤️

TradeCityPro | MNT: Layer 2 Project's Market Movements👋 Welcome to TradeCityPro!
In this analysis, I will review the coin MNT, a layer 2 project that has experienced significant growth in recent months.
📅 Weekly Timeframe: Engaged with ATH Ceiling
In the weekly timeframe, as you can see, there is limited data, and since the inception of this coin, it has created a significant ceiling at 1.4264, which it has touched twice and is currently being rejected from again.
🧩 The main supports are at 0.5450 and 0.3278. The SMA25 also acts as dynamic support. Due to limited data in this timeframe, it's better to move to the daily timeframe for a more detailed chart analysis.
📅 Daily Timeframe: Beginning of the Next Correction Wave
In the daily timeframe, we observe a strong upward trend starting from a low of 0.5450, reaching up to 1.3997, and forming a range box between 1.0861 and 1.3997.
🔽 Currently, the price is breaking the floor at 1.0861. This area is critical as the price has historically reacted to it, and it coincides with the 0.382 Fibonacci level. If this floor breaks, the price could move towards the 0.618 and 0.786 Fibonacci levels.
✨ The RSI oscillator, with its break below 50, has activated a negative divergence in the market, and with the increasing volume of sales, the likelihood of starting the next correction wave is high.
🛒 If the price returns above 1.0861, the trigger at 1.3997 will be suitable for buying in spot. Otherwise, you should watch for the price reaction to upcoming supports.
⏳ 4-Hour Timeframe: Futures Triggers
In the four-hour timeframe, I will only examine futures triggers.
🔼 For long positions, the first trigger is 1.1478, which has shown to be a strong level as the price has already pulled back to it once, highlighting its importance. If this area and 54.85 are broken, more bullish momentum will enter the market, potentially moving the price towards the main resistance at 1.3997.
📉 For short positions, the first trigger is 1.0311, which the price has already reacted to. If the price consolidates below this area, we can expect it to reach 0.8718. Additional triggers might include Dow Theory and breaking lower lows for further positions.
📝 Final Thoughts
This analysis reflects our opinions and is not financial advice.
Share your thoughts in the comments, and don’t forget to share this analysis with your friends! ❤️

TradeCityPro | APT: Daily Trend Breaks and Bottom Forming👋 Welcome to TradeCityPro!
In this analysis, I will examine the APT coin, the primary coin of the APTOS network, which is one of Ethereum's second-layer networks. This analysis will be conducted in the daily timeframe.
📅 Daily Timeframe: Breaking the Curved Trend Line and the First Bearish Leg In the daily timeframe, we are witnessing a strong upward trend that started from the $4.89 area with a curved ascending trend line up to $14.75. This trend line supported the price three times but finally broke on the last contact, initiating the start of a bearish wave from this trend line break.
📊 After the price reached the peak of $14.75, the market volume gradually decreased, and after forming a lower high and breaking the curved ascending trend line, the market momentum shifted and the bearish phase began.
🔽 The main correction trigger after the trend line break was the break of $11.28, which coincided with the 0.236 Fibonacci level, making this area a strong Potential Reversal Zone (PRZ). However, the bearish volume and momentum were strong enough to break this support.
🔍 Currently, the price is attempting to round off and form a bottom. It's also the Christmas holiday season, and the market volume has decreased, which could make it easier for whales and holders of this coin to facilitate bottom formation. Additionally, the price has reached the golden Fibonacci zone between 0.5 and 0.618, which could significantly influence the end of the correction and the continuation of the upward trend.
🧩 The RSI oscillator is also in a critical and interesting area. If it stabilizes below 30 and enters the Oversell region, there might be panic in the market, potentially leading to a sharp drop. For the continuation of the upward trend and a new bullish leg, the RSI needs to rise above the 50 area to introduce momentum into the market.
📉 If further correction occurs, the next support level is at $7.51, and in the event of panic and sharp declines, the next support would be at $4.89.
🔼 For long positions, if the momentum changes, the market will create a new structure and provide triggers, but currently, the only triggers are at $11.28 and $14.75. The next resistance will be at $17.96.
📝 Final Thoughts
This analysis reflects our opinions and is not financial advice.
Share your thoughts in the comments, and don’t forget to share this analysis with your friends! ❤️

TradeCityPro | MNT: Momentum in Mantle's Layer 2 Network👋 Welcome to TradeCityPro!
In this analysis, I’ll review MNT, the token for the Mantle Network, which is a Layer 2 solution on Ethereum. Over the past few weeks, this token has shown significant bullish activity. If you’ve been following our YouTube channel, you’ve likely participated in the Cook airdrop on Mantle and bought MNT at lower prices.
🔍 After the price reached the $1.2701 zone and made a false breakout, it failed to reach the $1.4386 resistance level and began a correction, retracing to the 0.236 Fibonacci level.
📊 Despite the ongoing correction, selling volume has decreased, and green candles exhibit higher volumes, indicating the strength of MNT’s bullish trend.
📈 If the price breaks through $1.2701, it can easily register a new all-time high. However, to determine the precise targets, we need to wait for the breakout confirmation and utilize Fibonacci extension levels.
🧩 If the price fails to hold the 0.236 Fibonacci level, it could drop further toward the 0.382 level, which overlaps with the $0.9248 support zone.
🔽 Further support zones include the 0.5 Fibonacci level at $0.83 and the range between 0.707 and 0.786 Fibonacci levels, which intersects with the $0.655 support zone.
A breach of the $0.655 support would indicate the end of the uptrend, with the final major support resting at $0.5373.
✨ Additionally, breaking the 50 RSI support would increase the likelihood of a bearish continuation scenario.
📝 Final Thoughts
This analysis reflects our opinions and is not financial advice.
Share your thoughts in the comments, and don’t forget to share this analysis with your friends! ❤️ above.

TradeCityPro | ENA : Navigating Parabolic Growth👋 Welcome to TradeCityPro!
In this analysis, I’m reviewing the ENA token, which belongs to the Ethena project operating within the Ethereum ecosystem. This project has successfully ranked among the top 10 DeFi projects by TVL.
📅 Daily Timeframe: Parabolic Trend and Reaction to Supply Zone
This token was recently launched and distributed its airdrop approximately 9 months ago to its users. After the airdrop, the project faced significant selling pressure, with its price reaching new historical lows of $0.2619 and then $0.2020.
👑 As Bitcoin began its bullish movement and broke its important 72k resistance, ENA also gained momentum, with increasing purchase volumes. It managed to fully recover and return to its ATH at $1.45.
📈 In this upward trend, ENA has undergone two re-accumulations, one under the $0.4234 resistance and the second under the $0.6844 resistance. These consolidation phases beneath critical zones help maintain a healthy uptrend without overly sharp corrections. However, the parabolic nature of the trend still suggests a higher risk of sharp retracements.
🔽 Currently, as the price has reached the ATH ceiling—a strong supply zone—the likelihood of corrections has increased.
📉 In case of a downward move:
The first support is the curved ascending trendline, acting as a dynamic support.
If the trendline is broken, the next support lies at $0.6844, which seems logical during a correction phase.
The final critical support is at $0.4234, and breaking it would signify the end of this bullish trend. The market would then require building a new structure for further momentum, either upward or downward.
🧩 From a technical perspective, volume is aligning well with price movements, confirming the upward trend. Meanwhile, the RSI above 50 indicates that corrections are less likely to lead to sharp declines unless the 50 level is breached.
🚀 If the ATH at $1.45 is broken, the next targets would be $2, $2.5, and $3.2, based on 6-month pivot points. Monitoring these levels closely for potential trend reversals is advisable.
⏳ 4-Hour Timeframe: Futures Triggers
In this timeframe, the focus is on specifying futures triggers for both long and short positions.
🔼 The market has managed to recover entirely from its correction and is among the few coins to successfully engulf its entire pullback.
📈 Breaking the $1.2423 resistance could confirm a long setup. However, trading in the $1.2423–$1.45 supply zone will be challenging due to its significant resistance.
📉 It’s recommended to wait until the $0.8550 level is breached for a short position. This would signal a trend reversal, providing a safer entry for shorts.
Currently, given the strong resistance, it’s better to avoid opening short positions without a confirmed trigger.
📝 Final Thoughts
This analysis reflects our opinions and is not financial advice.
Share your thoughts in the comments, and don’t forget to share this analysis with your friends! ❤️ above.

Ethereum (ETH)Ethereum Technical Analysis (ETH/USDT)
📊 Timeframe: Weekly and Daily
🔍 Current Status: Ethereum is in a long-term ascending channel and is currently attempting to break through its weekly resistance zone (red area).
📈 Bullish Analysis (Scenario 1)
Weekly Resistance and Price Stabilization:
Ethereum is currently facing weekly resistance (red zone).
Stabilizing above this resistance could pave the way for a new ATH (All-Time High).
Bullish Targets (Fibonacci Levels):
First target after breaking resistance:
Top of the ascending channel
Fibonacci 1.618 zone, which serves as a significant resistance.
If the channel’s top is broken, parabolic moves can be expected.
Further targets include:
Fibonacci 2.272 and 2.618 levels
Reaction to the Trendline:
By connecting the previous two highs of Ethereum, a trendline is formed.
Increased volume could trigger a price reaction to this line.
This trendline overlaps with Fibonacci 3.272 and 3.618 levels.
Achieving these targets will require significant capital inflows due to ETH’s high market cap.
RSI Indicator:
A rising channel is visible on the RSI.
Entry into the overbought zone could trigger a parabolic move towards the RSI channel’s ceiling.
If hype and volume increase, the RSI ceiling may break, extending into the overextended zone.
📉 Bearish Analysis (Scenario 2)
If Ethereum fails to break the weekly resistance:
A correction towards Fibonacci 0.382 and 0.5 levels is likely.
Failing to hold these levels may bring the price down to the lower boundary of the descending channel.
If selling pressure increases:
The price may move towards the weekly blue support zone.
🔗 Conclusion:
Ethereum is at a critical resistance level. Breaking and stabilizing above the weekly resistance could push ETH to higher Fibonacci targets and new ATHs. If the resistance holds, a correction towards Fibonacci support levels is possible.
📌 Key Point: High volume inflows and RSI movement will play a critical role in fulfilling the bullish scenario.
💎 Key Fibonacci Levels:
1.618 🔹 Initial Resistance
2.272 and 2.618 🔹 Higher Targets
3.272 and 3.618 🔹 Final Targets
📊 Daily Timeframe: Watch for potential corrections to Fibonacci 0.382 and 0.5 support levels.
