ETHFI/USDT Approaching Critical Demand — Bounce or Breakdown?On the 3D timeframe, ETHFI/USDT remains in a medium to long-term downtrend. After failing to hold the distribution area around 1.4 – 1.7, price continued to form lower highs and lower lows, confirming strong bearish control. Currently, price is declining and approaching a major demand zone (yellow box) located at 0.51 – 0.41.
---
Pattern & Market Structure Explanation
1. Primary Trend: Bearish Continuation
Clear Lower High (LH) and Lower Low (LL) structure.
Every bullish attempt is rejected at progressively lower resistance levels.
2. Distribution Range Breakdown
The 0.93 – 1.77 area acted as a strong distribution zone.
Breakdown from this range confirms trend continuation, not a simple correction.
3. Current Price Action
Price is moving inside a minor descending structure, gradually pressing into the key demand zone.
No valid bullish Break of Structure (BOS) has formed so far.
4. Major Demand Zone (Yellow Box)
The 0.51 – 0.41 zone is a historical demand area that previously triggered strong bullish impulses.
This zone is expected to be a critical reaction area.
---
Key Levels
Resistance Levels
0.67
0.83
0.93
1.41
1.77
Major Support / Demand
0.51 – 0.41 (Key Demand Zone)
---
Bullish Scenario
A bullish scenario becomes valid only if price shows a strong reaction inside the 0.51 – 0.41 demand zone, supported by:
Strong bullish rejection or long lower wicks
Increasing volume
Formation of a Higher Low on lower timeframes
Potential Upside Targets (Relief Rally):
0.67
0.83
0.93
As long as price remains below 0.93, any upside move should be considered a technical bounce, not a trend reversal.
---
Bearish Scenario
The bearish scenario remains dominant if:
Price breaks and closes decisively below 0.41
No significant bullish reaction occurs at the demand zone
Implication:
Failed demand → continuation of the bearish structure
Increased probability of further downside / price discovery
A clean breakdown below this zone would confirm long-term bearish continuation.
---
Conclusion
ETHFI/USDT is still under strong bearish pressure. The 0.51 – 0.41 demand zone is the key decision area:
Strong reaction → potential technical bounce
Breakdown → bearish continuation
Traders should remain patient and wait for clear price action confirmation before making directional decisions.
#ETHFI #ETHFIUSDT #CryptoAnalysis #Altcoin #BearishTrend #DemandZone #MarketStructure
Ethfi

ETHFI/USDT – Critical Decision Point| Accumulation or Breakdown?ETHFI is currently trading within its most critical zone since mid-year — the 1.00–0.85 range, which has long acted as the last stronghold of buyers. This area is a battle zone between large-scale accumulation or the final signal of distribution.
After facing prolonged downward pressure and failing to reclaim resistance at 1.80, the price is now retesting a strong demand zone — the same area that triggered a major rally earlier this year. The reaction from this region will define ETHFI’s next macro direction in the coming quarter.
The structure suggests the market is in a macro consolidation phase, where liquidity is being collected from both sides before the next major move. A stable 3D candle close above 1.00 could act as the first trigger for a new upward cycle, while a decisive close below 0.85 would confirm a continuation of the multi-month bearish trend.
---
🔶 Technical Structure & Pattern Analysis
Yellow Zone (1.00–0.85) is the key demand zone — the area where buyers previously stepped in aggressively.
Price is currently moving sideways above this zone, indicating potential accumulation in progress.
The previous sharp drop followed by long lower wicks suggests sellers may be losing momentum.
Key resistance remains at 1.40 – 1.80, while a 3D breakout above 1.40 would signal a structural shift to bullish.
---
🚀 Bullish Scenario
If ETHFI manages to hold and close a 3D candle above 1.00 and then breaks 1.40:
Buyers regain control, shifting structure to higher highs and higher lows.
Step targets:
1.80 → strong resistance level that capped previous rallies
2.42 → key confirmation of reversal
2.95 – 5.10 → potential expansion/euphoria phase
Main validation: 3D close above 1.40 with rising volume.
Defensive support: 0.90–0.95 as short-term buyer defense.
---
⚠️ Bearish Scenario
If price breaks below 0.85 and closes a 3D candle under this zone:
It confirms a major breakdown from the consolidation structure, opening room for deeper correction:
0.70 → next minor support
0.55 → critical retracement area
0.34 → historical extreme low
Such breakdowns often trigger panic selling or a capitulation move.
Bears remain in control if any retest of 0.85 fails to reclaim the zone.
---
📊 Key Levels (Quick Summary)
Major Support (Demand Zone): 1.00 – 0.85
Immediate Resistance: 1.40
Next Resistances: 1.80 → 2.42 → 2.95 → 5.10 – 5.40
Bearish Targets: 0.70 → 0.55 → 0.34
---
🧭 Macro Outlook & Sentiment Interpretation
ETHFI stands at a crossroads — is this the final phase of capitulation or the foundation of a long-term accumulation before reversal?
The 1.00–0.85 range could attract institutional buyers, yet without volume confirmation and a clear higher-high structure, the risk of a breakdown remains high.
This psychological zone will likely define ETHFI’s direction heading into Q1 2026.
---
🧠 Extra Insights for Traders
Wait for 3D candle close confirmation before committing to direction.
Avoid FOMO during sideways movement — focus on confirmed breakouts.
The best setups come from valid retests of support/resistance zones with real momentum.
Watch closely how price reacts in the yellow zone — whether it bounces with strong volume or breaks down impulsively.
---
#ETHFI #ETHFIUSDT #CryptoAnalysis #SwingTrade #CryptoSetup #TechnicalAnalysis #CryptoMarket #ReversalZone #CryptoTrading #SupportResistance #3DChart #CryptoOutlook

ETHFI – Potential Rebound from Major Support ZoneETHFI is currently testing a critical support zone between $0.60 and $0.80, a level that previously held strong during market corrections. Price structure appears to be respecting this level, and the RSI is nearing oversold territory, hinting at a possible momentum shift. This combination sets the stage for a potential bounce if current conditions hold.
🔹 Trade Idea Setup
📌 Entry Zone: $0.60 – $0.80
🎯 Take Profit Targets:
• TP1: $1.90
• TP2: $2.90
🛑 Stop Loss: $0.18
This setup presents a favorable risk-reward ratio, with entry at support and clearly defined targets. RSI signals are adding confluence, but always watch for volume confirmation and broader market behavior.

ETHFIUSDT → Correction to support consolidation. Rally?BINANCE:ETHFIUSDT is correcting after updating its local maximum to 1.9382. The breakout of the 1.6775 zone is an attempt to start distribution after a long consolidation. Will the bulls hold this zone?
Bitcoin is correcting after a false breakout of resistance. Against this backdrop, the entire cryptocurrency market is declining. However, the trend is bullish and the fundamental background is positive. The end of the correction may resume growth in the market.
ETHFI on the daily timeframe is trying to move into a distribution phase after 5-6 months of consolidation. The trend is upward, and after breaking through resistance, a correction to the liquidity zone of 1.6775 is forming. A false breakdown, a change in market imbalance, and consolidation above 1.6780 could increase buyer interest, which in turn could lead to growth.
Resistance levels: 1.8980, 1.9382
Support levels: 1.6775, 1.5343
The chart shows two key levels - 1.6775 and 1.5343. If the bulls hold their ground above the nearest level of 1.6775, this could lead to a rebound and growth, which in turn would confirm the continuation of the distribution phase. Otherwise, the market may test the POC zone at 1.5343, and liquidity capture may in turn trigger growth.
Best regards, R. Linda!

EtherFi ETH.fi price analysis⁉️ Increased trading volumes, shrinking growth candlesticks, and a trend line "overhang" - for us, these factors indicate the likelihood that a correction is near.... And for you?
The #ETHfi price shot up nicely thanks to promising updates to the #Ethereum ecosystem, about which we write a few posts early.
🟢 And of course, there are further prospects for the growth of the #Etherfi project, because now the capitalization is only $375 million.
🔴 But still, in our opinion, the price of OKX:ETHFIUSDT would still be suitable to slightly correct to $0.84-0.74-0.64, whoever likes which figure)
🔝 And from there, with new strength, break through the trend to new heights.
_____________________
Did you like our analysis? Leave a comment, like, and follow to get more

ETHERFI Double BottomOverview of Ether.fi
CRYPTOCAP:ETHFI on the Ethereum blockchain that allows users to stake their Ethereum (ETH) while maintaining control over their private keys.
It offers a liquid staking derivative token called eETH, enabling users to earn rewards and participate in decentralized finance (DeFi) activities.
Key Features
Liquid Staking Token (eETH)
Minting eETH: Users can mint eETH by staking their ETH, which allows for participation in various DeFi activities.
Reward Streams: Stakers earn multiple types of rewards, including:
Ethereum staking rewards
Ether.fi Loyalty Points
Restaking rewards (including EigenLayer points)
Liquidity provision opportunities in DeFi protocols
Cash Back Credit Card
Non-Custodial Card: Ether.fi offers a cash back credit card that connects to users' portfolios.
Cash Back Rate: Users earn 3% cash back on all purchases.
Global Acceptance: The card is accepted at over 100 million locations worldwide.
Market Information
Token Details
Total Value Locked (TVL) $12.487 billion
Circulating Supply 470 million ETHFI tokens
Trading Information
Exchanges: ETHFI can be traded on platforms like Gate, OKX, and Binance.
Daily Trading Volume: Approximately $83 million.
Ether.fi aims to enhance the Ethereum staking experience by providing innovative financial products and maximizing user rewards through its decentralized platform.

ETHFI has formed a bullish Head & Shoulders pattern📊 CRYPTOCAP:ETHFI Market Update
CRYPTOCAP:ETHFI has formed a bullish Head & Shoulders pattern 🟢
👉 Currently testing the red resistance zone 🔴
👉 If a breakout occurs, the first target will be the blue line level 🎯
⚡ Watch closely — breakout confirmation is key.

ETHFI 1H Analysis - Key Triggers Ahead👋🏻 Hey everyone! How’s it going? Hope you’re all doing well.
❄️ Welcome to Crypto Winter.
⏰ Today, we’ll be analyzing ETHFI and exploring its potential opportunities.
👀 On the 1-hour timeframe of the ETHFI coin, we can see that after an upward move and completing a very strong bullish leg, this coin has entered an accumulation phase, and with a breakout and confirmation above the top of this accumulation zone, it can resume its bullish move and continue higher. This coin is one of the strong DeFi coins that is responsible for restaking.
The identified triggers for this coin are the breakout of the taker seller zone and the price level of 1.533, which almost overlap. This means that this zone has both maker seller and taker seller, and with good buying volume, we can pass through this area.
🧮 Looking at the RSI oscillator, we see one important level at 70. Once momentum crosses this zone, the ETHFI could make a strong move with momentum, potentially entering either the overbought area.
🕯 The volume size and number of green candles at the end of this compression have increased, and even several times it has given indecision candles, and then moved to the bottom of this compression. Usually, to break the taker seller zone, we need a whale candle that in the pullback or stop hunt gives us an indecision candle.
💸 On the 1-hour timeframe of the ETHFIBTC pair, this trading symbol is currently in accumulation and moving upward. If this move is maintained and the interest rate news also comes with a multi-level decrease, this trading symbol can eliminate its taker seller zone in the pairs it has, fill the sell orders, and continue moving upward.
🧠 For entering this coin and taking a long trade, we must wait for the taker seller zone to break, and then enter the trade with an indecision candle. We can also set a stop loss, but it is not very safe because if unexpected news comes, the market can have high volatility. Risk management & capital management must not be forgotten, since the news will be released in 30 minutes.
❤️ Disclaimer : This analysis is purely based on my personal opinion and I only trade if the stated triggers are activated .

ETHFI Next Leg Could Deliver 200%+CRYPTOCAP:ETHFI has broken out of its bull flag pattern and cleared the key resistance trendline. This breakout signals a shift in momentum, showing that buyers are stepping back in with strength.
The structure looks constructive as long as price holds above the breakout zone, opening the door for a potential continuation move to the upside. Sustained momentum here could mark the beginning of a broader bullish leg.
In simple terms: ETHFI just confirmed a breakout, and holding above resistance keeps the bulls in control.
DYOR, NFA
Stay tuned for more updates
#PEACE

ETHFI - BULLISH DAILY BASIS CRYPTOCAP:ETHFI - bullish daily view 📈
Key support to be maintained: 1.270 - 1.300$

ETHFI ; Has purchase confirmation been given?Hello friends
Given the decline we had, the price has been in a good support and then managed to break through its resistance and now in the pullback we need to see the reaction of the buyers. If the Fibonacci support is maintained, the price can move to the specified Fibonacci steps, which has been specified.
Don't forget capital and risk management.
*Trade safely with us*

ETHFI | Swing Long Idea - AltcoinETHFI | Swing Long Idea
📊 Market Sentiment
Overall sentiment remains bullish, supported by expectations of a 0.25% rate cut in the upcoming FOMC meeting. A weakening USD and increased global risk appetite are creating favorable conditions for further upside in crypto assets.
ETHFI moves in close correlation with Ethereum’s price action. As ETH approaches all-time highs, fueled by a $1B single-day ETF inflow, ETHFI is also showing strong bullish potential.
Additionally, rumors about possible SEC approval of Ethereum staking policy could significantly increase ETHFI’s utility in the future — adding conviction to a long bias.
📈 Technical Analysis
Price broke a HTF key resistance and closed above.
The retest of this level confirmed it as strong support.
Price also broke the HTF bearish trendline, followed by a successful retest and bullish rejection.
📌 Game Plan
Long position entered at $1.2730 after rejection from the retest of the broken bearish trendline.
📋 Trade Management
Stoploss: Daily close below $1.14
Targets:
TP1: $1.41
TP2: $1.65
Trail stops aggressively to lock in profits as price moves favorably.
💬 Like, follow, and comment if you find this setup valuable!

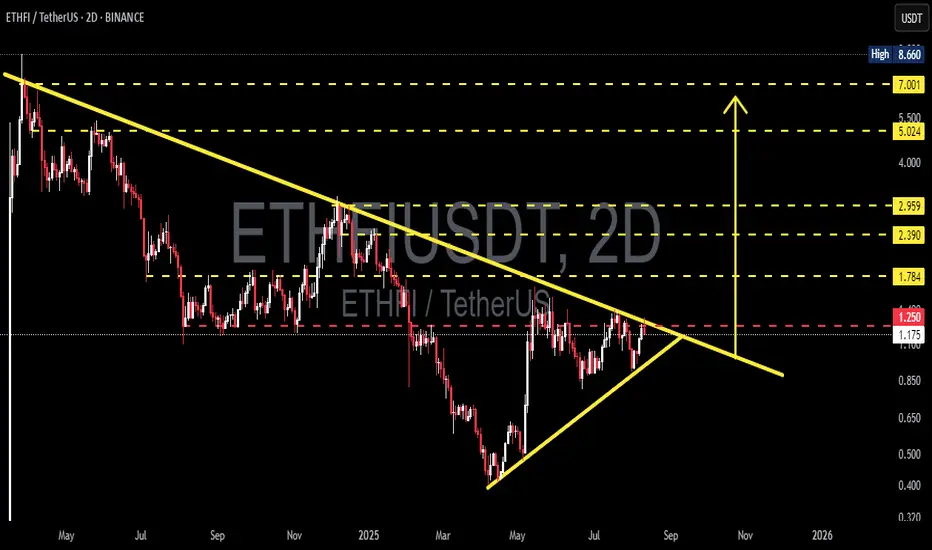
ETHFI/USDT — Symmetric Triangle at the Decision Point!The chart shows a symmetric triangle pattern (descending resistance + ascending support) approaching its apex. Price is currently testing the descending resistance area around 1.25 (red label) — a major decision point. Key horizontal targets/support levels are already marked on the chart (yellow).
---
Pattern Description
* Pair: ETHFI / USDT, 2-Day timeframe.
* Previous long-term trend: bearish (descending resistance line from the left).
* After bottoming near \~0.32–0.40, price formed higher lows (rising support) and lower highs (falling resistance) → creating a symmetric triangle / wedge.
* Volume typically contracts as the pattern nears the apex — this is a neutral-to-continuation pattern: often continues in the prior trend (bearish) but can also break upward strongly if there’s a catalyst.
---
Key Levels
Resistance / Upside targets:
* 1.250 — near-term resistance (↑ +6.4%).
* 1.784 — next major (↑ +51.8%).
* 2.390 (↑ +103.4%).
* 2.959 (↑ +151.8%).
* 5.024 (↑ +327.6%).
* 7.001 (↑ +495.8%).
* 8.660 (High, ↑ +637.0%).
Support / Downside levels:
* 0.850 (↓ −27.7%).
* 0.650 (↓ −44.7%).
* 0.500 (↓ −57.4%).
* 0.400 (↓ −66.0%).
* 0.320 (↓ −72.8%).
---
BULLISH Scenario (if breakout occurs):
* Breakout confirmation: 2D candle close above the descending resistance line + above 1.250, with increased volume. Ideally, a retest as support after the breakout.
* First target: 1.784 (conservative TP). If momentum is strong: 2.39 → 2.959.
* Risk management: stop loss below breakout candle or below the rising support line (e.g., entry at 1.30, stop \~1.00–1.05). Use position sizing to keep per-trade risk small (1–3% of capital).
* Significance: a break above will signal a potential *trend reversal* from long-term downtrend to accumulation/uptrend.
BEARISH Scenario (if breakdown occurs):
* Breakdown confirmation: 2D candle close below the rising support line with increased sell volume; failed retest confirms weakness.
* First target: 0.850. If selling pressure continues: 0.65 → 0.50 → 0.32.
* Risk management: if shorting, stop above retest/resistance (or above 1.25 if a failed breakout).
* Significance: since the prior long-term trend is bearish, a breakdown has high probability of trend continuation to the downside.
---
Trade Ideas
* Conservative: set alerts for 2D close > 1.25 + higher volume; partial entry, partial TP at 1.78, trail the rest.
* Aggressive: enter on breakout & retest of resistance as support.
* Bear setup: short after confirmed close below rising support & failed retest; target 0.85 first.
---
Technical & Psychological Notes:
* Pattern is very close to the apex → large move likely within the next few weeks on the 2D chart.
* Volume & candle close are key to avoid chasing fake breakouts.
* Also watch general crypto sentiment & news catalysts as they can trigger breakouts against the technical bias.
#ETHFI #Crypto #TechnicalAnalysis #Triangle #Breakout #SupportResistance #Altcoins #CryptoTrading #BullBear
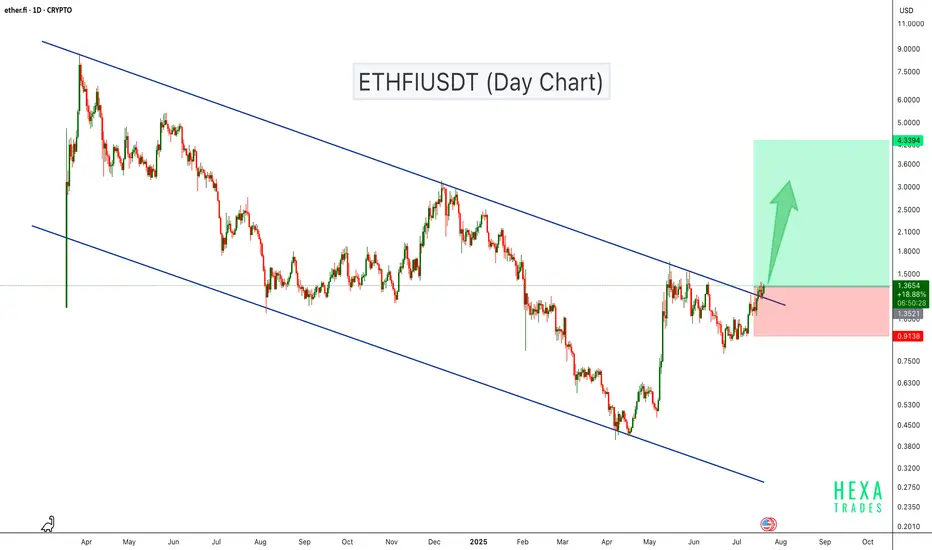
ETHFI Breaks Out of Descending Channel – Bullish Rally Ahead?ETHFI has been trading inside a descending channel for over a year, consistently respecting both resistance and support levels. Recently, the price broke above the channel resistance with strong bullish candles, suggesting a potential trend reversal.
This breakout indicates growing bullish momentum, and if the price sustains above the breakout level, we could see a move towards the $4.00–$4.70 range in the coming weeks.
Cheers
Hexa
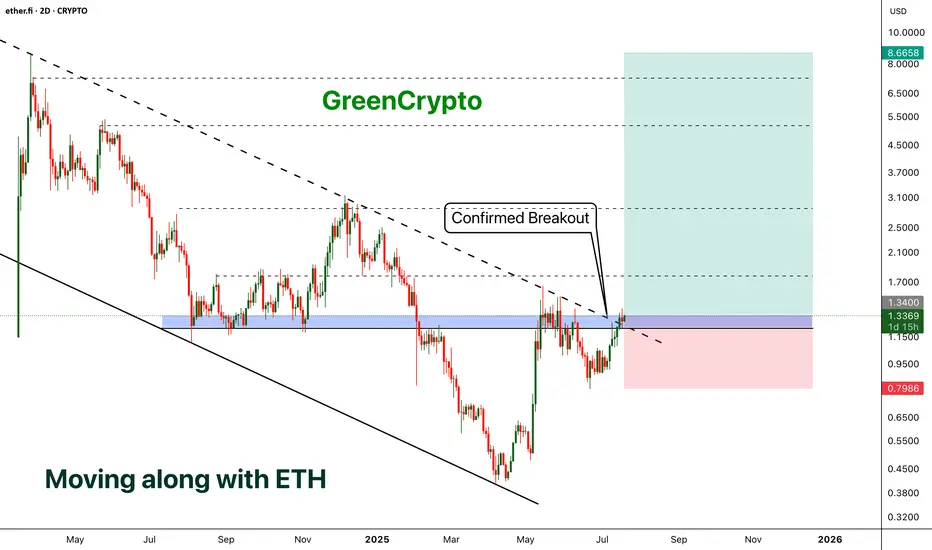
ETHFI - Moving along with the ETH- ETHFI has finally broken out from the descending channel pattern and now price is above the trending resistance line.
- We can expect a minor reversal (chances are less ) and parabolic move from here.
- I'm expecting at-least 500+% profit from this opportunity
Entry Price: 1.3384
Stop Loss: 0.7965
TP1: 1.7657
TP2: 2.5436
TP3: 4.5055
TP4: 5.6136
TP5: 8.5626
Max Leverage 5x.
Don't forget to keep stoploss.
Support us by Liking and following.
Thanks and Cheers!
GreenCrypto
ETHFI Coil Tightens Above Key SupportThis is ETHFI on the daily.
It’s currently consolidating above four major support levels:
• The black line at $1.097
• The 200-day MA
• The 50-day MA
• Bollinger Band center
A golden cross is approaching, and if price pushes higher, it could confirm soon. RSI is holding strong above both the 50 level and the signal line, suggesting bullish momentum is intact.
There’s also a bullish triangle forming between the series of lower highs and the $1.097 black line. Volume is decreasing, just as expected before a breakout. While breakouts can technically go either way, my bias remains bullish here.
From a fundamental standpoint, ETHFI benefits from the rising trend of restaking staked ETH, now regulated and attracting serious institutional interest.
Holding this support and completing the golden cross could be a volatile process, especially with ETHFI’s small $424M market cap and big macro events this week (like CPI and potential tariff news) on the radar.
Always take profits and manage risk.
Interaction is welcome.

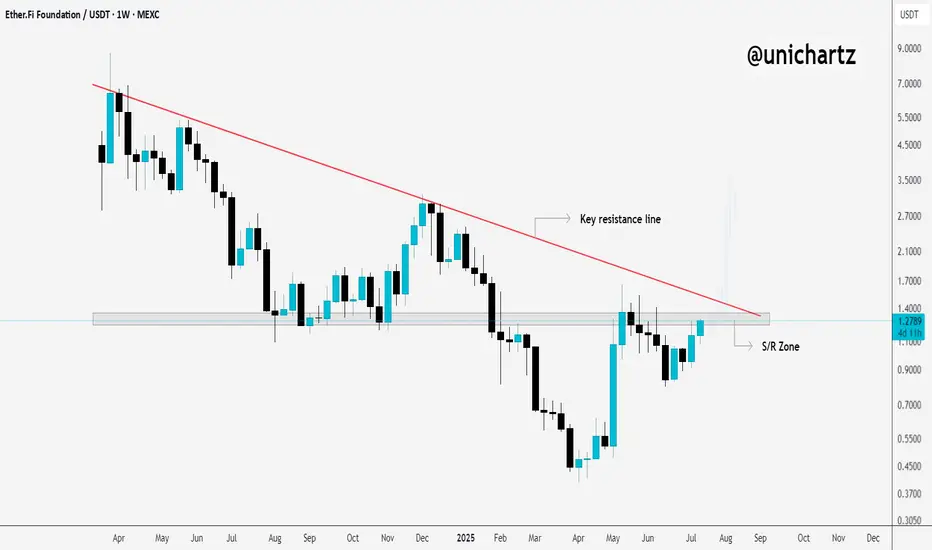
ETHFI Bulls Need to Flip This Level for Upside ContinuationCRYPTOCAP:ETHFI is still hovering around the key S/R zone and trading just below the major trendline resistance on the weekly timeframe.
This area has been a strong rejection point in the past, so it’s a crucial level to watch.
If we get a clean breakout and weekly close above this zone, it could trigger a breakout from the long-term downtrend, potentially kicking off a fresh bullish move.
Keep a close eye. A decisive move is coming.
DYOR, NFA
ETHFI/USDT – BREAKOUT ALERT! Descending Trendline Under Pressure
After over a year of relentless bearish pressure, ETHFI is now approaching a critical technical juncture that could mark the beginning of a major trend reversal. The chart displays a long-term descending trendline, and bulls are now challenging it with growing strength. This setup could lead to a powerful breakout and a potential trend shift.
🧩 Technical Pattern Overview:
🔸 Descending Trendline Resistance – Established since April 2024, acting as a dominant resistance across multiple retests.
🔸 Base Accumulation – Price has formed a strong base between $0.80–$1.00, indicating declining selling pressure and potential accumulation.
🔸 Volatility Squeeze – Price action is tightening near the apex of the descending triangle, suggesting that a breakout (up or down) is imminent.
🔸 Breakout Watch – A confirmed breakout above $1.25 would be a major bullish signal.
🐂 Bullish Scenario (Confirmed Breakout):
If the price breaks and closes above $1.25 with strong volume:
🎯 Potential Upside Targets:
Target 1: $1.784 – Previous local resistance
Target 2: $2.390 – Former consolidation zone
Target 3: $2.959 – Key psychological resistance
Extended Targets: $5.024 and $7.001 if a sustained rally unfolds
Ultimate ATH: $8.660 – If the broader crypto market enters full bullish mode
💡 Catalysts to Watch: Altseason, project news, favorable macro sentiment, or exchange listings.
🐻 Bearish Scenario (Rejection at Resistance):
If ETHFI fails to break out and gets rejected at the descending trendline:
🔻 Potential Downside Levels:
$1.088 – Immediate support
$0.88 – Minor support
$0.70 – Historical support zone
$0.50 to $0.35 – Deeper bearish targets if selling resumes
⚠️ Fakeouts are common during volatile phases — always wait for confirmation with volume.
📌 Conclusion & Strategy:
ETHFI is at a make-or-break level. A confirmed breakout could trigger a strong upward rally with high risk/reward potential. However, failure to break resistance could lead to continued consolidation or even downside.
🔍 Traders should watch for a clean breakout above $1.25, preferably with high volume. Risk management is key — define your invalidation levels and stick to your plan.
🧠 Trading Recommendations:
🟢 Breakout traders: Wait for confirmation > $1.25
🟡 Accumulate: Between $0.90–$1.00
🔴 Stop-loss: Below $0.85 for conservative risk
📈 Risk/Reward after breakout: Attractive (1:3 or better)
#ETHFI #ETHFIUSDT #CryptoBreakout #DescendingTrendline #AltcoinAnalysis #TechnicalAnalysis #BreakoutTrading #CryptoSignals #BullishReversal

ETHFIUSDT Breakout Loading!CRYPTOCAP:ETHFI is consolidating within a symmetrical triangle on the 4H chart, with price tightening between descending resistance and rising support. A breakout or breakdown is likely soon. Watch for volume confirmation. Key levels to watch: $1.35 (resistance) and $1.00 (support). Breakout could lead to $1.50+, while breakdown risks a drop toward $0.95.

ETHFIUSDT breakdown alertETHFIUSDT breakdown alert
ETHFIUSDT has broken down from a triangle pattern and appears to have completed a retest of the breakdown zone. If the price fails to reclaim this level and continues to reject it, we could see further downside pressure in the coming sessions.
Key levels to monitor:
– Breakdown zone now acting as resistance
– Immediate support below
– Volume confirmation to validate the move
Watch ETHFI closely — if the retest holds, it may lead to continued bearish momentum.

ETHFIUSDT 2D AnalysisETHFI ~ 2D Analysis
#ETHFI Buy after successfully breaking this resistance line with a short term target of at least 15%+ and a long term target of $8.7

ETHFIUSDT | Bearish Bias Below the Red BoxETHFIUSDT isn’t showing strength here. Price is stuck below a clear red box resistance, and as long as that holds, my bias stays short.
There’s no sign of buyer aggression. CDV remains flat, and any volume upticks have been absorbed. Unless that red box is broken and retested, I see no reason to flip bullish.
Short ideas stay valid until proven otherwise.
Let the market earn your trust — not the other way around.
📌I keep my charts clean and simple because I believe clarity leads to better decisions.
📌My approach is built on years of experience and a solid track record. I don’t claim to know it all but I’m confident in my ability to spot high-probability setups.
📌If you would like to learn how to use the heatmap, cumulative volume delta and volume footprint techniques that I use below to determine very accurate demand regions, you can send me a private message. I help anyone who wants it completely free of charge.
🔑I have a long list of my proven technique below:
🎯 ZENUSDT.P: Patience & Profitability | %230 Reaction from the Sniper Entry
🐶 DOGEUSDT.P: Next Move
🎨 RENDERUSDT.P: Opportunity of the Month
💎 ETHUSDT.P: Where to Retrace
🟢 BNBUSDT.P: Potential Surge
📊 BTC Dominance: Reaction Zone
🌊 WAVESUSDT.P: Demand Zone Potential
🟣 UNIUSDT.P: Long-Term Trade
🔵 XRPUSDT.P: Entry Zones
🔗 LINKUSDT.P: Follow The River
📈 BTCUSDT.P: Two Key Demand Zones
🟩 POLUSDT: Bullish Momentum
🌟 PENDLEUSDT.P: Where Opportunity Meets Precision
🔥 BTCUSDT.P: Liquidation of Highly Leveraged Longs
🌊 SOLUSDT.P: SOL's Dip - Your Opportunity
🐸 1000PEPEUSDT.P: Prime Bounce Zone Unlocked
🚀 ETHUSDT.P: Set to Explode - Don't Miss This Game Changer
🤖 IQUSDT: Smart Plan
⚡️ PONDUSDT: A Trade Not Taken Is Better Than a Losing One
💼 STMXUSDT: 2 Buying Areas
🐢 TURBOUSDT: Buy Zones and Buyer Presence
🌍 ICPUSDT.P: Massive Upside Potential | Check the Trade Update For Seeing Results
🟠 IDEXUSDT: Spot Buy Area | %26 Profit if You Trade with MSB
📌 USUALUSDT: Buyers Are Active + %70 Profit in Total
🌟 FORTHUSDT: Sniper Entry +%26 Reaction
🐳 QKCUSDT: Sniper Entry +%57 Reaction
📊 BTC.D: Retest of Key Area Highly Likely
📊 XNOUSDT %80 Reaction with a Simple Blue Box!
📊 BELUSDT Amazing %120 Reaction!
📊 Simple Red Box, Extraordinary Results
I stopped adding to the list because it's kinda tiring to add 5-10 charts in every move but you can check my profile and see that it goes on..

EtherFi Governance Token & The 2025 Bull Market (PP: 1,111%)EtherFi is hot right now just as Ethereum is very hot. The project looks really good with great offerings, great products... Let's consider the chart. If you have a good product with a great chart, that's a combination for a massive 2025 bull market. You are bound to get numbers beyond this chart.
The long-term support and accumulation zone was lost in late February/early March. It was recovered again in May. The bottom was only available for two months. You are one of the lucky few if you decided to buy at bottom prices. Prices that will never become available again.
ETHFI is back above its August 2024 low, thus bullish; now trading with a bullish bias within its long-term accumulation zone. A price zone where we can buy, big, focusing on the long-term. A great chart, huge potential for growth, can't say it often enough.
There is really high volume here, the highest since launch date.
This high volume indicates and confirms that the bottom is in. If prices were to move back lower, trading volume the past two weeks would be much lower. Since prices are set to grow, volume is really high, the whales are loading up.
Not all is lost. It is still early because the last drop was a stop-loss hunt event. Notice the blue space on the chart, this is the standard buy zone. Here, in this range, ETHFIUSDT traded for more than 3 months in 2024.
A bull market can be expected now, a bullish trend.
Nice and easy, buy and hold; the market will take care of the rest.
This post is meant to alert you of a great entry timing and prices.
This is for spot traders. An easy buy. —Focused on the long-term.
Thank you for reading.
Namaste.
