ETHFI/USDT – Critical Decision Point| Accumulation or Breakdown?ETHFI is currently trading within its most critical zone since mid-year — the 1.00–0.85 range, which has long acted as the last stronghold of buyers. This area is a battle zone between large-scale accumulation or the final signal of distribution.
After facing prolonged downward pressure and failing to reclaim resistance at 1.80, the price is now retesting a strong demand zone — the same area that triggered a major rally earlier this year. The reaction from this region will define ETHFI’s next macro direction in the coming quarter.
The structure suggests the market is in a macro consolidation phase, where liquidity is being collected from both sides before the next major move. A stable 3D candle close above 1.00 could act as the first trigger for a new upward cycle, while a decisive close below 0.85 would confirm a continuation of the multi-month bearish trend.
---
🔶 Technical Structure & Pattern Analysis
Yellow Zone (1.00–0.85) is the key demand zone — the area where buyers previously stepped in aggressively.
Price is currently moving sideways above this zone, indicating potential accumulation in progress.
The previous sharp drop followed by long lower wicks suggests sellers may be losing momentum.
Key resistance remains at 1.40 – 1.80, while a 3D breakout above 1.40 would signal a structural shift to bullish.
---
🚀 Bullish Scenario
If ETHFI manages to hold and close a 3D candle above 1.00 and then breaks 1.40:
Buyers regain control, shifting structure to higher highs and higher lows.
Step targets:
1.80 → strong resistance level that capped previous rallies
2.42 → key confirmation of reversal
2.95 – 5.10 → potential expansion/euphoria phase
Main validation: 3D close above 1.40 with rising volume.
Defensive support: 0.90–0.95 as short-term buyer defense.
---
⚠️ Bearish Scenario
If price breaks below 0.85 and closes a 3D candle under this zone:
It confirms a major breakdown from the consolidation structure, opening room for deeper correction:
0.70 → next minor support
0.55 → critical retracement area
0.34 → historical extreme low
Such breakdowns often trigger panic selling or a capitulation move.
Bears remain in control if any retest of 0.85 fails to reclaim the zone.
---
📊 Key Levels (Quick Summary)
Major Support (Demand Zone): 1.00 – 0.85
Immediate Resistance: 1.40
Next Resistances: 1.80 → 2.42 → 2.95 → 5.10 – 5.40
Bearish Targets: 0.70 → 0.55 → 0.34
---
🧭 Macro Outlook & Sentiment Interpretation
ETHFI stands at a crossroads — is this the final phase of capitulation or the foundation of a long-term accumulation before reversal?
The 1.00–0.85 range could attract institutional buyers, yet without volume confirmation and a clear higher-high structure, the risk of a breakdown remains high.
This psychological zone will likely define ETHFI’s direction heading into Q1 2026.
---
🧠 Extra Insights for Traders
Wait for 3D candle close confirmation before committing to direction.
Avoid FOMO during sideways movement — focus on confirmed breakouts.
The best setups come from valid retests of support/resistance zones with real momentum.
Watch closely how price reacts in the yellow zone — whether it bounces with strong volume or breaks down impulsively.
---
#ETHFI #ETHFIUSDT #CryptoAnalysis #SwingTrade #CryptoSetup #TechnicalAnalysis #CryptoMarket #ReversalZone #CryptoTrading #SupportResistance #3DChart #CryptoOutlook
ETHFIUSDC

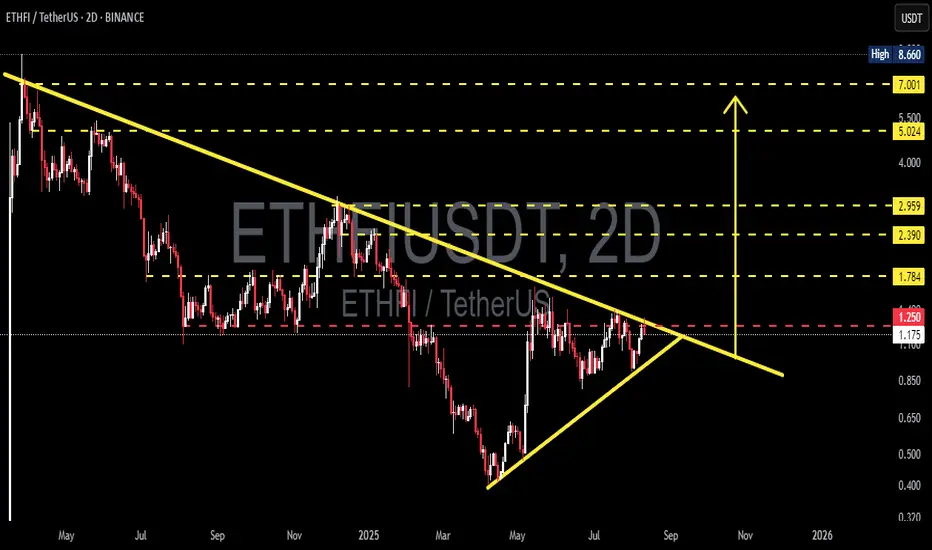
ETHFI/USDT — Symmetric Triangle at the Decision Point!The chart shows a symmetric triangle pattern (descending resistance + ascending support) approaching its apex. Price is currently testing the descending resistance area around 1.25 (red label) — a major decision point. Key horizontal targets/support levels are already marked on the chart (yellow).
---
Pattern Description
* Pair: ETHFI / USDT, 2-Day timeframe.
* Previous long-term trend: bearish (descending resistance line from the left).
* After bottoming near \~0.32–0.40, price formed higher lows (rising support) and lower highs (falling resistance) → creating a symmetric triangle / wedge.
* Volume typically contracts as the pattern nears the apex — this is a neutral-to-continuation pattern: often continues in the prior trend (bearish) but can also break upward strongly if there’s a catalyst.
---
Key Levels
Resistance / Upside targets:
* 1.250 — near-term resistance (↑ +6.4%).
* 1.784 — next major (↑ +51.8%).
* 2.390 (↑ +103.4%).
* 2.959 (↑ +151.8%).
* 5.024 (↑ +327.6%).
* 7.001 (↑ +495.8%).
* 8.660 (High, ↑ +637.0%).
Support / Downside levels:
* 0.850 (↓ −27.7%).
* 0.650 (↓ −44.7%).
* 0.500 (↓ −57.4%).
* 0.400 (↓ −66.0%).
* 0.320 (↓ −72.8%).
---
BULLISH Scenario (if breakout occurs):
* Breakout confirmation: 2D candle close above the descending resistance line + above 1.250, with increased volume. Ideally, a retest as support after the breakout.
* First target: 1.784 (conservative TP). If momentum is strong: 2.39 → 2.959.
* Risk management: stop loss below breakout candle or below the rising support line (e.g., entry at 1.30, stop \~1.00–1.05). Use position sizing to keep per-trade risk small (1–3% of capital).
* Significance: a break above will signal a potential *trend reversal* from long-term downtrend to accumulation/uptrend.
BEARISH Scenario (if breakdown occurs):
* Breakdown confirmation: 2D candle close below the rising support line with increased sell volume; failed retest confirms weakness.
* First target: 0.850. If selling pressure continues: 0.65 → 0.50 → 0.32.
* Risk management: if shorting, stop above retest/resistance (or above 1.25 if a failed breakout).
* Significance: since the prior long-term trend is bearish, a breakdown has high probability of trend continuation to the downside.
---
Trade Ideas
* Conservative: set alerts for 2D close > 1.25 + higher volume; partial entry, partial TP at 1.78, trail the rest.
* Aggressive: enter on breakout & retest of resistance as support.
* Bear setup: short after confirmed close below rising support & failed retest; target 0.85 first.
---
Technical & Psychological Notes:
* Pattern is very close to the apex → large move likely within the next few weeks on the 2D chart.
* Volume & candle close are key to avoid chasing fake breakouts.
* Also watch general crypto sentiment & news catalysts as they can trigger breakouts against the technical bias.
#ETHFI #Crypto #TechnicalAnalysis #Triangle #Breakout #SupportResistance #Altcoins #CryptoTrading #BullBear
ETHFI Swing Buy / Long SetupWait for the entry, Must use SL, liquidation pending both sides, So wait for the one side to clear first. I'm not bearish on alts, until btc.d doesn't closes above 63%.

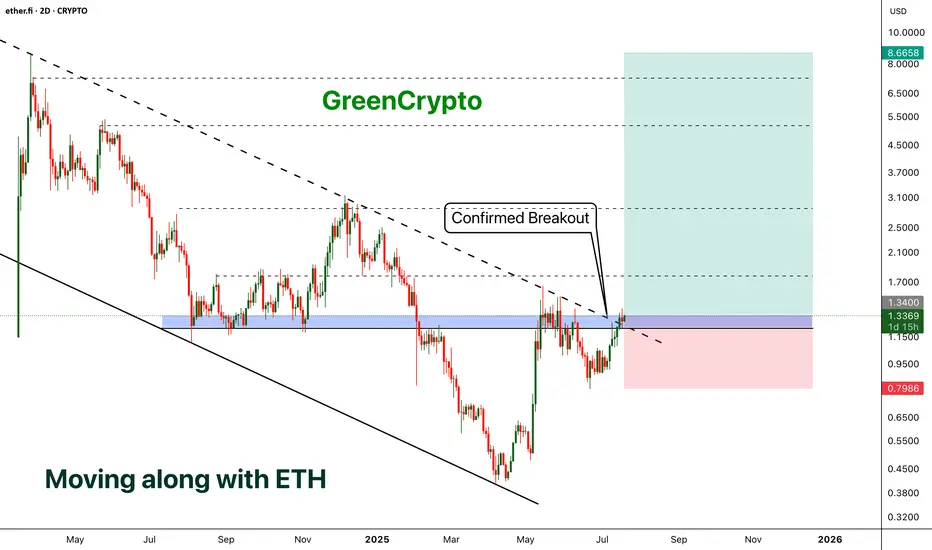
ETHFI - Moving along with the ETH- ETHFI has finally broken out from the descending channel pattern and now price is above the trending resistance line.
- We can expect a minor reversal (chances are less ) and parabolic move from here.
- I'm expecting at-least 500+% profit from this opportunity
Entry Price: 1.3384
Stop Loss: 0.7965
TP1: 1.7657
TP2: 2.5436
TP3: 4.5055
TP4: 5.6136
TP5: 8.5626
Max Leverage 5x.
Don't forget to keep stoploss.
Support us by Liking and following.
Thanks and Cheers!
GreenCrypto
ETHFI/USDT – BREAKOUT ALERT! Descending Trendline Under Pressure
After over a year of relentless bearish pressure, ETHFI is now approaching a critical technical juncture that could mark the beginning of a major trend reversal. The chart displays a long-term descending trendline, and bulls are now challenging it with growing strength. This setup could lead to a powerful breakout and a potential trend shift.
🧩 Technical Pattern Overview:
🔸 Descending Trendline Resistance – Established since April 2024, acting as a dominant resistance across multiple retests.
🔸 Base Accumulation – Price has formed a strong base between $0.80–$1.00, indicating declining selling pressure and potential accumulation.
🔸 Volatility Squeeze – Price action is tightening near the apex of the descending triangle, suggesting that a breakout (up or down) is imminent.
🔸 Breakout Watch – A confirmed breakout above $1.25 would be a major bullish signal.
🐂 Bullish Scenario (Confirmed Breakout):
If the price breaks and closes above $1.25 with strong volume:
🎯 Potential Upside Targets:
Target 1: $1.784 – Previous local resistance
Target 2: $2.390 – Former consolidation zone
Target 3: $2.959 – Key psychological resistance
Extended Targets: $5.024 and $7.001 if a sustained rally unfolds
Ultimate ATH: $8.660 – If the broader crypto market enters full bullish mode
💡 Catalysts to Watch: Altseason, project news, favorable macro sentiment, or exchange listings.
🐻 Bearish Scenario (Rejection at Resistance):
If ETHFI fails to break out and gets rejected at the descending trendline:
🔻 Potential Downside Levels:
$1.088 – Immediate support
$0.88 – Minor support
$0.70 – Historical support zone
$0.50 to $0.35 – Deeper bearish targets if selling resumes
⚠️ Fakeouts are common during volatile phases — always wait for confirmation with volume.
📌 Conclusion & Strategy:
ETHFI is at a make-or-break level. A confirmed breakout could trigger a strong upward rally with high risk/reward potential. However, failure to break resistance could lead to continued consolidation or even downside.
🔍 Traders should watch for a clean breakout above $1.25, preferably with high volume. Risk management is key — define your invalidation levels and stick to your plan.
🧠 Trading Recommendations:
🟢 Breakout traders: Wait for confirmation > $1.25
🟡 Accumulate: Between $0.90–$1.00
🔴 Stop-loss: Below $0.85 for conservative risk
📈 Risk/Reward after breakout: Attractive (1:3 or better)
#ETHFI #ETHFIUSDT #CryptoBreakout #DescendingTrendline #AltcoinAnalysis #TechnicalAnalysis #BreakoutTrading #CryptoSignals #BullishReversal

ETHFIUSDT Breakout Loading!CRYPTOCAP:ETHFI is consolidating within a symmetrical triangle on the 4H chart, with price tightening between descending resistance and rising support. A breakout or breakdown is likely soon. Watch for volume confirmation. Key levels to watch: $1.35 (resistance) and $1.00 (support). Breakout could lead to $1.50+, while breakdown risks a drop toward $0.95.

ETHFIUSDT 2D AnalysisETHFI ~ 2D Analysis
#ETHFI Buy after successfully breaking this resistance line with a short term target of at least 15%+ and a long term target of $8.7
