Coinranger|ETHUSDT. Uncertainty at 1970🔥News
🔹US unemployment data will be released at 16:30 UTC+3. It will be important if the actual numbers differs significantly from the forecast.
🔥ETH
🔹Something new on ETH:
1️⃣ There's a dynamic 2000 and its extension at 2060 above. There's a chance of a sharp rise to 2160, but there's nothing to support it yet.
2️⃣ 1880 and 1817 are relevant below. Downward movement still has a priority.
Selling trades should be making cautionly today, although the priority for a downward move remains, there is a possibility of sharp price surges upward.
---------------
Share your thoughts in the comments!
Ethusdtanalysis

Coinranger|ETHUSDT. Continued decline🔥News
🔹Unemployment data at 16:30 UTC+3
🔥ETH
🔹On Ethereum levels:
1️⃣ Dynamic 2040 above.
2️⃣ Almost got 1930 below. Then 1880 is possible, and if we're really lucky, 1817.
Be careful at 16:30 UTC+3. Increased volatility is possible.
---------------
Share your thoughts in the comments!

ETHUSDT: Bullish Push to 2750?As the previous analysis worked exactly as predicted, BINANCE:ETHUSDT is eyeing a bullish rebound on the 4-hour chart , with price forming higher lows after a pullback to support, converging with a potential entry zone that could ignite upside momentum if buyers defend amid recent consolidation. This setup suggests a recovery opportunity post-correction, targeting higher resistance levels with overall 1:8 risk-reward .🔥
Entry between 2180–2200 for a long position. Targets at 2550 (first), 2750 (second). Set a stop loss at a daily close below 2150 , yielding a risk-reward ratio of 1:8 in total . Monitor for confirmation via a bullish candle close above entry with rising volume, leveraging Ethereum's volatility near support.🌟
📝 Trade Setup
🎯 Entry (Long):
2180 – 2200
🎯 Targets:
• TP1: 2550
• TP2: 2750
❌ Stop Loss:
• Daily close below 2150
⚖️ Risk-to-Reward:
• Up to 1:8 overall
⚠️ Risk Level: High
💡 Bias Summary:
As long as ETH holds above 2150, the bias remains bullish for a rebound toward 2550 → 2750. A clean breakdown below support would shift the outlook bearish.

#ETHUSDT: Still Waiting For Price To Come Down $2000 LevelETHUSDT OVERVIEW! 🏆🚀
🔺The market is still showing signs of weakness. We’re seeing a lot of traders getting tired of buying at the $3400 level, which is a big deal for many swing traders. Right now, we’re still thinking it’s best to buy ETH when it’s at the lower price of $2000. To do this, we need the price to drop a lot, with lots of strong bearish trading happening each day.
🔺We’re aiming to get in at $2000, but it might take some time for the price to get there. We’re going to wait for a clear sign from the market.Right now, the main reason people are buying is because of what’s happening with the fundamentals, and we think those will settle down soon. Once they do, we expect the price to go down a bit.
🔺When you’re trading cryptocurrency, it’s really important to be careful with your risk. It can be risky and you could lose all your money. This analysis is just to help you learn, so please do your own research and make sure you understand the risks.
Team SetupsFX❤️🧠

Coinranger|ETHUSDT. Moving to H16 aim level🔥News
🔹JOLTS employment report at 18:00 UTC+3
🔥ETH
🔹Monday's forecast is still actual:
1️⃣ There are dynamic 2150 and 2240 levels above.
2️⃣ 1970 below is still actual. Level of h16.
Expecting a breakout of the level below.
---------------
Share your thoughts in the comments!

Coinranger|ETHUSDT. Reversal or continued decline?🔥News
🔹Today, the US votes on the government budget.
🔹US manufacturing PMI at 18:00 UTC+3
🔥ETH
🔹Fell below 2170. What now:
1️⃣ Above there is 2450, but the level is dynamic. We'll look at the averages.
2️⃣ Below there are 2090 and 1970 - levels on h4 and h16. But we won't necessarily reach there; a pullback could begin around the current level.
Any negative will push prices lower. Entry points from the current level are dangerous; we're waiting for one of the following scenarios (a pullback or a further decline).
---------------
Share your opinion in the comments!

ETHEREUM(ETHUSDT): One Final Drop Then $8000 Long Term ViewDear traders,
I hope you’re doing well. ETHUSDT is on the brink of a strong bullish reversal and a shift in momentum. We now have a strong possibility of an impulse pattern with price moving in a powerful upward bullish trend. However, we need strong confirmation before committing to this analysis. This confirmation will make our decision easier. Our final target is $8000, but it may take some time to reach.
Good luck and trade safely. If you like our work, please like and comment for more. Also, follow us for the latest updates.
Team Setupsfx_

Coinranger|ETHUSDT. Potential reversal to 3137🔥News
🔹Fed rates at 22:00 UTC+3, FOMC press conference at 22:30 UTC+3. We can fly on this news.
🔹US earnings season is in full swing.
🔥 ETH
🔹A Bitcoin-like situation:
1️⃣ We took 3036. Above that, there are 3072 and 3137. Potential for now. This is a full set of upward waves.
2️⃣ 2950 below is the level for a move until evening. Below that: 2888, 2876, and 2768 - are a full set of downside waves.
I expect a flat between 3036 and 2950 before rate issue. After that, an upward movement is very likely.
---------------
Share your opinion in the comments!

Coinranger|ETHUSDT. Continuing decline to 2666🔥News
🔹No important news today. Only an old data on american market will be released, which is usually considered preliminary.
🔥ETH
🔹Fell and completed the first extension for the second set of downside waves:
1️⃣ Above a pullback to 2920 is taking place. Potentially, but unlikely, we could reach 3036.
2️⃣ There is 2858 level below. One of a possible extension. 2666 and 2621 are potential levels for a new set of downward waves, the third set in the decline.
A continuation of the decline is likely, especially if Bitcoin decides it's too early for pullback.
---------------
Share your thoughts in the comments!

Coinranger|ETHUSDT. Flat at 2826 - 3058?🔥News
🔹The WEF continues. Preliminary US manufacturing and services PMI data will issue at 17:45 (UTC+3) - no sharp movements expected.
🔥ETH
🔹Ethereum price situation is pretty the same as yesterday's:
1️⃣ The minor correction of levels above. Now there are: 3170, 3102, 3058.
2️⃣ 2826 below is still actual.
The price is forming triangle, and it's not as confident as Bitcoin's. Current prices look more like a continuation of the downward movement (but that's not a fact). I'd say Ethereum is more likely to breakout of 2826 and then pullback. Possibly by the end of the weekend.
---------------
Share your thoughts in the comments!

Coinranger|ETHUSDT. Uncertainty after the fall🔥News
🔹The International Economic Forum continues. Trump's speech is at 16:30 (UTC+3)
🔥ETH
🔹Ethereum has made two full sets down in a couple of days. According to the forecast. What's next:
1️⃣ 3115 above. A dynamic level, it will continue to slide lower. Preliminary.
2️⃣ 2950 and 2910 are possible moves down below. But we can immediately start moving higher without reaching them.
A pullback is the priority; a movement lower is possible, but not necessary.

Ethereum (ETHUSDT) — D1 | Structural Decision ZoneEthereum (ETHUSDT) — D1 | Structural Decision Zone
Price is trading inside a compression structure after a strong impulsive move, with higher-timeframe context becoming decisive.
🧩 Technical Overview
• On the higher timeframe, ETH is forming a potential 5th wave, suggesting the market is approaching the final stage of the broader impulsive structure.
• The recent move above the descending channel was followed by a corrective ABC structure, typical after a breakout from long-term compression.
• Price is currently reacting near the upper boundary of the corrective structure, indicating a key decision area.
📈 Bullish Scenario
• A sustained breakout and acceptance above 3,250–3,300 would confirm continuation of the 5th wave.
• In this case, upside expansion targets open toward:
– 3,450–3,600
– 3,850–4,100 (higher-timeframe resistance zone)
Bullish continuation requires holding above the former breakout structure and avoiding a deep retracement back into the channel.
📉 Bearish / Corrective Scenario
• Failure to hold above 3,100–3,050 would confirm continuation of the ABC correction.
• Downside targets in this scenario:
– 2,815
– 2,574
– 2,120 (major higher-timeframe support)
A breakdown back below the channel would invalidate the immediate bullish continuation thesis.
🧭 Market Context
• Higher timeframe points to a late-cycle structure (5th wave).
• ABC correction after channel breakout fits a distribution / re-accumulation phase.
• Volatility expansion is likely once price exits the current compression.
🧠 Summary
ETH is at a critical structural level.
Acceptance above resistance favors 5th wave continuation, while rejection keeps the market in a corrective ABC phase with downside risks toward lower supports.

Coinranger|ETHUSDT. Pullback to 3250 and back down again🔥News
🔹The International Economic Forum in Davos begins today and will continue all week. America is closed for M. Luther King Day. No other significant news.
🔥ETH
🔹Also fell overnight following Bitcoin. Due to a slight rise before the fall, the levels at the bottom shifted slightly, but a full set of downward waves was ended. New levels:
1️⃣ Above there are pullback levels on the H1 timeframe: 3286 and 3250
2️⃣ The previous wave set expansion targets are still actual: 3120 and 3060
Priority is given to a pullback, likely to 3250. Then down to 3120.
-------------------
Share your opinion in the comments.

Coinranger|ETHUSDT. Will it grows yet?🔥News
🔹No important news today. Potentially, Trump could start doing something in Iran. And, as we remember, in such cases, crypto can go down rapidly.
🔥ETH
🔹Stays within yesterday's forecast:
1️⃣ Levels above: 3373 and 3460.
2️⃣ Levels below with the minor changes: 3264, 3230, and 3160.
We'll be following Bitcoin. For now, the priority is to go lower. The minimum target at the bottom is 3264. An upward move is fragile, but not impossible.

Coinranger|ETHUSDT. Is further growth possible?🔥News
🔹Today at 16:30 (UTC +3) will issue the US PPI data for December, and most likely for October at the same time. Also included are retail sales at the same time.
🔥ETH
🔹Roughly repeated BTC's success yesterday. Levels:
1️⃣ Above - 3373 and 3460.
2️⃣ Below: 3290, 3190, and 3135 (preliminary calculations)
We'll be following Bitcoin. For now, the priority is a decline. At best, we'll hit 3190 from below. Watch out for the news. 3460 is most likely from above, but not necessarily.

ETHUSDT: Bullish Push to 3435?As the previous analysis worked exactly as predicted, BINANCE:ETHUSDT is eyeing a bullish breakout on the 4-hour chart , with price rebounding from consolidation after a pullback and breakout candle, forming higher lows that could trigger upside momentum if buyers defend amid recent volatility. This setup suggests a continuation opportunity post-correction, targeting higher levels with near 1:5 risk-reward overall.🔥
Entry between 3090–3100 for a long position (entry from current price with proper risk management is recommended)🎯. Targets at 3255 (first) , 3435 (second) . Set a stop loss at a daily close below 3050 , yielding a risk-reward ratio of near 1:5 overall. Monitor for confirmation via a bullish candle close above entry with rising volume, leveraging Ethereum's resilience post-pullback.🌟
📝 Trade Setup
🎯 Entry (Long):
3090 – 3100
(Entry from current price is valid with proper risk & position sizing.)
🎯 Targets:
• 3255 (first target)
• 3435 (second target)
❌ Stop Loss:
• Daily close below 3050
⚖️ Risk-to-Reward:
• ~1:5 overall
💡 Your view?
Does ETHUSDT continue this breakout toward 3255 → 3435, or do you expect another consolidation before the next leg up? 👇

Coinranger|ETHUSDT. Potential pullback to 3100 and below.🔹At 16:15 UTC+3 - ADP nonfarm payrolls data.
🔹At 18:00 UTC+3 - PMI in services and the JOLTS employment report. More important.
Volatility is possible on both news
🔥ETH
🔹Almost reached the ideal extension on h1:
1️⃣ 3336 and 3386 are still potentially significant.
2️⃣ 3152, 3100 (potential turning point), 3025, and 2960 is a full set of downward waves with extensions.
We're keeping an eye on Bitcoin. The advantage for price reduction.

ETHUSDT: Bearish Drop to 2840?BINANCE:ETHUSDT is eyeing a bearish reversal on the 1-hour chart , with price testing a key resistance zone near cumulative sell liquidation, converging with a potential entry area that could trigger downside momentum if sellers defend against further upside. This setup suggests a pullback opportunity amid recent consolidation, targeting lower support levels with near 1:3 risk-reward .🔥
Entry between 3020–3040 for a short position. Target at 2840 . Set a stop loss at a close above 3090 📊, yielding a risk-reward ratio of near 1:3 . Monitor for confirmation via a bearish candle close below entry with rising volume, leveraging Ethereum's volatility near highs.🌟
📝 Trade Setup
🎯 Entry (Short):
3020 – 3040
🎯 Target:
• 2840
❌ Stop Loss:
• Close above 3090
⚖️ Risk-to-Reward:
• ~ 1:3
💡 Your view?
Does ETH reject 3040 and slide toward 2840 — or will buyers absorb supply and push higher?
👇 Share your thoughts below 👇

ETHUSDT Price at Strong Demand Zone – Watching for Bullish Zone📊 ETHUSDT – 30M
Price Reacting at Key Demand Zone | Potential Bullish Reversal Setup
This ETHUSDT 30-minute chart shows price entering a well-defined bullish reversal (demand) zone after a sustained bearish move. The market appears to be transitioning from distribution into accumulation, with clear signs of buyer interest emerging near the lows.
🔍 Market Structure Breakdown & Technical Analysis
ETH previously formed a series of lower highs and lower lows, confirming a short-term bearish structure.
The recent sell-off drove price into a historically significant demand area, where aggressive buying previously occurred.
The current move down lacks strong follow-through, suggesting bearish momentum is weakening.
Price is now consolidating, indicating absorption of sell orders by larger participants.
🟩 Reversal Zone & Volume Burst
The highlighted green area marks a high-probability demand zone, supported by:
Strong bullish displacement in the past
High-volume reaction (Volume Burst)
Long downside wicks showing liquidity sweep and rejection
This behavior often precedes short-term trend reversals or deep pullbacks.
📌 What Confirmation Looks Like
No blind entries — waiting for price confirmation inside the zone.
Bullish confirmation may include:
Bullish engulfing candle on 30M or lower TF
Strong rejection with long lower wicks
Break in internal market structure (higher low)
Increasing volume on bullish candles
Once confirmed, the probability favors a relief rally.
🎯 Trade Expectations (If Confirmed)
Bias: Bullish reaction / intraday reversal
Entry: After confirmation inside the demand zone
Invalidation: Clean break and close below the zone
Targets:
First target: Internal resistance / range high
Second target: Previous lower high
Extended target: Liquidity above recent highs
Risk-to-reward remains attractive due to tight invalidation and clear structure.
🧠 Market Psychology Insight
This setup reflects smart money accumulation, where liquidity is taken below recent lows before price expansion. Retail panic selling often fuels these reversals — patience and confirmation separate professionals from gamblers.

$ETH/USDT ANALYSISOn the 1-hour ETH/USDT chart, price is clearly moving inside a falling channel, which shows that the short-term trend is bearish and sellers are in control. The last strong impulse was a sharp drop from the upper side of the channel near the trendline resistance, after which price continued to make lower highs and lower lows, confirming a bearish market structure shift. The green moving average above price is acting as dynamic resistance, and every time price moves toward it, selling pressure increases. The current price is sitting near the lower boundary of the channel, which is a short-term demand area, but there is no strong bullish reaction yet, so flow remains weak. From a price action view, the main points of interest are the supply zone near the channel top where the last rejection happened, and the demand zone near the channel bottom where liquidity has already been taken. If price stays below the channel resistance and below the moving average, the direction remains bearish and the market is likely in continuation mode. If price breaks below the current support cleanly, it signals further downside continuation. Only if price reclaims the channel resistance and holds above it would that invalidate the current bearish structure, but until then, the overall tone on the 1-hour chart remains weak and controlled by sellers.

Will Ethereum’s Market Flow Signal a New Bullish Phase?🎯 ETH/USD: The "Thief Strategy" Blueprint | Layer Your Way to Victory! 💰
📊 Market Overview
Asset: ETH/USD (Ethereum vs US Dollar)
Market: Crypto
Trade Type: Swing Trade
Bias: Bullish (Post-Breakout Setup)
🎭 The Thief's Master Plan
Ladies and gentlemen, gather 'round! 🎩 We're not just trading here—we're executing the legendary "Thief Strategy" where we sneak into multiple price levels like a professional heist crew. No single entry point for us, oh no. We layer up, diversify risk, and wait for the vault to open! 💎
🚀 Entry Strategy: The Layering Technique
Primary Entry Zone: Any price level AFTER a confirmed breakout above $4,200 ✅
The Thief's Layering Method (Multiple Limit Orders):
🥇 Layer 1: $3,900
🥈 Layer 2: $4,000
🥉 Layer 3: $4,100
🏆 Layer 4: $4,200
Pro Tip: Feel free to add more layers based on your capital allocation and risk appetite. The more layers, the smoother your average entry price! Think of it as building a ladder to success.
🛑 Stop Loss: Protect Your Treasure
Thief's Stop Loss: $3,700 🚨
⚠️ Important Disclaimer:
Dear Ladies & Gentlemen (Thief OG's), I'm NOT recommending you blindly follow my stop loss. This is MY risk tolerance. You need to assess YOUR own risk management strategy. Set your stop loss according to your capital size, risk appetite, and sleep-at-night comfort level. Remember: Your money, your rules! 💼
🎯 Take Profit Target: Know When to Exit the Heist
Primary Target: $4,600 🎰
Why This Level?
📈 Moving Average acting as a strong resistance zone (think of it as the police barricade!)
🔴 Overbought conditions on technical indicators
⚠️ Bull trap zone — smart money might be waiting to distribute here
Exit Strategy:
When you see the moving average resistance + overbought signals flashing, it's time to take your profits and vanish into the night! 🌙
⚠️ Important Disclaimer:
Dear Ladies & Gentlemen (Thief OG's), I'm NOT recommending you blindly follow my take profit level. This is MY analysis. Scale out profits at levels that make sense for YOUR trading plan. Partial profits, trailing stops, whatever works for YOU. Make money, then TAKE money—at your own discretion! 💵
🔗 Related Pairs to Watch
Keep an eye on these correlated assets to confirm the broader market direction:
BITSTAMP: BITSTAMP:BTCUSD — The king of crypto. When Bitcoin moves, ETH usually follows. Watch for BTC breakouts above resistance.
BINANCE: BINANCE:ETHBTC — Shows ETH's relative strength against Bitcoin. Rising = ETH outperformance.
TVC: TVC:DXY (US Dollar Index) — Inverse correlation. Weaker dollar = stronger crypto typically.
Total Crypto Market Cap — Confirms if capital is flowing INTO or OUT OF the crypto space.
COINBASE: COINBASE:SOLUSD , COINBASE: COINBASE:ADAUSD — Other major altcoins. If they're pumping too, it confirms alt season momentum.
Key Correlation Point: If Bitcoin is breaking resistance zones and the Dollar Index (DXY) is weakening, our ETH setup gets significantly stronger! 📊✨
🧠 Technical Analysis Breakdown
What We're Watching:
✅ Breakout Confirmation: Price must close above $4,200 with volume
✅ Support Levels: $3,900-$4,100 range acts as accumulation zone
✅ Resistance Zone: $4,600 where moving averages + overbought conditions converge
✅ Risk-Reward Ratio: Solid setup with layered entries minimizing average cost basis
The Thief Strategy Philosophy:
Instead of gambling on ONE entry point, we spread our risk across multiple price levels. This way, we're dollar-cost-averaging into the position BEFORE the breakout confirmation, positioning ourselves ahead of the crowd! 🎯
🎬 Final Words from the Thief
Remember, OG's: The best trades are the ones where you're positioned BEFORE the crowd rushes in. Layer your entries, manage your risk like a professional, and know when to take your profits and disappear! 👻
Stay disciplined, stay profitable, and let's make this heist a success! 🏆
✨ If you find value in my analysis, a 👍 and 🚀 boost is much appreciated — it helps me share more setups with the community!
#ETHUSD #Ethereum #CryptoTrading #SwingTrade #ThiefStrategy #LayeringStrategy #CryptoAnalysis #TechnicalAnalysis #TradingView #CryptoSetup #AltcoinSeason #ETHBreakout #RiskManagement #TradingStrategy #CryptoIdeas

Can Ethereum’s Capital Flow Blueprint Target 4600 Next?🎯 ETH/USD "The Liquidity Thief" Strategy 💰
Weighted MA Pullback + Manipulation Grab Blueprint
📊 TRADE SETUP OVERVIEW
Asset: ETH/USD (Ethereum vs USD) | Timeframe: Swing Trade
Market Structure: Bullish Confirmation with WMA Pullback Recovery
Strategy Type: Multi-Layer Accumulation (Thief-Style Entry Method)
🎪 THE GAMEPLAN
Bias: 🟢 BULLISH — Confirmed via:
Weighted Moving Average (WMA) acting as dynamic support
Liquidity pool identification on pullback zones
Institutional accumulation patterns detected
This setup thrives on pullback retracements where smart money accumulates before the next leg up. We're essentially "stealing" liquidity at discount prices during these inefficiency windows.
🚀 MULTI-LAYER ENTRY STRATEGY (The Thief Approach)
Instead of FOMO market orders, we deploy calculated limit order layers at strategic support zones:
Entry Levels (Layer-by-Layer Accumulation):
Layer 1: $3,700 USD
Layer 2: $3,800 USD
Layer 3: $3,900 USD
(Pro Tip: Scale these layers based on your risk tolerance and account size. Tighter layers = more fills; wider layers = better average price)
Position Building: Fill partial positions at each layer, building your total exposure gradually. This reduces average entry cost and maximizes probability of initial profit.
🛑 STOP LOSS (Risk Management)
Hard Stop: $3,500 USD
⚠️ Important Disclaimer: This is YOUR trading decision. No strategy guarantees profits. Position sizing and risk management are YOUR responsibility. Never risk capital you can't afford to lose.
🎯 TARGET & EXIT STRATEGY
Primary Target: $4,600 USD
Exit Rationale:
Strong resistance zone confluence
RSI/Stochastic overbought divergence
Liquidity trap zone (potential reversal catalyst)
💡 Golden Rule: Lock in profits at $4,600 or take partial profits at resistance. Never hold through key resistance on swing trades—greed kills thief traders.
⚠️ Disclosure: Risk management and profit targets are trader-dependent. Adjust based on your strategy framework, market conditions, and account allocation.
📈 CORRELATED PAIRS TO WATCH
Monitor these assets for confluence signals and capital flow indicators:
BITSTAMP:BTCUSD (✅ High Positive Correlation) — Bitcoin sets market sentiment; ETH typically follows in lockstep. When BTC rallies, altcoins like ETH amplify the move upward.
BINANCE:ETHBTC (⚖️ Relative Strength) — ETH strength against BTC equals altseason confirmation. Rising ETHBTC ratio means Ethereum is outperforming Bitcoin—bullish for our setup.
$SPY/ IG:NASDAQ (📊 Risk Appetite) — Traditional equity weakness creates crypto pullback risk. If stocks dump, crypto usually follows. Monitor US market opens for confirmation signals.
TVC:DXY (Dollar Index) (⚖️ Inverse Correlation) — Strong dollar = crypto headwind; weak dollar = tailwind for ETH. A declining DXY supports crypto rally scenarios.
COINBASE:USDTUSD (🔒 Stablecoin Flow) — USDT accumulation signals capital waiting for entry. Rising USDT on exchanges = dry powder ready to deploy into altcoins like ETH.
Capital Flow Blueprint: When BTC holds above support AND USDT shows inflow, altcoins like ETH enter "hunter mode."
🔑 KEY TRADING PRINCIPLES (Thief OG Edition)
✨ Patience — Wait for pullback confirmation before layering in
✨ Position Sizing — Risk only 1-2% per trade; 3% absolute maximum
✨ Confluence — Entry + Support + Volume + Correlation = Green Light
✨ Discipline — Exit at target or stop loss; no emotional HODL mode
✨ Adaptation — Markets evolve; update bias if structure breaks
If you find value in my analysis, a 👍 and 🚀 boost is much appreciated — it helps me share more setups with the community!
#ETH #ETHUSD #Ethereum #CryptoTrading #TechnicalAnalysis #SwingTrading #CryptoDCA #TradingStrategy #LayerEntry #LiquidityZones #AltSeason #CryptoAnalysis #TradeSetup #RiskManagement #Thief #CommunityDriven

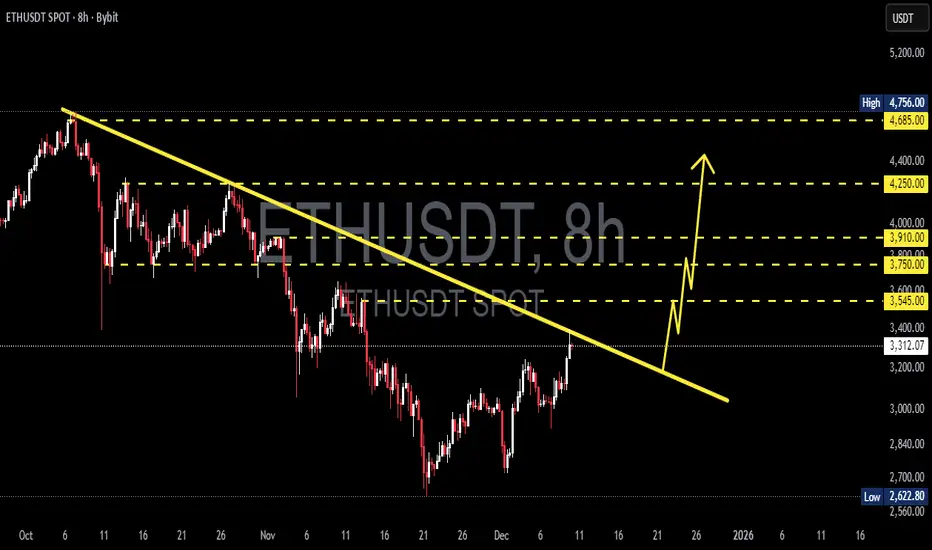
ETH/USDT — This Trendline Will Decide the Next Major MoveETH is now sitting at the most crucial level of Q4 —
directly attacking the descending trendline that has rejected every rally since early October.
This is not just a trendline.
This is the wall separating ETH from a full momentum breakout.
---
🔍 What’s Really Happening on the Chart?
ETH has formed a sequence of higher lows, showing growing buyer strength.
The descending trendline (yellow) remains the final defense for the bears.
Several major resistance zones above (3,545 → 3,750 → 3,910 → 4,250 → 4,685) are aligned perfectly if a breakout confirms.
Price is now sitting at a decision zone, and markets often expand aggressively after setups like this.
In simple terms:
ETH is preparing for a big move — only the direction is yet to be chosen.
---
🔥 Bullish Scenario — A Breakout That Changes Everything
If ETH manages to:
1. Close an 8H candle above the trendline, and
2. Show a clean retest afterward,
then a bullish expansion could unfold toward:
🎯 3,545 — first breakout confirmation
🎯 3,750 — structural shift
🎯 3,910 — major resistance
🎯 4,250 — expansion zone
🎯 4,685 – 4,756 — full breakout target
Trendline breaks like this often mark the start of large impulsive rallies, especially with rising volume.
---
⚠️ Bearish Scenario — A Sharp Rejection
If the trendline rejects price and the candle closes back below it:
ETH forms another lower high,
Bearish structure resumes,
Downside targets come into play:
🔻 3,000 – 2,840
🔻 2,700
🔻 2,622 (major support)
A rejection here frequently creates strong downward continuation, as this trendline is widely watched.
---
🎯 Key Takeaway
This is the most important ETH setup of the past several weeks.
Breakout → bullish momentum wave.
Rejection → trend continuation downward.
This level will likely dictate ETH’s direction going into early 2026.
For aggressive traders, this is an opportunity.
For conservative traders, this is a wait-for-confirmation zone.
#Ethereum #ETH #ETHUSDT #CryptoAnalysis #PriceAction #Breakout #Trendline #CryptoMarkets #Altcoins