EU50| Bearish Continuation Correction + CAB Entry :)We've had a short bias for a bit on all indices, this one is very clean and it looks like we finally broke out of the continuation correction to the downside. Now all we want to see is a LTF correction after the breakout which will be our entry to carry the momentum lower.
Eu50

EU50 LONG possibilityHello Traders,
Wait for the retest of the counter-trendline and confirmation of the indicators.
Than we have an entry.
Wishing you a great week of trading!

Pomysł na EU 50Tak to widzę. Ciekawy jestem zdania innych.
To nie jest rekomendacja, a gra pod to, co wyrysowałem wiąże się z ryzykiem!

US2000 Strong Buy US2000 Russell 2000 Strong buy, look for new high.
Technical indicator analysis & chart analysis.

Did you miss trades?⚡️Get your wallets ready, wolves🔥
There is one more idea for you.
There is a Flag formation on EU50 financial instrument.
The price bounced from support and resistance zones.
One more possible touch of support zone is expected, but watch it careful because impulse may happen much sooner.
So follow the chart and look for the breakout carefully.
_____________________________________________________
If you enjoy my FREE Technical Analysis , support the idea with a big LIKE👍 and don't forget to SUBSCRIBE my channel, you won't miss anything!
Feel free to leave comments✉️
And always remember: "we don't predict, we react".


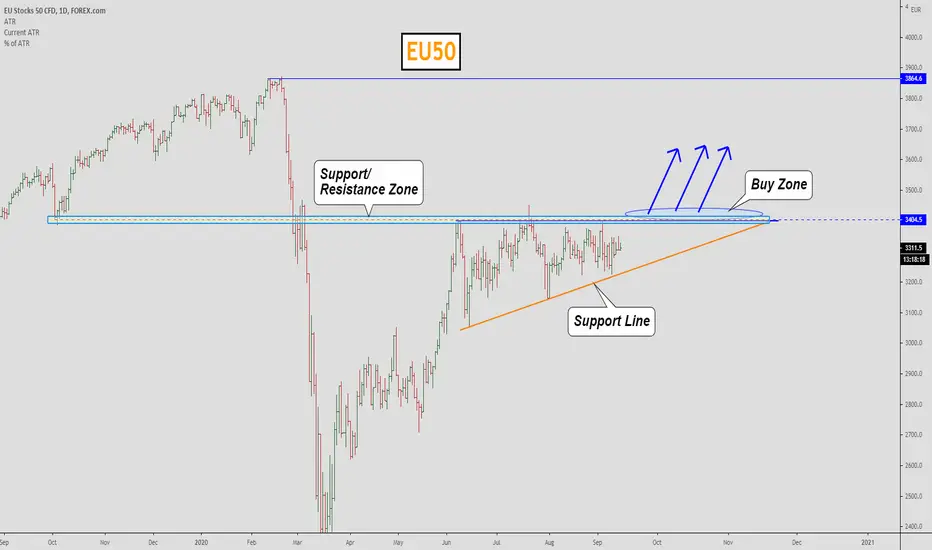
EU50, Waiting for the breakout!I will open Buy if the price will cross the Support/Resistance Zone and fix above it.
A huge accumulation below can give a strong impulse.
Push like if you will trade it also!
Write your comments and questions here!
Thanks for your support!
EU50 bearish countWe had a 5 way impulsive down(1 or A) and now we are on the correction wave 2 (or B) , we are at a fibi cluster so I am expecting the market to crash
wait for the confirmation level to get hit before selling


AIR Long IdeaLogic: economic recovery/bounce back idea.
Entry: €64.50 or ideally at yearly S3 support, €55-€56 area.
Stop: €56 or < €48 in second case.
Risk: -13.18% or -14.29%
Target: initially €78.13, longer term mid €90's
Gain: +21.13% or +39.52%
Note: high risk/reward longer term speculative idea. AIR remains in downtrend.


ENEL Long IdeaLogic: close above yearly pivot, in confirmed uptrend & > 200D EMA.
Entry: €6.70
Stop: €6.20
Risk: -7.46%
Target: €7.70*
Gain: +14.93
Note: *initial target €7.27, possible gap close in €7.40-€7.80 area.

"EuroStoxx: at an important Resistance Zone" by ThinkingAntsOkDaily Chart Explanation:
- Price bounced from the Support Zone and went towards the Resistance Zone where it is now.
- Bearish Divergence on MACD.
- If price starts its down move from here, it has potential to go towards the Support Zone one more time.
- We are looking for sell setups on lower timefremes.
Weekly Vision:
Updates coming soon!

"EuroStoxx moved exactly as expected" by ThinkingAntsOk4H Chart Explanation: "What happened?"
- Price broke the Descending Trendline.
- It started its up move after bouncing on the Support Zone .
- There was a Bearish Divergence on MACD .
- Price reached our target on the Resistance Zone first. After that, it faced a correction towards the Support Zone .
Now, we are waiting to see a new clear setup. Updates coming soon!
Weekly Vision:
Daily Vision:

"Eurostoxx: moving as expected" by ThinkingAntsOk4 Hour Chart Explanation:
- Price broke the Descending Trendline.
- It started its up move after bouncing on the Support Zone.
- Bearish Divergence on MACD.
- Price has potential to reach our target on the Resistance Zone. After that, it should face a correction towards the Support Zone.
Weekly Vision:
Daily Vision:

DAX & EU50 indexes I will open buy near mirror levels because
- Price broke up mirror levels and Downward trend
- Potential profit in 5 times bigger than a risk

Flag at EUROSTOXX 50 ?Flag at eurostoxx 50? maybe good money in it., im short in usoil as well, it can drive the markets down a bit more.

"Top and Bottom Analysis" EUROSTOXX (EU50EUR) by ThinkingAntsOk4H CHART EXPLANATION:
Main Items we observe on the Chart:
- Price broke the Ascending Channel and, then, bounced on the Resistance Zone.
- If price breaks the Ascending Trendline at 3381, it has potential to move down towards the Support Zone at 3300.
We are looking for Sell Setups on lower timeframes.
MULTI TIMEFRAME VISION:
- Weekly
- Daily


EU50 approaching resistance, potential drop! EU50 is approaching our first resistance at 3272 (50% fibonacci retracement, 100% fibonacci extension, horizontal overlap resistance) and a strong drop might occur pushing price down to our major support at 3128 (38.2% fibonacci retracement).
Stochastic (55, 5, 3) is also approaching resistance and we might see a corresponding drop in price should it react off this level.
Trading CFDs on margin carries high risk.
Losses can exceed the initial investment so please ensure you fully understand the risks.

EU50 approaching resistance, potential drop! EU50 is approaching our first resistance at 3167 (ascending overlap resistance, horizontal swing high resistance, 76.4% fibonacci retracement, 61.8% fibonacci extension) and a strong drop might occur below this level pushing price down to our major support at 3088 (horizontal overlap resistance, 161% fibonacci exteension).
Stochastic (55,5,3) is also approaching resistance and we might see a corresponding drop in price should it react off this level.
Trading CFDs on margin carries high risk.
Losses can exceed the initial investment so please ensure you fully understand the risks

EU50 approaching resistance, potential drop! EU50 is approaching our first resistance at 3087 (50% fibonacci retracement, 100% fibonacci extension, horizontal swing high resistance) and a strong drop might occur below this level pushing price down to our major support at 3016 (38.2% fibonacci retracement, horizontal overlap resistance).
Stochastic (34,5,3) is also approaching resistance and we might see a corresponding drop in price should it react off this level.
Trading CFDs on margin carries high risk.
Losses can exceed the initial investment so please ensure you fully understand the risks
