EURUSD H4 | Bearish ReversalMomentum: Bearish
The price is reacting to the sell entry, which has been identified as pullback resistance.
Sell entry: 1.1599
Pullback resistance
Stop oss: 1.1648
Swing high resistance
Take profit: 1.1534
Overlap support
61.8% Fibonacc retracement
High Risk Investment Warning
Stratos Markets Limited (tradu.com ), Stratos Europe Ltd (tradu.com ):
CFDs are complex instruments and come with a high risk of losing money rapidly due to leverage. 70% of retail investor accounts lose money when trading CFDs with this provider. You should consider whether you understand how CFDs work and whether you can afford to take the high risk of losing your money.
Stratos Global LLC (tradu.com ): Losses can exceed deposits.
Please be advised that the information presented on TradingView is provided to Tradu (‘Company’, ‘we’) by a third-party provider (‘TFA Global Pte Ltd’). Please be reminded that you are solely responsible for the trading decisions on your account. Any information and/or content is intended entirely for research, educational and informational purposes only and does not constitute investment or consultation advice or investment strategy. The information is not tailored to the investment needs of any specific person and therefore does not involve a consideration of any of the investment objectives, financial situation or needs of any viewer that may receive it. Past performance is not a reliable indicator of future results. Actual results may differ materially from those anticipated in forward-looking or past performance statements. We assume no liability as to the accuracy or completeness of any of the information and/or content provided herein and the Company cannot be held responsible for any omission, mistake nor for any loss or damage including without limitation to any loss of profit which may arise from reliance on any information supplied by TFA Global Pte Ltd.
EUR

EURUSD H1 | Bullish Bounce OffMomentum: Bullish
The price is falling towards the buy entry which aligns with the 50% Fibonacci retracement.
Buy entry: 1.1551
Strong overlap support
50% Fibonacci retracement
Stop loss: 1.1527
Pullback support
78.6% Fibonacci retracement
Take profit: 1.1605
Strong overlap resistance
High Risk Investment Warning
Stratos Markets Limited (tradu.com ), Stratos Europe Ltd (tradu.com ):
CFDs are complex instruments and come with a high risk of losing money rapidly due to leverage. 70% of retail investor accounts lose money when trading CFDs with this provider. You should consider whether you understand how CFDs work and whether you can afford to take the high risk of losing your money.
Stratos Global LLC (tradu.com ): Losses can exceed deposits.
Please be advised that the information presented on TradingView is provided to Tradu (‘Company’, ‘we’) by a third-party provider (‘TFA Global Pte Ltd’). Please be reminded that you are solely responsible for the trading decisions on your account. Any information and/or content is intended entirely for research, educational and informational purposes only and does not constitute investment or consultation advice or investment strategy. The information is not tailored to the investment needs of any specific person and therefore does not involve a consideration of any of the investment objectives, financial situation or needs of any viewer that may receive it. Past performance is not a reliable indicator of future results. Actual results may differ materially from those anticipated in forward-looking or past performance statements. We assume no liability as to the accuracy or completeness of any of the information and/or content provided herein and the Company cannot be held responsible for any omission, mistake nor for any loss or damage including without limitation to any loss of profit which may arise from reliance on any information supplied by TFA Global Pte Ltd.

Potential bullish reversal?EUR/GBP is reacting off the support level, which is a pullback support slightly above the 61.8% Fibonacci retracement, and could bounce from this level to our take profit.
Entry: 0.8744
Why we like it:
There is a pullback support level that is slightly above the 61.8% Fibonacci retracement.
Stop loss: 0.8706
Why we lik eit:
There is a pullback support that aligns with the 78.6% Fibonacci retracement.
Take profit: 0.8800
Why we like it:
There is an overlap resistance that aligns with the 50% Fibonacci retracement.
Enjoying your TradingView experience? Review us!
Please be advised that the information presented on TradingView is provided to Vantage (‘Vantage Global Limited’, ‘we’) by a third-party provider (‘Everest Fortune Group’). Please be reminded that you are solely responsible for the trading decisions on your account. There is a very high degree of risk involved in trading. Any information and/or content is intended entirely for research, educational and informational purposes only and does not constitute investment or consultation advice or investment strategy. The information is not tailored to the investment needs of any specific person and therefore does not involve a consideration of any of the investment objectives, financial situation or needs of any viewer that may receive it. Kindly also note that past performance is not a reliable indicator of future results. Actual results may differ materially from those anticipated in forward-looking or past performance statements. We assume no liability as to the accuracy or completeness of any of the information and/or content provided herein and the Company cannot be held responsible for any omission, mistake nor for any loss or damage including without limitation to any loss of profit which may arise from reliance on any information supplied by Everest Fortune Group.

EUR/GBP - Bearish Flag (28.11.2025)📝 Technical Description OANDA:EURGBP
EUR/GBP is forming a clear Bearish Flag Pattern, showing consolidation after a strong downside impulse. Price is also respecting cloud resistance + channel resistance, indicating that bearish pressure is still dominant.
The structure favors a breakdown continuation toward the next support levels if bearish momentum picks up.
📊 Trading Plan (My View)🔻 Bearish Scenario (Main Setup)
Look for bearish confirmation after price breaks below the minor trendline.
Expect continuation toward the lower support zones.
🎯 Targets
1st Support: 0.87274
2nd Support: 0.87132
⚠️ Today’s Fundamental Updates – 28 Nov 2025
1️⃣ UK Budget Boosts GBP
The UK government reported better-than-expected Budget surplus, giving more flexibility to manage expenses and debts. ➡ Strengthens GBP.
#eurgbp #forex #forexanalysis #bearishflag #priceaction #chartpattern #technicalanalysis
#fxsignals #tradingview #elliottwave #cloudtrading #fundamentalanalysis #gbp #eur
📌 Summary
Bearish technical structure + GBP-supportive fundamentals = High probability for a downside continuation.
⚠️ Disclaimer
This chart is for educational purposes only.
Not financial advice. Always trade with proper risk management.
❤️ Support the Work
If you liked this analysis — Please LIKE 👍 & COMMENT 💬
Your support motivates more daily, high-quality chart breakdowns!
Disclosure: I am part of the Headway Influencer Program for my chart analysis.

Bearish reversal for the Fiber?The price has rejected off the pivot and could drop to the 1st support which is a pullback support.
Pivot: 1.1597
1st Support: 1.1512
1st Resistance: 1.1669
Disclaimer:
The opinions given above constitute general market commentary and do not constitute the opinion or advice of IC Markets or any form of personal or investment advice.
Any opinions, news, research, analyses, prices, other information, or links to third-party sites contained on this website are provided on an "as-is" basis, are intended to be informative only, and are not advice, a recommendation, research, a record of our trading prices, an offer of, or solicitation for, a transaction in any financial instrument and thus should not be treated as such. The information provided does not involve any specific investment objectives, financial situation, or needs of any specific person who may receive it. Please be aware that past performance is not a reliable indicator of future performance and/or results. Past performance or forward-looking scenarios based upon the reasonable beliefs of the third-party provider are not a guarantee of future performance. Actual results may differ materially from those anticipated in forward-looking or past performance statements. IC Markets makes no representation or warranty and assumes no liability as to the accuracy or completeness of the information provided, nor any loss arising from any investment based on a recommendation, forecast, or any information supplied by any third party.

Market Mispricing? EURUSD Ready to Surge on FED PivotHey Traders,
In today’s trading session we are monitoring EURUSD for a buying opportunity around the 1.15300 zone. The pair has been trading in a clear uptrend, and is now entering a healthy correction phase, approaching a key trend support / S&R confluence at 1.15300.
Fundamentals continue to lean strongly in favor of EURUSD bulls:
Markets now expect the FED to cut rates in December, a clear bearish driver for the USD as easing expectations gain traction.
Rumors yesterday suggested that Kevin Hassett is now the top contender for the next FED Chair.
Hassett is widely viewed as the most dovish possible pick, which only deepens downside pressure on the Dollar.
With USD sentiment turning increasingly soft and price nearing a major technical support, the 1.15300 area becomes a highly strategic zone to look for bullish continuation.
Trade safe,
Joe.

Swing high resistance ahead?EUR/USD is rising towards the resistance level which is a swing high resistance and could reverse from this level and drop to our take profit.
Entry: 1.1649
Why we like it:
There is a swing high resistance that aligns with the 100$ Fibonacci projection.
Stop loss: 1.1699
Why we like it:
There is a resistance level at the 127.2% Fibonacci extension.
Take profit: 1.1554
Why we like it:
There is a pullback support level.
Enjoying your TradingView experience? Review us!
Please be advised that the information presented on TradingView is provided to Vantage (‘Vantage Global Limited’, ‘we’) by a third-party provider (‘Everest Fortune Group’). Please be reminded that you are solely responsible for the trading decisions on your account. There is a very high degree of risk involved in trading. Any information and/or content is intended entirely for research, educational and informational purposes only and does not constitute investment or consultation advice or investment strategy. The information is not tailored to the investment needs of any specific person and therefore does not involve a consideration of any of the investment objectives, financial situation or needs of any viewer that may receive it. Kindly also note that past performance is not a reliable indicator of future results. Actual results may differ materially from those anticipated in forward-looking or past performance statements. We assume no liability as to the accuracy or completeness of any of the information and/or content provided herein and the Company cannot be held responsible for any omission, mistake nor for any loss or damage including without limitation to any loss of profit which may arise from reliance on any information supplied by Everest Fortune Group.

EURUSD: double Scenario
Hello Traders,
this is the long-term channel!
We are truly in the way of more bearish days!
However, in the more natural timeframe we see a possible Head and shoulders!
I'm not a pattern trader! but sellers were not able to goes further than the HEAD!
So???
They are not strong enough! new buyers are in! may be a peace in Ukraine could alter it!
but I'm still more bearish for the term of my trade length! Although I aim to long after confirming the H&S and also breaking the latest strong level and breaking the bearish channel up!!

Bullish bounce setup?EUR/GBP has bounced off the pivot and could potentially rise to the 1st resistance.
Pivot: 0.8763
1st Support: 0.8743
1st Resistance: 0.8825
Disclaimer:
The opinions given above constitute general market commentary and do not constitute the opinion or advice of IC Markets or any form of personal or investment advice.
Any opinions, news, research, analyses, prices, other information, or links to third-party sites contained on this website are provided on an "as-is" basis, are intended to be informative only, and are not advice, a recommendation, research, a record of our trading prices, an offer of, or solicitation for, a transaction in any financial instrument and thus should not be treated as such. The information provided does not involve any specific investment objectives, financial situation, or needs of any specific person who may receive it. Please be aware that past performance is not a reliable indicator of future performance and/or results. Past performance or forward-looking scenarios based upon the reasonable beliefs of the third-party provider are not a guarantee of future performance. Actual results may differ materially from those anticipated in forward-looking or past performance statements. IC Markets makes no representation or warranty and assumes no liability as to the accuracy or completeness of the information provided, nor any loss arising from any investment based on a recommendation, forecast, or any information supplied by any third party.

Bearish reversal off key resistance?EUR/CAD has rejected off the pivot and could reverse to the 1st support, which acts as an overlap support that is slightly below the 61.8% Fibonacci retracement.
Pivot: 1.63347
1st Support: 1.62212
1st Resistance: 1.63918
Disclaimer:
The opinions given above constitute general market commentary and do not constitute the opinion or advice of IC Markets or any form of personal or investment advice.
Any opinions, news, research, analyses, prices, other information, or links to third-party sites contained on this website are provided on an "as-is" basis, are intended to be informative only, and are not advice, a recommendation, research, a record of our trading prices, an offer of, or solicitation for, a transaction in any financial instrument and thus should not be treated as such. The information provided does not involve any specific investment objectives, financial situation, or needs of any specific person who may receive it. Please be aware that past performance is not a reliable indicator of future performance and/or results. Past performance or forward-looking scenarios based upon the reasonable beliefs of the third-party provider are not a guarantee of future performance. Actual results may differ materially from those anticipated in forward-looking or past performance statements. IC Markets makes no representation or warranty and assumes no liability as to the accuracy or completeness of the information provided, nor any loss arising from any investment based on a recommendation, forecast, or any information supplied by any third party.

Bearish momentum to extend?EUR/NZD could make a short-term pullback to the pivot and could reverse to the 1st support.
Pivot: 2.04533
1st Support: 2.02365
1st Resistance: 2.06417
Disclaimer:
The opinions given above constitute general market commentary and do not constitute the opinion or advice of IC Markets or any form of personal or investment advice.
Any opinions, news, research, analyses, prices, other information, or links to third-party sites contained on this website are provided on an "as-is" basis, are intended to be informative only, and are not advice, a recommendation, research, a record of our trading prices, an offer of, or solicitation for, a transaction in any financial instrument and thus should not be treated as such. The information provided does not involve any specific investment objectives, financial situation, or needs of any specific person who may receive it. Please be aware that past performance is not a reliable indicator of future performance and/or results. Past performance or forward-looking scenarios based upon the reasonable beliefs of the third-party provider are not a guarantee of future performance. Actual results may differ materially from those anticipated in forward-looking or past performance statements. IC Markets makes no representation or warranty and assumes no liability as to the accuracy or completeness of the information provided, nor any loss arising from any investment based on a recommendation, forecast, or any information supplied by any third party.

EURUSD H4 | Bearish Drop OffMomentum: Bearish
The price has rejected off the sell entry, which is also positioned below the Ichimoku Cloud.
Sell Entry: 1.1542
Pullback resistance
Slightly below the 38.2% Fibonacci retracement
Stop Loss: 1.1569
Pullback resistance
Near the 50% Fibonacci retracement
Take Profit: 1.1472
Swing-low support
Slightly above the 161.8% Fibonacci extension
High Risk Investment Warning
Stratos Markets Limited (tradu.com ), Stratos Europe Ltd (tradu.com ):
CFDs are complex instruments and come with a high risk of losing money rapidly due to leverage. 70% of retail investor accounts lose money when trading CFDs with this provider. You should consider whether you understand how CFDs work and whether you can afford to take the high risk of losing your money.
Stratos Global LLC (tradu.com ): Losses can exceed deposits.
Please be advised that the information presented on TradingView is provided to Tradu (‘Company’, ‘we’) by a third-party provider (‘TFA Global Pte Ltd’). Please be reminded that you are solely responsible for the trading decisions on your account. Any information and/or content is intended entirely for research, educational and informational purposes only and does not constitute investment or consultation advice or investment strategy. The information is not tailored to the investment needs of any specific person and therefore does not involve a consideration of any of the investment objectives, financial situation or needs of any viewer that may receive it. Past performance is not a reliable indicator of future results. Actual results may differ materially from those anticipated in forward-looking or past performance statements. We assume no liability as to the accuracy or completeness of any of the information and/or content provided herein and the Company cannot be held responsible for any omission, mistake nor for any loss or damage including without limitation to any loss of profit which may arise from reliance on any information supplied by TFA Global Pte Ltd.

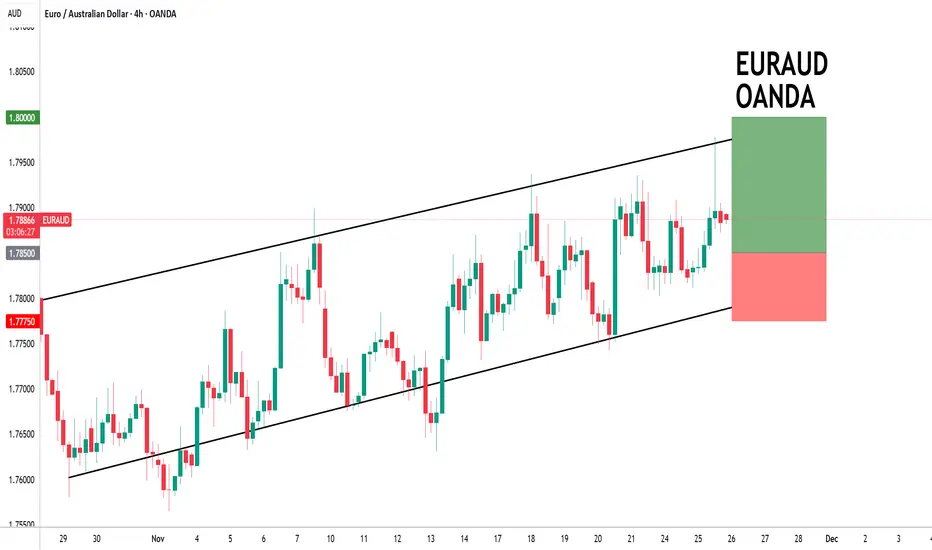
EURAUD to continue in the upward channel?EURAUD - 24h expiry
Indecisive price action has resulted in sideways congestion on the intraday chart.
Pivot support is at 1.7700.
Risk/Reward would be poor to call a buy from current levels.
A move through 1.7900 will confirm the bullish momentum.
The measured move target is 1.8025.
Our profit targets will be 1.8000 and 1.8025
Resistance: 1.7900 / 1.7950 / 1.8000
Support: 1.7850 / 1.7800 / 1.7775
Risk Disclaimer
The trade ideas beyond this page are for informational purposes only and do not constitute investment advice or a solicitation to trade. This information is provided by Signal Centre, a third-party unaffiliated with OANDA, and is intended for general circulation only. OANDA does not guarantee the accuracy of this information and assumes no responsibilities for the information provided by the third party. The information does not take into account the specific investment objectives, financial situation, or particular needs of any particular person. You should take into account your specific investment objectives, financial situation, and particular needs before making a commitment to trade, including seeking, under a separate engagement, as you deem fit.
You accept that you assume all risks in independently viewing the contents and selecting a chosen strategy.
Where the research is distributed in Singapore to a person who is not an Accredited Investor, Expert Investor or an Institutional Investor, Oanda Asia Pacific Pte Ltd (“OAP“) accepts legal responsibility for the contents of the report to such persons only to the extent required by law. Singapore customers should contact OAP at 6579 8289 for matters arising from, or in connection with, the information/research distributed.
Could we see a bearish reversal from here?EUR/JPY is rising towards the resistance level which is a pullback resistance and could reverse from this level to our take profit.
Entry: 181.17
Why we like it:
There is a pullback resistance level.
Stop loss: 182.03
Why we like it:
There is a swing high resistance level
Take profit: 178.84
Why we like it:
There is a pullback support level that aligns with the 50% Fibonacci retracement.
Enjoying your TradingView experience? Review us!
Please be advised that the information presented on TradingView is provided to Vantage (‘Vantage Global Limited’, ‘we’) by a third-party provider (‘Everest Fortune Group’). Please be reminded that you are solely responsible for the trading decisions on your account. There is a very high degree of risk involved in trading. Any information and/or content is intended entirely for research, educational and informational purposes only and does not constitute investment or consultation advice or investment strategy. The information is not tailored to the investment needs of any specific person and therefore does not involve a consideration of any of the investment objectives, financial situation or needs of any viewer that may receive it. Kindly also note that past performance is not a reliable indicator of future results. Actual results may differ materially from those anticipated in forward-looking or past performance statements. We assume no liability as to the accuracy or completeness of any of the information and/or content provided herein and the Company cannot be held responsible for any omission, mistake nor for any loss or damage including without limitation to any loss of profit which may arise from reliance on any information supplied by Everest Fortune Group.

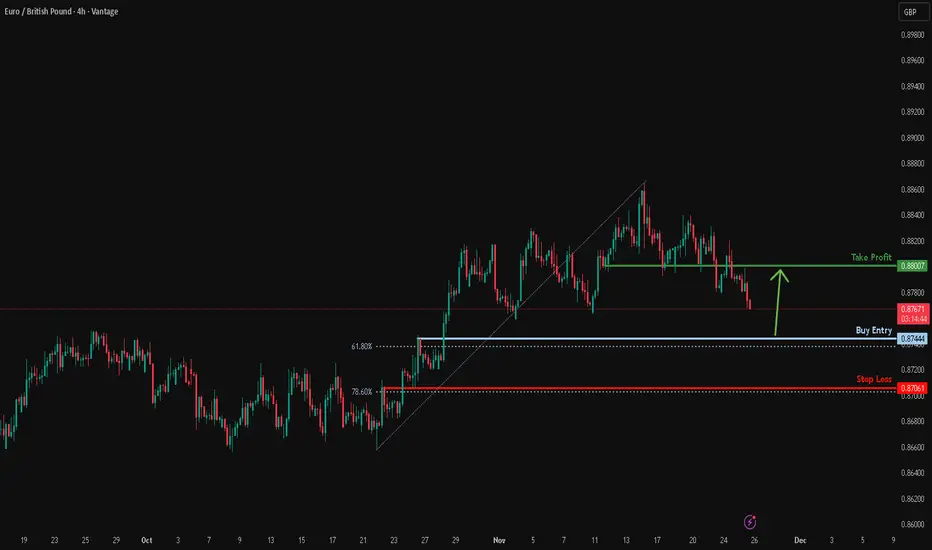
Falling towards pullback support?EUR/GBP is falling towards the support level which is a pullback support that is slightly above the 61.8% Fibonacci retracement and could bounce from this level to our take profit.
Entry: 0.8744
Why we like it:
There is a pullback support that is slightly above the 61.8% Fibonacci retracement.
Stop loss: 0.8706
Why we like it:
There is a pullback support that aligns with the 78.6% Fibonacci retracement.
Take profit: 0.8800
Why we like it:
There is an overlap resistance level.
Enjoying your TradingView experience? Review us!
Please be advised that the information presented on TradingView is provided to Vantage (‘Vantage Global Limited’, ‘we’) by a third-party provider (‘Everest Fortune Group’). Please be reminded that you are solely responsible for the trading decisions on your account. There is a very high degree of risk involved in trading. Any information and/or content is intended entirely for research, educational and informational purposes only and does not constitute investment or consultation advice or investment strategy. The information is not tailored to the investment needs of any specific person and therefore does not involve a consideration of any of the investment objectives, financial situation or needs of any viewer that may receive it. Kindly also note that past performance is not a reliable indicator of future results. Actual results may differ materially from those anticipated in forward-looking or past performance statements. We assume no liability as to the accuracy or completeness of any of the information and/or content provided herein and the Company cannot be held responsible for any omission, mistake nor for any loss or damage including without limitation to any loss of profit which may arise from reliance on any information supplied by Everest Fortune Group.
EURUSD Last bounce before a Lower Low.The EURUSD pair continues to trade within its 2-month Channel Down and following the start of the latest Bearish Leg since the November 13 Lower High rejection on the 1D MA50 (blue trend-line), we are now experiencing the first consolidation phase.
Based on the previous Bearish Legs of this pattern, this consolidation could end up in a short-term rebound limited by the 0.786 Fibonacci retracement level, only for it to be rejected and resume the bearish trend.
Both previous rejections eventually made a Lower Low for the Channel Down, hitting the -0.618 Fibonacci extension (minimum), declining in total Bearish Leg terms by at least -2.03%.
As a result, our 1.14200 medium-term Target (still above both conditions) remains valid, but we will close it earlier if we see the price hit the 1D MA200 (orange trend-line) and fail to close the 1D candle below it.
---
** Please LIKE 👍, FOLLOW ✅, SHARE 🙌 and COMMENT ✍ if you enjoy this idea! Also share your ideas and charts in the comments section below! This is best way to keep it relevant, support us, keep the content here free and allow the idea to reach as many people as possible. **
---
💸💸💸💸💸💸
👇 👇 👇 👇 👇 👇

EURUSD Sell from High Volume ZonesCurrent Situation
On EUR/USD, we observe activity from a large limit player at the 1.15116 level, which has stopped the price movement. Two high volume zones and two potential reversal levels have been identified where price reaction is possible.
Main Scenario
Considering selling from the high volume zones with the target of moving toward the 1.15116 level, where large player interest is located.
Alternative Scenario
If price does not reach the high volume zones and reverses earlier toward the 1.15116 level, the trade will be skipped due to an unfavorable risk-to-reward ratio.
Trading Plan
Entry Points: From high volume zones (marked on the chart)
Reversal Levels: Two levels marked on the chart
Target: 1.15116
Position Management
Profit-taking is planned on approach to the 1.15116 level or directly at this level.
Risk Management
Always consider the risk-to-reward ratio before entering. Place stop-loss above entry zones, accounting for instrument volatility.

EURGBP Potential UpsidesHey Traders, in today's trading session we are monitoring EURGBP for a buying opportunity around 0.87800 zone, EURGBP is trading in an uptrend and currently is in a correction phase in which it is approaching the trend at 0.87800 support and resistance area.
Trade safe, Joe.

Bearish reversal off 50% Fibonacci resistance?Fiber (EUR/USD) could rise towards the pivot and could reverse to the pullback support.
Pivot: 1.1567
1st Support: 1.1494
1st Resistance: 1.1623
Disclaimer:
The opinions given above constitute general market commentary and do not constitute the opinion or advice of IC Markets or any form of personal or investment advice.
Any opinions, news, research, analyses, prices, other information, or links to third-party sites contained on this website are provided on an "as-is" basis, are intended to be informative only, and are not advice, a recommendation, research, a record of our trading prices, an offer of, or solicitation for, a transaction in any financial instrument and thus should not be treated as such. The information provided does not involve any specific investment objectives, financial situation, or needs of any specific person who may receive it. Please be aware that past performance is not a reliable indicator of future performance and/or results. Past performance or forward-looking scenarios based upon the reasonable beliefs of the third-party provider are not a guarantee of future performance. Actual results may differ materially from those anticipated in forward-looking or past performance statements. IC Markets makes no representation or warranty and assumes no liability as to the accuracy or completeness of the information provided, nor any loss arising from any investment based on a recommendation, forecast, or any information supplied by any third party.

Bearish drop?EUR/USD has rejected off the resistance level which is an overlap resistance that aligns with the 38.2% Fibonacci retracement and could drop from this level to our take profit.
Entry: 1.1554
Why we like it:
There is an overlap resistance level that aligns with the 38.2% Fibonacci retracement.
Stop loss: 1.1602
Why we like it:
There a pullback resistance that is slightly above the 61.8% Fibonacci retracement.
Take profit: 1.1475
Why we like it:
There is a swing low support.
Enjoying your TradingView experience? Review us!
Please be advised that the information presented on TradingView is provided to Vantage (‘Vantage Global Limited’, ‘we’) by a third-party provider (‘Everest Fortune Group’). Please be reminded that you are solely responsible for the trading decisions on your account. There is a very high degree of risk involved in trading. Any information and/or content is intended entirely for research, educational and informational purposes only and does not constitute investment or consultation advice or investment strategy. The information is not tailored to the investment needs of any specific person and therefore does not involve a consideration of any of the investment objectives, financial situation or needs of any viewer that may receive it. Kindly also note that past performance is not a reliable indicator of future results. Actual results may differ materially from those anticipated in forward-looking or past performance statements. We assume no liability as to the accuracy or completeness of any of the information and/or content provided herein and the Company cannot be held responsible for any omission, mistake nor for any loss or damage including without limitation to any loss of profit which may arise from reliance on any information supplied by Everest Fortune Group.

Downtrend to continue: Next target 1.140EURUSD downtrend on daily chart in place, though we might see a minor pullback (especially if price makes HH on daily tomorrow): minor uptrend on hourly / 4hrs chart (price did make HH on 4 hrs today) - which I dont find safe to trade by going against the daily downtrend anyway. And even that pullback is not guaranteed as it might not even happen. In this situation, I am looking only for shorts with ultimate target at 1.140. At 1.140 we are very likely to see a major daily pullback reversal to 1.160, which might take many days / a few weeks. Hence I would exit and secure profits at 1.140 if you are in long-term positions.
FOR EDUCATIONAL PURPOSES ONLY

EURGBP: Looking for BuyEURGBP: Looking for Buy Opportunities from Institutional Zone
Current Situation
EUR/GBP price is located in the area of major market participants' activity. At the 0.88400 level, a price stop by limit players was recorded, followed by a decline to current values. This manipulation indicates institutional buyers' interest in this zone.
Key Levels
0.88400 — level where price was stopped by limit players before the decline
Current zone — high volume zone with institutional interest
0.87560 — lower support level for potential entry
Main Scenario
A price reversal upward from zones of institutional interest is expected. Limit players demonstrated activity at 0.88400, and the current decline creates favorable conditions for accumulating long positions before an upward movement to higher levels.
Three Development Scenarios
Scenario 1: Buy from Current Prices
Entry from current levels after confirmation at market open. Price reaction assessment and signs of support from buyers are required.
Scenario 2: Buy on Retest of High Volume Zone
Waiting for an additional touch of the high activity zone to confirm limit players' interest and form a safer entry.
Scenario 3: Buy from 0.87560 Level
Entry on decline to the lower support level, which will provide an optimal risk/reward ratio upon reversal confirmation.

Falling towards key support?Fiber (EUR/USD) is falling towards the pivot which has been identified as an overlap support and could bounce to the 1st resistance.
Pivot: 1.1370
1st Support: 1.1092
1st Resistance: 1.1651
Disclaimer:
The opinions given above constitute general market commentary and do not constitute the opinion or advice of IC Markets or any form of personal or investment advice.
Any opinions, news, research, analyses, prices, other information, or links to third-party sites contained on this website are provided on an "as-is" basis, are intended to be informative only, and are not advice, a recommendation, research, a record of our trading prices, an offer of, or solicitation for, a transaction in any financial instrument and thus should not be treated as such. The information provided does not involve any specific investment objectives, financial situation, or needs of any specific person who may receive it. Please be aware that past performance is not a reliable indicator of future performance and/or results. Past performance or forward-looking scenarios based upon the reasonable beliefs of the third-party provider are not a guarantee of future performance. Actual results may differ materially from those anticipated in forward-looking or past performance statements. IC Markets makes no representation or warranty and assumes no liability as to the accuracy or completeness of the information provided, nor any loss arising from any investment based on a recommendation, forecast, or any information supplied by any third party.
