EURCAD Reveals a Stunning Reversal You Can’t IgnoreHey everyone, Erik here.
EURCAD has been in a strong downtrend, though that bearish momentum is starting to lose its intensity. The market is now shaping what appears to be an inverse head and shoulders pattern, a classic sign that sellers may be running out of strength while buyers are beginning to show interest.
After the right shoulder formed, buyers made a confident move above the neckline, signaling a possible shift in market structure from bearish to bullish. At the moment, I’m watching for a short-term pullback toward the neckline area, a healthy retest that could confirm the strength of this move before any continuation higher.
As long as price holds above that level, the bullish scenario remains valid. The next upside target is around 1.63185, which aligns with the next resistance zone and the projected move derived from the pattern.
This setup is clean, logical, and full of potential. It illustrates how market momentum can shift naturally from exhaustion to recovery, hinting at the early stages of a possible trend reversal.
EURCAD

EURCAD: Will Start Falling! Here is Why:
Balance of buyers and sellers on the EURCAD pair, that is best felt when all the timeframes are analyzed properly is shifting in favor of the sellers, therefore is it only natural that we go short on the pair.
Disclosure: I am part of Trade Nation's Influencer program and receive a monthly fee for using their TradingView charts in my analysis.
❤️ Please, support our work with like & comment! ❤️

EUR/CAD: Bullish Outlook📈EURCAD formed a significant inverted head and shoulders pattern on a 4-hour timeframe.
The neckline for this pattern is identified between 1.6226 and 1.6210.
Should the price successfully break and close above this neckline, it would indicate a strong bullish signal.
In such a scenario, the market could potentially advance towards the 1.6560 level.
Please note that the neckline currently acts as a robust demand area. Shorting opportunities should only be considered after a confirmed breakout of this level.

Eurcad looking bullish here after fake out now formed heads and shoulders, currently trying to clear neckline area, after successful breakout it can rebound, and can give 150 to 180 pips bullish wave

EURCAD (4H) – Bullish RSI Divergence Hinting Potential Reversal EURCAD has recently printed a bullish divergence on the 4-hour timeframe — signaling potential exhaustion in the prior bearish leg and a possible shift in short-term momentum.
Price action shows a clear structure of lower lows on price, but higher lows on RSI, confirming the divergence setup.
Key Observations
RSI Divergence (Bullish):
Price made a new swing low while RSI failed to confirm it — forming a classic bullish divergence.
This suggests bearish momentum is weakening and early buyers may start entering the market.
Market Structure:
The pair broke above minor resistance and is currently retesting the zone near 1.6210 — aligning with a potential change of character (CHOCH) in short-term structure.
Momentum Confirmation:
RSI has recovered above the 50 line, indicating momentum is shifting in favor of buyers.
As long as RSI holds above 50, bullish bias remains valid.
Trade Setup
Entry Zone: Current market price (~1.6210–1.6220)
Stop Loss: Below the recent swing low at 1.6135
Target Zone: 1.6260–1.6300 (previous structural high / liquidity zone)
Risk-to-Reward Ratio: ~1:2
Trade Logic
This setup is based on bullish divergence confluence + market structure break.
If the bullish divergence plays out, we could see a corrective recovery toward the previous 4H supply zone.
However, failure to hold above 1.6130 would invalidate the setup and signal continuation of the bearish trend.
Scenario Outlook
Bullish Case: Divergence holds → push toward 1.6260–1.6300 resistance.
Bearish Case: Close below 1.6130 → continuation of the bearish leg.
Summary
The 4H bullish divergence offers a clean technical setup with clear invalidation and defined risk.
Momentum is turning, but confirmation via higher-high break is crucial before scaling in aggressively.
Bias: Short-Term Bullish (Counter-Trend Reversal Setup)
Timeframe: 4H
Key Level to Hold: 1.6130
Target: 1.6260 – 1.6300

Potential bullish reversal?EUR/CAD has bounced off the pivot, which is a multi-swing low support that aligns with the 61.8% Fibonacci projection, and could rise to the 1st resistance.
Pivot: 1.6164
1st Support: 1.6164
1st Resistance: 1.6309
Disclaimer:
The above opinions given constitute general market commentary, and do not constitute the opinion or advice of IC Markets or any form of personal or investment advice.
Any opinions, news, research, analyses, prices, other information, or links to third-party sites contained on this website are provided on an "as-is" basis, are intended only to be informative, is not an advice nor a recommendation, nor research, or a record of our trading prices, or an offer of, or solicitation for a transaction in any financial instrument and thus should not be treated as such. The information provided does not involve any specific investment objectives, financial situation and needs of any specific person who may receive it. Please be aware, that past performance is not a reliable indicator of future performance and/or results. Past Performance or Forward-looking scenarios based upon the reasonable beliefs of the third-party provider are not a guarantee of future performance. Actual results may differ materially from those anticipated in forward-looking or past performance statements. IC Markets makes no representation or warranty and assumes no liability as to the accuracy or completeness of the information provided, nor any loss arising from any investment based on a recommendation, forecast or any information supplied by any third-party.

EUR/CAD SENDS CLEAR BULLISH SIGNALS|LONG
Hello, Friends!
We are now examining the EUR/CAD pair and we can see that the pair is going down locally while also being in a downtrend on the 1W TF. But there is also a powerful signal from the BB lower band being nearby indicating that the pair is oversold so we can go long from the support line below and a target at 1.637 level.
Disclosure: I am part of Trade Nation's Influencer program and receive a monthly fee for using their TradingView charts in my analysis.
✅LIKE AND COMMENT MY IDEAS✅

EUR-CAD Local Short! Sell!
Hello,Traders!
EURCAD Price is reacting from a horizontal supply area after a corrective push upward. Smart money may seek liquidity below the previous lows before the next structural decision. Time Frame 2H.
Sell!
Comment and subscribe to help us grow!
Check out other forecasts below too!
Disclosure: I am part of Trade Nation's Influencer program and receive a monthly fee for using their TradingView charts in my analysis.

EUR/CAD BEARS ARE STRONG HERE|SHORT
Hello, Friends!
EUR/CAD pair is trading in a local uptrend which we know by looking at the previous 1W candle which is green. On the 6H timeframe the pair is going up too. The pair is overbought because the price is close to the upper band of the BB indicator. So we are looking to sell the pair with the upper BB line acting as resistance. The next target is 1.627 area.
Disclosure: I am part of Trade Nation's Influencer program and receive a monthly fee for using their TradingView charts in my analysis.
✅LIKE AND COMMENT MY IDEAS✅

EUR/CAD Retest Complete - Time to Go Long?🎯 EUR/CAD: The "Great Maple Heist" Setup | Swing/Day Trade 🍁💶
📊 Asset Overview
EUR/CAD (Euro vs. Canadian Dollar) - Forex Market
🔍 The Setup: Bullish Retest Play
The EUR/CAD is showing classic bullish confirmation with a pullback retest at the 38.2% Fibonacci retracement level, aligning beautifully with our weighted moving average. This is where the smart money layers in! 🧠💰
🎯 Entry Strategy: The "Thief Method"
Primary Approach: Layered limit orders (The legendary Thief OG style!)
Thief Layer Entry Levels:
Layer 1: 1.63000
Layer 2: 1.63250
Layer 3: 1.63500
Layer 4: 1.63550
Feel free to add more layers based on your risk appetite and position sizing!
Alternative: Market execution at current levels if you prefer immediate entry.
🛡️ Risk Management
Stop Loss: 1.62800 (Thief OG reference level)
⚠️ Note: Ladies & Gentlemen (Thief OG's), this is MY stop loss based on MY analysis. YOU set YOUR own stop loss based on YOUR risk tolerance. Trade at your own risk and protect your capital like it's the Crown Jewels! 👑
🎯 Profit Target
Target: 1.65300
This level represents a confluence of:
🧱 Strong resistance zone ("Electric Shock Wall")
📈 Overbought territory
🪤 Potential trap zone for late longs
⚠️ Note: Ladies & Gentlemen (Thief OG's), this is MY take profit level. YOU decide when to bank YOUR profits. The market gives, and the market takes—don't be greedy, take money when you can! 💸
🔗 Related Pairs to Watch
Keep an eye on these correlated pairs for confirmation:
🇺🇸 USD/CAD - Watch the Loonie's overall strength
Direct inverse correlation to EUR/CAD
Oil prices heavily influence CAD strength
💵 EUR/USD - Euro strength gauge
Shows Euro's overall market sentiment
Risk-on/risk-off indicator
🛢️ Crude Oil (WTI/Brent) - The CAD's best friend
CAD is a commodity currency
Higher oil = Stronger CAD = Pressure on EUR/CAD
Lower oil = Weaker CAD = Support for EUR/CAD
Key Correlation Point: If oil drops while EUR shows strength, this setup becomes even more favorable! 🎰
📝 Technical Summary
✅ Bullish structure intact
✅ 38.2% Fib retest complete
✅ Weighted MA providing support
✅ Multiple confluence factors
✅ Risk/Reward ratio: Favorable (~2.5:1)
⚠️ Disclaimer
This is the "Thief Style" trading strategy — a layered approach to swing/day trading created purely for educational and entertainment purposes. This is NOT financial advice. Trading forex carries substantial risk of loss and is not suitable for all investors. Always do your own research, manage your risk, and never trade with money you can't afford to lose. Past performance does not guarantee future results.
Trade safe, trade smart, and may the pips be ever in your favor! 🎲💎
✨ If you find value in my analysis, a 👍 and 🚀 boost is much appreciated — it helps me share more setups with the community!
#EURCAD #ForexTrading #SwingTrading #DayTrading #FibonacciRetracement #TechnicalAnalysis #ForexSignals #PriceAction #TradingStrategy #ThiefMethod #ForexSetup #CurrencyTrading #RiskManagement #ForexCommunity #TradingIdeas #CAD #EUR #ForexAnalysis #SupportAndResistance #MovingAverage

EURCAD Sellers In Panic! BUY!
My dear followers,
I analysed this chart on EURCAD and concluded the following:
The market is trading on 1.6164 pivot level.
Bias - Bullish
Technical Indicators: Both Super Trend & Pivot HL indicate a highly probable Bullish continuation.
Target - 1.6180
Safe Stop Loss - 1.6154
About Used Indicators:
A super-trend indicator is plotted on either above or below the closing price to signal a buy or sell. The indicator changes color, based on whether or not you should be buying. If the super-trend indicator moves below the closing price, the indicator turns green, and it signals an entry point or points to buy.
Disclosure: I am part of Trade Nation's Influencer program and receive a monthly fee for using their TradingView charts in my analysis.
———————————
WISH YOU ALL LUCK

EURCAD | Liquidity Draw Toward HTF Order BlockPrice remains inside a higher-time-frame bullish structure and is now retracing into the 1.60–1.61 breaker block / BC correction zone — a logical refuel area before continuation.
Above, there’s an unmitigated HTF order block at 1.68–1.70 , likely the next draw on liquidity.
That zone should be mitigated before any true macro bearish shift.
Plan
Bias: short-term bullish continuation into 1.68–1.70
Entry: confirmation from the breaker around 1.60–1.61
Stop: below 1.576 (macro invalidation)
Target: 1.68–1.70 (HTF mitigation zone)
– After mitigation, watching for bearish structure to form
The correction still has business above — the HTF OB remains unmitigated.
Let’s see if EURCAD completes the move.

EURCAD - Buy the Bounce at Confluence!📈EURCAD remains in a steady rising channel on the daily. Price has pulled back into a strong support zone that perfectly aligns with the channel’s lower bound and the base of the recent micro wedge.
🏹As long as this confluence holds, I’ll be looking for trend-following longs from here, aiming first for the recent highs, then the channel top.
⚠️ Disclaimer: This is not financial advice. Always do your own research and manage risk properly.
📊All Strategies Are Good; If Managed Properly!
~Richard Nasr

EURCAD Will Explode! BUY!
My dear subscribers,
This is my opinion on the EURCAD next move:
The instrument tests an important psychological level 1.6228
Bias - Bullish
Technical Indicators: Supper Trend gives a precise Bullish signal, while Pivot Point HL predicts price changes and potential reversals in the market.
Target - 1.6286
About Used Indicators:
On the subsequent day, trading above the pivot point is thought to indicate ongoing bullish sentiment, while trading below the pivot point indicates bearish sentiment.
Disclosure: I am part of Trade Nation's Influencer program and receive a monthly fee for using their TradingView charts in my analysis.
———————————
WISH YOU ALL LUCK

EURCAD⬆️ Buy Entry: 1.62420 - 1.62180
⏹️ Stop Loss: 1.61850
*️⃣ Take Profit: 1.62880 - 1.63170
🔠 Price consolidation near local support levels (15M). A short-term strengthening of the euro and an impulsive breakout of the pair above 1.63000 are expected. We are also closely monitoring the publication of statistics.

EURCAD - Bounce Play at the Rail!EURCAD has been respecting its ascending channel beautifully , bouncing between the rails like clockwork. And right now, price is once again retesting the lower trendline, where buyers have consistently stepped in before launching new bullish waves.
🏹As long as this trendline and minor support around 1.62 hold firm, I’ll be watching closely for bullish rejections or reversal patterns to confirm a fresh leg upward. A clean bounce from here could send price back toward the orange structure zone around 1.6350, followed by a potential push toward 1.64+ if momentum builds up.
⚔️However, a break and close below 1.6180 would invalidate the setup and could shift control back to the bears — but until that happens, the path of least resistance remains to the upside.
In short, I’m expecting EURCAD to trap late sellers and fuel another rebound from the channel’s base, the kind of move that rewards patience and precision.
📊 All Strategies Are Good; If Managed Properly!
~Richard Nasr

EURCAD → Retest of liquidity pool before growth FX:EURCAD is forming a correction to the key liquidity zone amid a global and fairly strong bullish trend. Will the bulls enter the game in the 1.6173 zone?
The euro is forming a correction to the strong support zone of 1.16, which is provoking a decline in the currency pair. The key area that the currency pair is striving for is 1.6173. The trend is bullish. A reaction from the bulls is possible...
A false breakout of resistance is forming a correction. However, the price is still within the trading range of 1.64 - 1.6173. The price is heading towards support for a retest, and the indicated zone is likely to stop the correction...
Resistance levels: 1.633, 1.64
Support levels: 1.6173, 1.603
A liquidity pool below 1.62 - 1.617 could change the game in favor of buyers. Remember, the trend is bullish, and this will be a clear advantage for players. A false breakdown of support and the absence of a downward momentum could trigger growth.
Best regards, R. Linda!

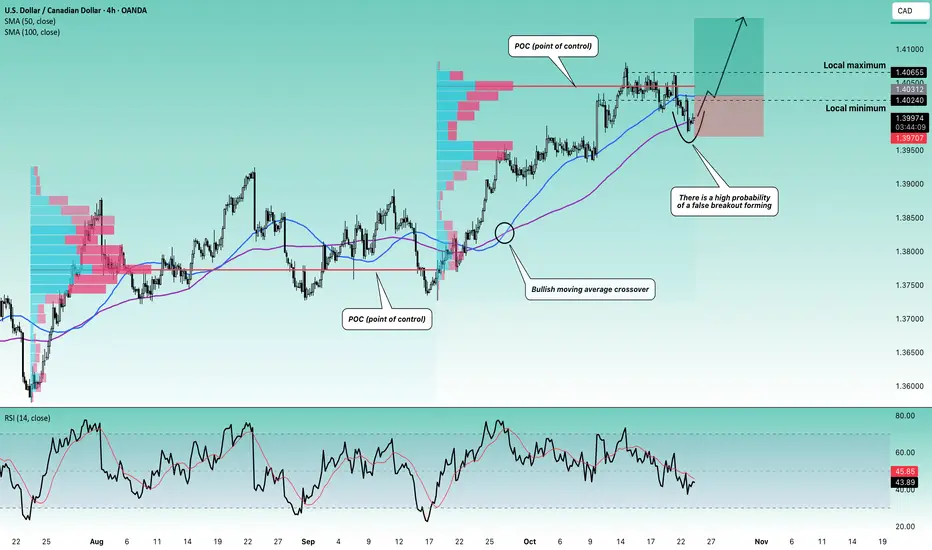
Stop!Loss|Market View: USDCAD🙌 Stop!Loss team welcomes you❗️
In this post, we're going to talk about the near-term outlook for the USDCAD currency pair☝️
Potential trade setup:
🔔Entry level: 1.40312
💰TP: 1.41455
⛔️SL: 1.39707
"Market View" - a brief analysis of trading instruments, covering the most important aspects of the FOREX market.
👇 In the comments 👇 you can type the trading instrument you'd like to analyze, and we'll talk about it in our next posts.
💬 Description: The focus on the accumulation area of 1.40240 - 1.40655 remains despite the breakout of its lower border. We are currently most likely observing the formation of a false breakout. The main scenario is the price closing above 1.40240 again, thereby forming a false breakout. Buy trades towards 1.41000 and 1.42000 can be actively looked for in this case. A more conservative option is to look for a buy trade via a breakout of the upper border of 1.40655.
Thanks for your support 🚀
Profits for all ✅
❗️ Updates on this idea can be found below 👇
EURCAD INTRADAY (15m)TECHNICAL SNAPSHOT
Pair: EUR/CAD
Timeframe: 15m
Trend: Bearish drift; lower highs with momentum push down into green buy-zone.
🔴 STOP / RESISTANCE (top-down)
• 1.62700 — Sell Stop/Invalidation (overhead pivot)
• 1.62650 — Sell Limit (prior supply shelf)
• 1.62600 — Take-profit magnet for counter-trend bounces
🎯 ENTRIES & TARGETS (top-down)
• 1.62500 — TP (bounce fade)
• 1.62346 — Buy Stop (break-back above micro structure)
• 1.62250 — Buy Limit (first demand)
• 1.62200 — Buy Limit (deeper demand)
• 1.62130 — Stretch TP / reload zone
• 1.62100 — Final TP / exhaust probe
🟢 SUPPORT (top-down)
• 1.62346 — Intraday support/flip line
• 1.62250 — Demand 1
• 1.62200 — Demand 2
• 1.62130 — Deep demand
• 1.62100 — Extreme demand
Indicators: Price below recent swing mid; momentum bars expanding red; wicks show sell pressure into the green zone.
Notes:
• Structure: sequence of lower highs; blue midlines = prior TP/rotation marks.
• Tactics: Look for rejection near 1.6250–1.6265 to continue short; watch 1.6220–1.6213 for responsive bids.

Falling towards major support?EUR/CAD is falling towards the support level which is a multi-swing low support that aligns with the 61.8% Fibonacci retracement and could bounce from this level to our take profit.
Entry: 1.61790
Why we like it:
There is a multi-swing low support that aligns with the 61.8% Fibonacci retracement.
Stop loss: 1.61235
Why we like it:
There is a pullback support that aligns with the 78.6% Fibonacci retracement.
Take profit: 1.63069
Why we like it:
There is a pullback resistance level.
Enjoying your TradingView experience? Review us!
Please be advised that the information presented on TradingView is provided to Vantage (‘Vantage Global Limited’, ‘we’) by a third-party provider (‘Everest Fortune Group’). Please be reminded that you are solely responsible for the trading decisions on your account. There is a very high degree of risk involved in trading. Any information and/or content is intended entirely for research, educational and informational purposes only and does not constitute investment or consultation advice or investment strategy. The information is not tailored to the investment needs of any specific person and therefore does not involve a consideration of any of the investment objectives, financial situation or needs of any viewer that may receive it. Kindly also note that past performance is not a reliable indicator of future results. Actual results may differ materially from those anticipated in forward-looking or past performance statements. We assume no liability as to the accuracy or completeness of any of the information and/or content provided herein and the Company cannot be held responsible for any omission, mistake nor for any loss or damage including without limitation to any loss of profit which may arise from reliance on any information supplied by Everest Fortune Group.

EURCAD My Opinion! BUY!
My dear friends,
Please, find my technical outlook for EURCAD below:
The instrument tests an important psychological level 1.6247
Bias - Bullish
Technical Indicators: Supper Trend gives a precise Bullish signal, while Pivot Point HL predicts price changes and potential reversals in the market.
Target - 1.6323
About Used Indicators:
Super-trend indicator is more useful in trending markets where there are clear uptrends and downtrends in price.
Disclosure: I am part of Trade Nation's Influencer program and receive a monthly fee for using their TradingView charts in my analysis.
———————————
WISH YOU ALL LUCK

Potential bearish drop?EUR/CAD is reacting off the pivot which is a pullback resistance and could drop to the multi swing low support.
Pivot: 1.62744
1st Support: 1.61635
1st Resistance: 1.63349
Disclaimer:
The above opinions given constitute general market commentary, and do not constitute the opinion or advice of IC Markets or any form of personal or investment advice.
Any opinions, news, research, analyses, prices, other information, or links to third-party sites contained on this website are provided on an "as-is" basis, are intended only to be informative, is not an advice nor a recommendation, nor research, or a record of our trading prices, or an offer of, or solicitation for a transaction in any financial instrument and thus should not be treated as such. The information provided does not involve any specific investment objectives, financial situation and needs of any specific person who may receive it. Please be aware, that past performance is not a reliable indicator of future performance and/or results. Past Performance or Forward-looking scenarios based upon the reasonable beliefs of the third-party provider are not a guarantee of future performance. Actual results may differ materially from those anticipated in forward-looking or past performance statements. IC Markets makes no representation or warranty and assumes no liability as to the accuracy or completeness of the information provided, nor any loss arising from any investment based on a recommendation, forecast or any information supplied by any third-party.

EURCAD: Long Trading Opportunity
EURCAD
- Classic bullish formation
- Our team expects pullback
SUGGESTED TRADE:
Swing Trade
Long EURCAD
Entry - 1.6368
Sl - 1.6350
Tp - 1.6405
Our Risk - 1%
Start protection of your profits from lower levels
Disclosure: I am part of Trade Nation's Influencer program and receive a monthly fee for using their TradingView charts in my analysis.
❤️ Please, support our work with like & comment! ❤️
