EURCAD Sellers In Panic! BUY!
My dear friends,
Please, find my technical outlook for EURCAD below:
The price is coiling around a solid key level - 1.6329
Bias - Bullish
Technical Indicators: Pivot Points High anticipates a potential price reversal.
Super trend shows a clear buy, giving a perfect indicators' convergence.
Goal - 1.6360
About Used Indicators:
The pivot point itself is simply the average of the high, low and closing prices from the previous trading day.
Disclosure: I am part of Trade Nation's Influencer program and receive a monthly fee for using their TradingView charts in my analysis.
———————————
WISH YOU ALL LUCK
EURCAD


EUR/CAD BEARISH BIAS RIGHT NOW| SHORT
Hello, Friends!
Bearish trend on EUR/CAD, defined by the red colour of the last week candle combined with the fact the pair is overbought based on the BB upper band proximity, makes me expect a bearish rebound from the resistance line above and a retest of the local target below at 1.620.
Disclosure: I am part of Trade Nation's Influencer program and receive a monthly fee for using their TradingView charts in my analysis.
✅LIKE AND COMMENT MY IDEAS✅

Stop!Loss|Market View: USDCAD🙌 Stop!Loss team welcomes you❗️
In this post, we're going to talk about the near-term outlook for the USDCAD currency pair☝️
Potential trade setup:
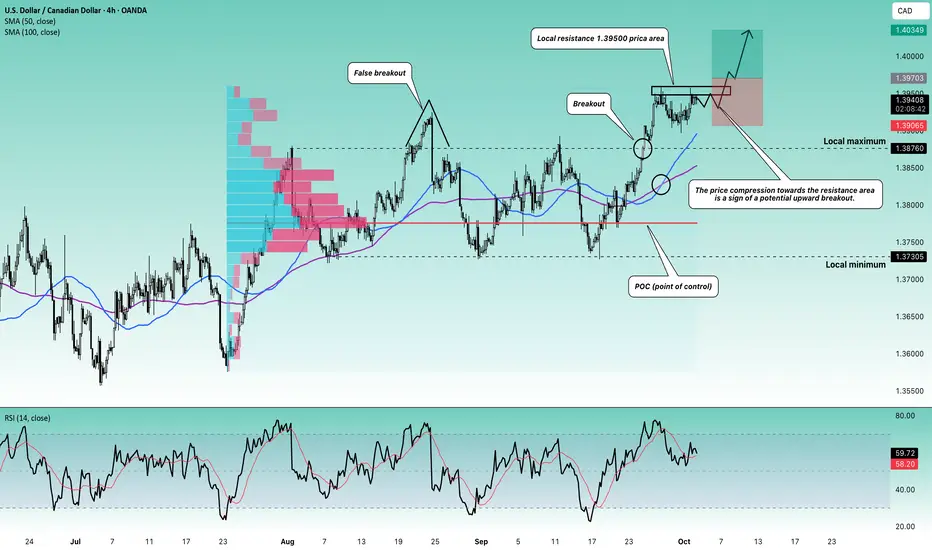
🔔Entry level: 1.39703
💰TP: 1.40349
⛔️SL: 1.39065
"Market View" - a brief analysis of trading instruments, covering the most important aspects of the FOREX market.
👇 In the comments 👇 you can type the trading instrument you'd like to analyze, and we'll talk about it in our next posts.
💬 Description: The price compression toward the 1.39500 resistance area indicates a potential upside breakout. Given the recent breakout of the 1.37305 - 1.38760 accumulation, a more significant upward movement to 1.4, 1.41, and then 1.43 is also expected. A conservative entry would be best looked for after the price immediately closes above 1.39500.
Thanks for your support 🚀
Profits for all ✅
❗️ Updates on this idea can be found below 👇
EURCAD A Fall Expected! SELL!
My dear friends,
My technical analysis for EURCAD is below:
The market is trading on 1.6384 pivot level.
Bias - Bearish
Technical Indicators: Both Super Trend & Pivot HL indicate a highly probable Bearish continuation.
Target - 1.6339
About Used Indicators:
A pivot point is a technical analysis indicator, or calculations, used to determine the overall trend of the market over different time frames.
Disclosure: I am part of Trade Nation's Influencer program and receive a monthly fee for using their TradingView charts in my analysis.
———————————
WISH YOU ALL LUCK

EURCAD | Wave E CompletedResistance: 1.6350 – 1.6360 (wave e top)
Sell Target: 1.6322 (first liquidity level)
Further downside possible if breakdown continues.
🔎 Elliott Wave Perspective:
ABCDE correction looks complete.
Market preparing for next impulsive leg down.
⚡ Bias: Bearish below 1.6360
🎯 Targets: 1.6322 / 1.6270 / lower liquidity
📌 Invalidation: Break & close above 1.6370
---

EURCAD: Pullback Depth Depends on Euro Data📊 EURCAD has been trending strongly to the upside, and my overall bias remains bullish 📈.
📰 That said, we have a key data release scheduled within the next hour or two that could provide direction for the euro.
🔎 If the data is positive for the euro, I’d expect only a shallow pullback before continuation. If the data comes out negative, we could see a deeper retracement before buyers step back in.
📈 Despite this, the higher timeframe structure is firmly bullish. My plan is to wait for the news release, watch for the pullback, and on the 30-minute chart, look for a bullish break of market structure to time an entry 🚀.
⚠️ Disclaimer: This analysis is for educational purposes only and not financial advice. Always trade responsibly and manage risk appropriately.

EURCAD: Trend ContinuationA cautious trade for this week's open, expecting volatility to remain low on a Sunday night.
Daily Timeframe
Price is in an uptrend as EMA20 remains above EMA60, and price is also bouncing off of EMA20
Price recently broke above the HTL marked
H1 Timeframe
Price is accelerating away from the EMA20, and EMA20 is expanding away from EMA60
Price also crossed above the DTL

EURCAD is in The Bullish TrendHello Traders
In This Chart EURCAD HOURLY Forex Forecast By FOREX PLANET
today EURCAD analysis 👆
🟢This Chart includes_ (EURCAD market update)
🟢What is The Next Opportunity on EURCAD Market
🟢how to Enter to the Valid Entry With Assurance Profit
This CHART is For Trader's that Want to Improve Their Technical Analysis Skills and Their Trading By Understanding How To Analyze The Market Using Multiple Timeframes and Understanding The Bigger Picture on the Charts

EUR/CAD BEARS WILL DOMINATE THE MARKET|SHORT
EUR/CAD SIGNAL
Trade Direction: short
Entry Level: 1.632
Target Level: 1.625
Stop Loss: 1.636
RISK PROFILE
Risk level: medium
Suggested risk: 1%
Timeframe: 9h
Disclosure: I am part of Trade Nation's Influencer program and receive a monthly fee for using their TradingView charts in my analysis.
✅LIKE AND COMMENT MY IDEAS✅


EURCAD: Swing Trading & Technical Analysis
The analysis of the EURCAD chart clearly shows us that the pair is finally about to tank due to the rising pressure from the sellers.
Disclosure: I am part of Trade Nation's Influencer program and receive a monthly fee for using their TradingView charts in my analysis.
❤️ Please, support our work with like & comment! ❤️

EURCAD Sell Reaction from FVG ZonePrice has made a strong push up and is now heading towards the FVG retracement zone.
This area is a potential supply zone where sellers may step in.
📉 My expectation → pullback move towards 1.62264.
If price rejects from the FVG, we could see a continuation to the downside.
I will be watching how candles react when price touches that retracement zone for confirmation.

EURCAD Breakout and Retest , All Eyes on SellingHello Traders
In This Chart EURCAD HOURLY Forex Forecast By FOREX PLANET
today EURCAD analysis 👆
🟢This Chart includes_ (EURCAD market update)
🟢What is The Next Opportunity on EURCAD Market
🟢how to Enter to the Valid Entry With Assurance Profit
This CHART is For Trader's that Want to Improve Their Technical Analysis Skills and Their Trading By Understanding How To Analyze The Market Using Multiple Timeframes and Understanding The Bigger Picture on the Charts


EURCAD: Long Signal Explained
EURCAD
- Classic bullish pattern
- Our team expects retracement
SUGGESTED TRADE:
Swing Trade
Buy EURCAD
Entry - 1.6217
Stop - 1.6201
Take - 1.6247
Our Risk - 1%
Start protection of your profits from lower levels
Disclosure: I am part of Trade Nation's Influencer program and receive a monthly fee for using their TradingView charts in my analysis.
❤️ Please, support our work with like & comment! ❤️

EURCAD A Fall Expected! SELL!
My dear friends,
Please, find my technical outlook for EURCAD below:
The instrument tests an important psychological level 1.6289
Bias - Bearish
Technical Indicators: Supper Trend gives a precise Bearish signal, while Pivot Point HL predicts price changes and potential reversals in the market.
Target - 1.6257
About Used Indicators:
Super-trend indicator is more useful in trending markets where there are clear uptrends and downtrends in price.
Disclosure: I am part of Trade Nation's Influencer program and receive a monthly fee for using their TradingView charts in my analysis.
———————————
WISH YOU ALL LUCK

Bullish continuation above key support?EUR/CAD is falling towards the pivot, which serves as a pullback support that aligns with the 50% Fibonacci retracement and could bounce back to the 1st resistance, which acts as a pullback resistance.
Pivot: 1.61864
1st Support: 1.61261
1st Resistance: 1.63589
Disclaimer:
The above opinions given constitute general market commentary, and do not constitute the opinion or advice of IC Markets or any form of personal or investment advice.
Any opinions, news, research, analyses, prices, other information, or links to third-party sites contained on this website are provided on an "as-is" basis, are intended only to be informative, is not an advice nor a recommendation, nor research, or a record of our trading prices, or an offer of, or solicitation for a transaction in any financial instrument and thus should not be treated as such. The information provided does not involve any specific investment objectives, financial situation and needs of any specific person who may receive it. Please be aware, that past performance is not a reliable indicator of future performance and/or results. Past Performance or Forward-looking scenarios based upon the reasonable beliefs of the third-party provider are not a guarantee of future performance. Actual results may differ materially from those anticipated in forward-looking or past performance statements. IC Markets makes no representation or warranty and assumes no liability as to the accuracy or completeness of the information provided, nor any loss arising from any investment based on a recommendation, forecast or any information supplied by any third-party.

EURCAD: Potential Long Setup
Market Context
Price swept liquidity below the previous daily low and then broke structure to the upside, signaling a potential shift in market direction. This could be the beginning of a bullish leg if price respects demand on the pullback.
Key Technicals
Clear liquidity sweep (CRT) beneath recent lows
Bullish BOS on the 4H timeframe
Watching for price to retrace back into the imbalance (FVG) area
FVG aligns closely with the 50 EMA and 0.5–0.618 Fibonacci retracement zone on the 15m chart
Plan is to look for rejection or confirmation candle within this confluence area
Trade Plan
Wait for price to return into the FVG + 50 EMA + Fib confluence zone
Enter only if a clear rejection or engulfing candle forms
Direction: Longs only while price holds above 50 EMA
Target: Liquidity above recent highs around 1.63600
Invalidation: If price breaks below the sweep low and closes under demand
Summary
Price has shifted bullish after a liquidity sweep. A pullback into demand + FVG zone could offer a high-probability long setup if confirmation appears.


SHORT ON EUR/CADEUR/CAD has a nice rising channel at a major resistance area.
There is a lot of Liquidity to the downside.
I have a sell limit set at the top of the channel to activate me after the possible sweep of liquidity behind the resistance line of the channel.
Looking to catcu 300-400 pips on this play.
