EURCAD 4HR LONG SETUPEURCAD 4HR :
EURCAD after crossing 4hr Trendline Price Currently moving towards Day Level Resistance Zone.
If it crosses resistance zone and day trendline ..Wait for Retest and then Go LONG..
Eurcadsignal


EURCAD price testing monthly support may rise for 1.5490 & 1.553Eur 13k long positions increased by professionals by last week, Commercials increased shorts 14k by last week. Eur long% increased 3% by last week. Professionals increased 2k shorts in Canadian, while Commercials increased 4k shorts in this week.
Price making lower low and lower high on daily time frame. but due to support around 1.5380-36 may suspect correction upside.

EURCAD, Retesting Support, LongEURCAD, Retesting Support and continue Bullish uptrend! Trade when the Price action Tells!

EURCAD: Diagonal pattern in the weekly chartEURCAD: Diagonal pattern in the weekly chart, Triangle pattern in the daily chart
( Weekly Chart )
In the weekly chart, the largest waves have a triple structure, so monitoring the charts shows the end of the chart is in a form of 3-wave pattern that starts from the range of 1.2129. According to these explanations, the price is forming an Ending Diagonal pattern in this time frame. In continuation, we will study the daily chart and the details of the movement.
( Daily Chart )
In the daily chart, the price is in the final wave of the Diagonal pattern, of which the B wave is forming the triangle pattern, and the movement is terminating. The uptrend formation and the end of the Triangle pattern can be confirmed by crossing the price from the range of 1.5785.
But the main point can be seen in the 240-minute chart, in this chart at the end of the E wave the Diagonal pattern is being formed. By crossing the price from the range of 1.5600 we can get the early confirmation to enter the completion of the Triangle pattern with targets of 1.6250 to 1.6300.


EURCAD | Perspective for the new weekWe experienced 230pips run in our direction on my last publication (see link below for reference purposes) on this pair with another trading opportunity building up again!
It is very interesting to observe that the market has continuously made its decision around the CA$1.55700 level since July 2020 which tells me that we can be confident to find a quick trading opportunity on this one!
Tendency: Downtrend ( Bearish )
Structure: Breakdown | Supply & Demand | Trendline
Observation: i. Since on the 22nd of Dec 2020, the price has found Lower lows respecting the Bearish trendline that led to the recent Breakdown of CA$1.55700 followed by a sharp rejection of this level last week.
ii. Considering the significance of our key level; The leg that broke down CA$1.55700 might experience correction back into this level for a decline continuation in the coming week.
iii. In this regard, I shall be looking for a significant level around the Key level/Trendline to find a safe haven for a selling opportunity this week.
iv. Lest I forget, I am looking forward to seeing buyers do quick activities around CA$1.5470 level after which selling opportunity will surface... Be patient :)
Trading plan: SELL confirmation with a minimum potential profit of 220 pips.
Risk/Reward : 1:4
Potential Duration: 2 to 5 days
NB: This speculation can be considered to make decisions on lower timeframes.
Watch this space for updates as price action is been monitored.
Risk Disclaimer:
Margin trading in the foreign exchange market (including foreign exchange trading, CFDs, etc.) has a high risk and is not suitable for all investors. The content of this speculation (including all data) is organized and published by me for the sole purpose of education and assistance in making independent investment decisions. All information herein is for your reference only and I take no responsibility.
You are hereby advised to carefully consider your investment experience, financial situation, investment objective, risk tolerance level, and consult your independent financial adviser as to the suitability of your situation prior to making any investment.
I do not guarantee its accuracy and is not liable for any loss or damage which may result directly or indirectly from such content or the receipt of any instruction or notification therewith.
Past performance is not necessarily indicative of future results.

EURCAD I WISH EVERYONE COULD EAT THE PIPS WITH ME From the Daily time frame perspective EURCAD is ready to go LONG
Don't forget to like and follow us


EURCAD | perspective for the new weekSince a successful Breakout on the 12th of Nov. 2020, Price found Demand zone @ CAD1.54800 eight good times before finally finding the momentum to Break out off Bearish trendline @ CAD1.55100 towards the end of the trading session on Friday to make a Bullish statement.
Tendency: Uptrend (Bullish )
Structure: Trendline | Supply & Demand
Observation: i. Price continues to respect Bullish Trendline on the Weekly chart to emphasize the prevailing direction of price.
ii. Price rejects CAD1.54800 level eight times since on the 16th of Nov. 2020 to finally Breakout off Key level @ CAD1.55200 which also coincides with Breakout off the Bearish trendline.
iii. Key Level shall remain a yardstick for buying option for me in the coming week.
Trading plan: BUY confirmation with a minimum potential profit of 120 pips.
Risk/Reward: 1:5
Potential Duration: 1 to 3 days
NB: This speculation can be considered to make decisions on lower timeframes.
Watch this space for updates as price action is been monitored.
Risk Disclaimer:
Margin trading in the foreign exchange market (including foreign exchange trading, CFDs, etc.) has a high risk and is not suitable for all investors. The content of this speculation (including all data) is organized and published by me for the sole purpose of education and assistance in making independent investment decisions. All information herein is for your reference only and I take no responsibility.
You are hereby advised to carefully consider your investment experience, financial situation, investment objective, risk tolerance level, and consult your independent financial adviser as to the suitability of your situation prior to making any investment.
I do not guarantee its accuracy and is not liable for any loss or damage which may result directly or indirectly from such content or the receipt of any instruction or notification therewith.
Past performance is not necessarily indicative of future results.

EURCAD Bullish Trade SetupIn the EURCAD chart above, the price made a five-wave impulse rally, in wave "i". According to the Elliot Wave principle, a three-wave correction in the opposite direction follows every impulse move.
In EURCAD's case, the corrective move has been taking the shape of a double-three pattern which seems to be completed or still has the potential to make another leg down in wave (Y).
While putting the probabilistic scenario of wave (Y) in consideration, the break of the green line will indicate the completion of the corrective structure and signal the resumption of the bullish impulse.
I just have my buy stop set at the level and waiting for the market to do is things. What's your view on EURCAD?
Best of luck on the chart,
Veejahbee.


EurCad- nice bullish setupAfter a very short-lived dive under 1.5450 support, EurCad has recovered quickly and reached 1.56 resistance.
In the last 4 trading days the pair traded in 100 pips range between 1.55 and 1.56 and I believe this range will be broken to the upside.
Buy dips is my strategy for this pair with a soft target at 1.5650 and a medium-term target at 1.57 resistance


EURCAD price at Resistance levelprice touching the resistance level if we close above 1.568 than it's clear we are moving to 1.60
if we rejected from here than we can go down and make the head and shoulder pattern than ready to move ahead


EUR/CAD: LONG trade setupall in the picture
I advise to check the trade 6hrs from now and book some gains, at least to move the stop into the money.
good luck !

EUR/CAD Sell Opportunity Below 1.5600 EUR/CAD Sell Stop @1.5600
SL: 1.5840
TP1: 1.5440
TP2: 1.5240
TP3: 1.5100

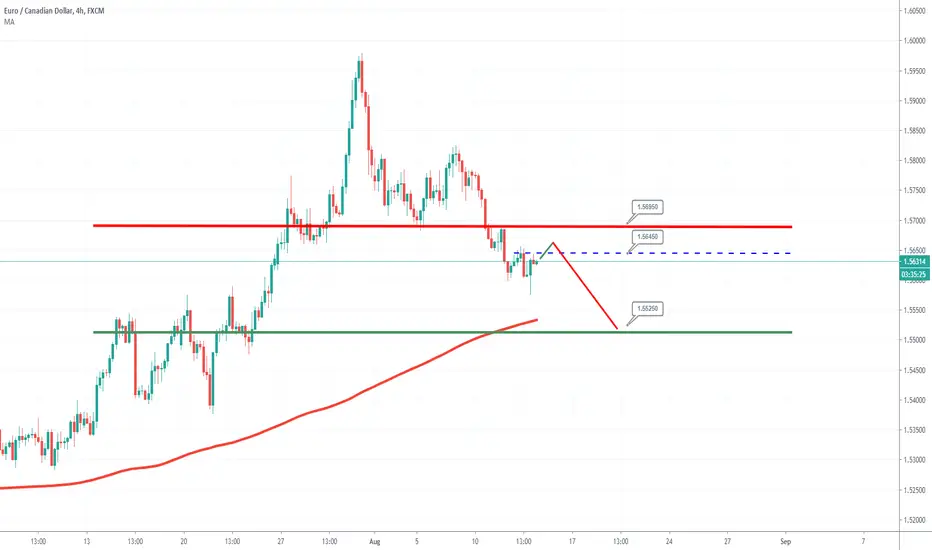
EURCAD SELL at 1.56450 SL 1.56950 TP 1.55250The EURCAD chart H4 time frame we see bullish momentum starting from 6th July and reached its recent high on 31st July near the price at 1.59780, then EUR losing it's bullish momentum and CAD start gaining against EUR. We also see on the H4 chart EURCAD just breakout its new critical support level at a price near 1.56580 8th August. We expect more down within a couple of days, so we are going to short on EURCAD from 1.56450 with a tight stop loss at 1.56950, and our target level will be at this price of 1.5525.