Eurcadtrade

EUR/CAD Multi-Time frame analysisHi Traders
EUR/CAD Multi-Timeframe analysis
H1 Chart (Bearish)
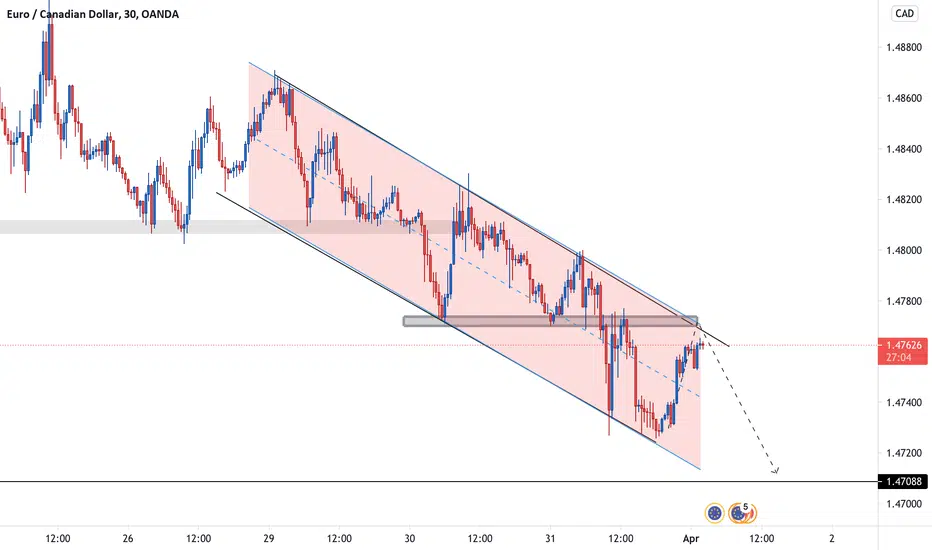
A medium probability, entry signal to go SHORT will be given after the completion of a bearish trend reversal on the lower time frame at 1.46867 after the market found resistance at 1.47157 . Only the upward break of 1.47157 would cancel the bearish scenario.
Support & Resistance
1.46686 1.47146
1.46415 1.47270
1.45955 1.47431
H4 Chart (Bullish)
The completion of a trend reversal formation at 1.47288 has forced us to close our position earlier than we had planned. Now we are looking for the next opportunity to enter the market.
Support & Resistance
1.47410 1.47757
1.46415 1.47997
1.45810 1.48992
Daily Chart (Bearish)
The completion of a trend reversal formation at 1.47607 has forced us to close our position earlier than we had planned. Now we are looking for the next opportunity to enter the market.
Support & Resistance
1.47237 1.48156
1.45810 1.52092
1.44426 1.53833
Weekly Chart (Strong Up)
Waiting for a retracement higher towards the 1.47237 resistance level in order to reinstate SHORT positions. Next important resistance is the 1.50518 level.
Support & Resistance
1.45810 1.47237
1.44478 1.50518
1.42626 1.51914

EURCAD; Short, for now.This is dropping strait onto the 200 Months Ema. (In conjunction with a final Equities Blow-off Top ). - After which, this should be a one-way Long for the better part of "forever". (EUR positive account balance vs. CAD, a purely speculative bubble - in no small part where the Wilshire5000 / GDP having just hit 200%!)
The Weekly;

EURCAD - BUY to the targetOne more Drop to the 0.5
then BUY to the 0.618 target
LIKE - COMMENT - SHARE , the best analysis on the tradingview
I NEED YOU SUPPORT TO GROW!

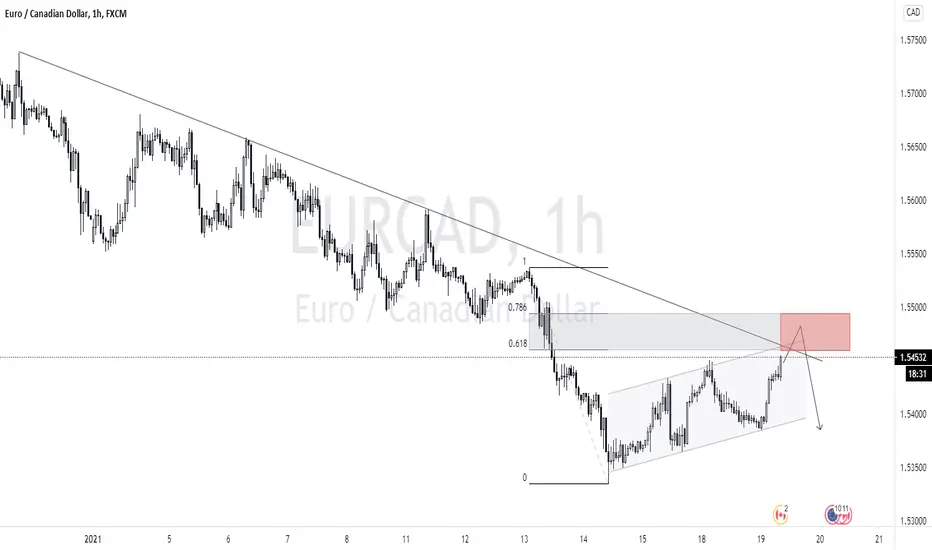
EUR CAD SHORT ENTRY IM GOING SHORT ON THIS MARKET , DUE :
- RSI DIVERGNCE ON 15 MIN
- BROKEN RESSISTANCE
- 0,61 FIB RETRACEMENT
CONCULSION :
BETTER TO YOU TO FIND SHORT ENTRY BUT KEEP ON MIND THE REVERSAL , DUE THE SOLID TREND & THE H&S PATTERN !

#EURCAD creating a SHS pattern, wait for confirmation!#EURCAD creating a SHS pattern, wait for confirmation!


Bearish on EURCADClean bearish channel forming.
Price was able to break previous support level, wait to sell on the retest.
EURCAD will fly any moment EURCAD bullish pattern ready to a spike up next months
Watch lower timeframes for the best entries for the up movement
Good luck


EUR/CAD Multi-Timeframe analysis (03/02)Hi Traders
EUR/CAD Multi-Timeframe analysis (03/02)
H1 Chart (Bearish)
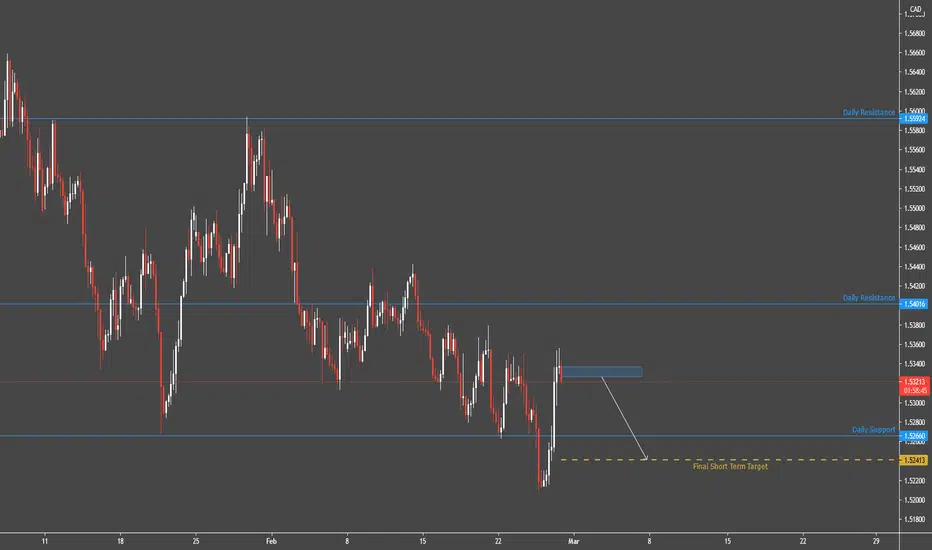
Target 2 at 1.52525 has been reached. We closed the remaining 50% of our position and now we are looking for the next opportunity to enter the market.
Support & Resistance
1.53327 1.53548
1.53030 1.53833
1.52898 1.53965
H4 Chart (Strong UP)
The market is approaching the support at 1.52821 . We are waiting to see reversal signals in order to reinstate LONG positions. Next important support is the 1.52619 level.
Support & Resistance
1.52821 1.53124
1.52619 1.53498
1.52092 1.53833
Daily Chart (Strong Down)
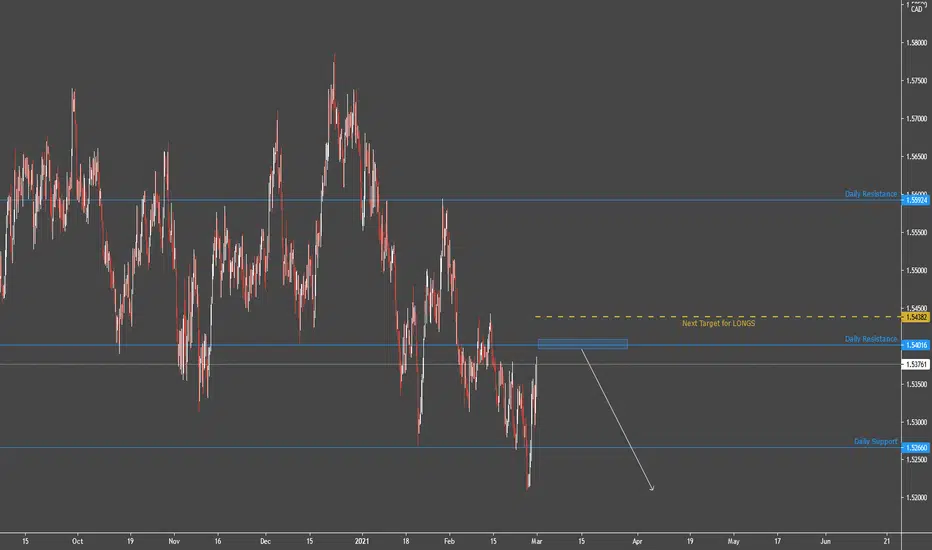
The market is approaching the resistance at 1.54016 . We are waiting to see reversal signals in order to reinstate SHORT positions. Next important resistance is the 1.55924 level.
Support & Resistance
1.52666 1.54016
1.52092 1.55924
1.51065 1.57096
Weekly Chart (Neutral)
The market is dominated by uncertainty. The occasionally prevailing trend lasts for a limited time and changes its direction too frequently. As long as the market remains unstable, we stay aside, waiting for the market to get back on track.
Support & Resistance
1.52666 1.59912
1.50518 1.62060
1.47707 1.64871

EUR/CAD Multi-Timeframe analysis (Update)Hi Traders
EUR/CAD Multi-Timeframe analysis (Update)
H1 CHART ( Bullish )
A medium probability, entry signal to go LONG was given at 1.53623 after the market found support at 1.53317 . Only the downward break of 1.53317 would cancel the bullish scenario.
Support & Resistances
1.53328 1.53548
1.53030 1.53735
1.52898 1.53975
H4 CHART ( Neutral )
Conflicting technical signals are indicating towards an unstable market, cautioning us to remain neutral and wait for a stronger trend to develop.
Support & Resistances
1.53124 1.53498
1.52619 1.53782
1.52092 1.54414
DAILY CHART ( Strong Down )
Waiting for a retracement higher towards the 1.52666 resistance level in order to reinstate SHORT positions. Next important resistance is the 1.54016 level.
Support & Resistances
1.52660 1.52666
1.50744 1.54016
1.47486 1.55924
WEEKLY CHART ( NEUTRAL )
The market is dominated by uncertainty. The occasionally prevailing trend lasts for a limited time and changes its direction too frequently. As long as the market remains unstable, we stay aside, waiting for the market to get back on track.
Support & Resistances
1.52666 1.59912
1.50518 1.62060
1.47707 1.64871
EUR/CAD Multi-Timeframe analysisHi Traders
EUR/CAD Multi-Timeframe analysis
H1 CHART ( Strong Up )
The market is approaching the support at 1.53258 . We are waiting to see reversal signals in order to reinstate LONG positions. Next important support is the 1.53039 level.
Support & Resistances
1.53258 1.53486
1.53039 1.53548
1.52678 1.53719
H4 CHART ( BEARISH )
Conflicting technical signals are indicating towards an unstable market, cautioning us to remain neutral and wait for a stronger trend to develop.
Support & Resistances
1.53124 1.53498
1.52619 1.53782
1.52092 1.54414
DAILY CHART ( NEUTRAL )
Waiting for a retracement higher towards the 1.52666 resistance level in order to reinstate SHORT positions. Next important resistance is the 1.54016 level.
Support & Resistances
1.52660 1.52666
1.50744 1.54016
1.47486 1.55924
WEEKLY CHART ( NEUTRAL )
The market is dominated by uncertainty. The occasionally prevailing trend lasts for a limited time and changes its direction too frequently. As long as the market remains unstable, we stay aside, waiting for the market to get back on track.
Support & Resistances
1.52666 1.59912
1.50518 1.62060
1.47707 1.64871
EURCAD - LONG; Buy it up!!Like the title says.
While the EU still maintains a positive account balance, the BoC couldn't steal, print or borrow and other dime (not even a Canadian one), even if their life depended on it.
Here is the Daily;


EUR/CAD Multi-Timeframe analysisHi Traders
EUR/CAD Multi-Timeframe analysis
H1 CHART ( BEARISH )
Waiting for a retracement higher towards the 1.53175 resistance level in order to reinstate SHORT positions. Next important resistance is the 1.53780 level.
Support & Resistances
1.52790 1.53175
1.52213 1.53780
1.51227 1.54766
H4 CHART ( BEARISH )
A medium high probability, entry signal to go SHORT was given at 1.53151 after the market found resistance at 1.53804 . Only the upward break of 1.53804 would cancel the bearish scenario.
Support & Resistances
1.53120 1.53782
1.52821 1.54414
1.52255 1.54980
DAILY CHART ( NEUTRAL )
The market is dominated by uncertainty. The occasionally prevailing trend lasts for a limited time and changes its direction too frequently. As long as the market remains unstable, we stay aside, waiting for the market to get back on track.
Support & Resistances
1.52666 1.54016
1.50744 1.55924
1.47486 1.57096
WEEKLY CHART ( NEUTRAL )
The market is dominated by uncertainty. The occasionally prevailing trend lasts for a limited time and changes its direction too frequently. As long as the market remains unstable, we stay aside, waiting for the market to get back on track.
Support & Resistances
1.52666 1.59912
1.50518 1.62060
1.47707 1.64871

EURCAD ANALYSISEURCAD ANALYSIS
falling wedge
breakout
pullback
demand zone
confirmation buy
Please consider to put a like to my idea for supporting me & subscribe for more ideas.
Idea is not the financial advice!


EURCAD - SHORT; Right here, it's still a short ...... But we'll be BUYing up that Stop Hunt like there was no tomorrow!!
Here is the Weekly;


EURCAD bullish flagAs we can see a regular bullish flag in H1 chart. and upper trendline.
So we expect a fakeout near trendline before short term fall.
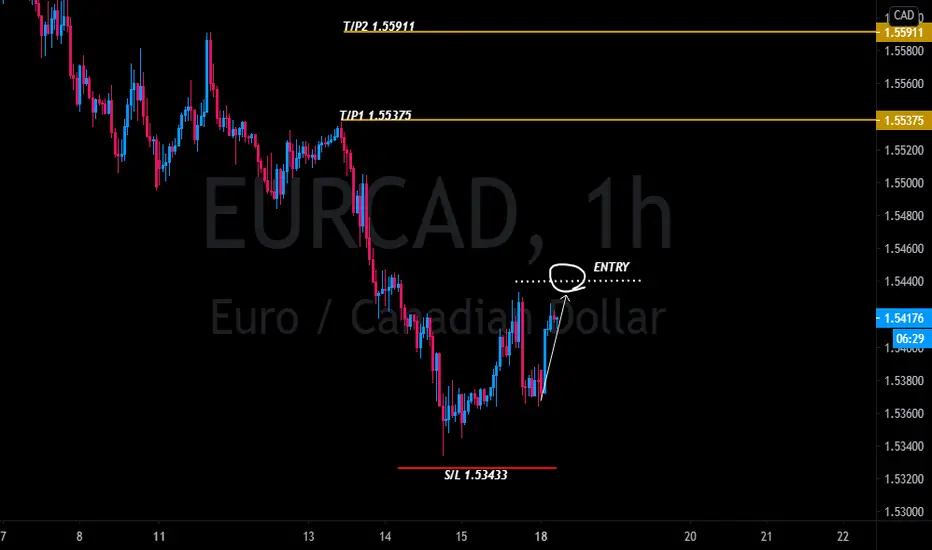
EURCAD/ LONGFX:EURCAD
S/L 1.53433 - T/P1 1.55375 - T/P2 1.55911 - T/P3 1.56659 - T/P4 1.57380 - T/P5 1.57858